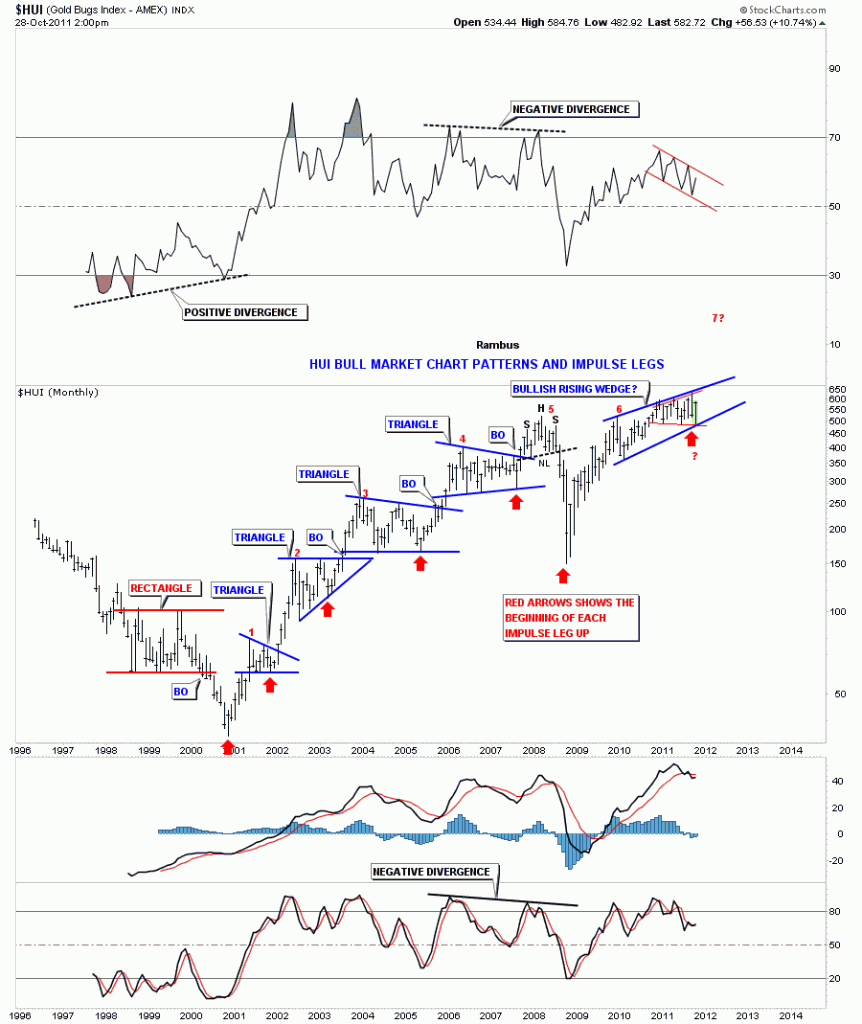
What is an impulse move and where does one begin? An impulse move is a very strong move that takes place after a period of consolidation or at the end of a very large decline. Depending on what time frame you are looking at they can be small if you are looking at minute charts or they can be very large if our are looking at a daily or weekly chart. An impulse move starts from the last reversal point within a consolidation pattern just before the breakout. The HUI bull market is a text book example of what an impulse leg looks like. From the very beginning of it’s bull market in early 2001 there have been 6 impulse legs higher, red numbers on the chart below. Two have started at the bottoms and the rest during consolidation patterns. The two bottoms where an impulse leg got started was the bear market low in 2001 and then after the 2008 crash. When you look at the chart of the HUI below it becomes very obvious what an impulse leg looks like. They are the straight line advances out of the consolidation patterns.
HUI weekly bull market chart patterns and impulse legs.
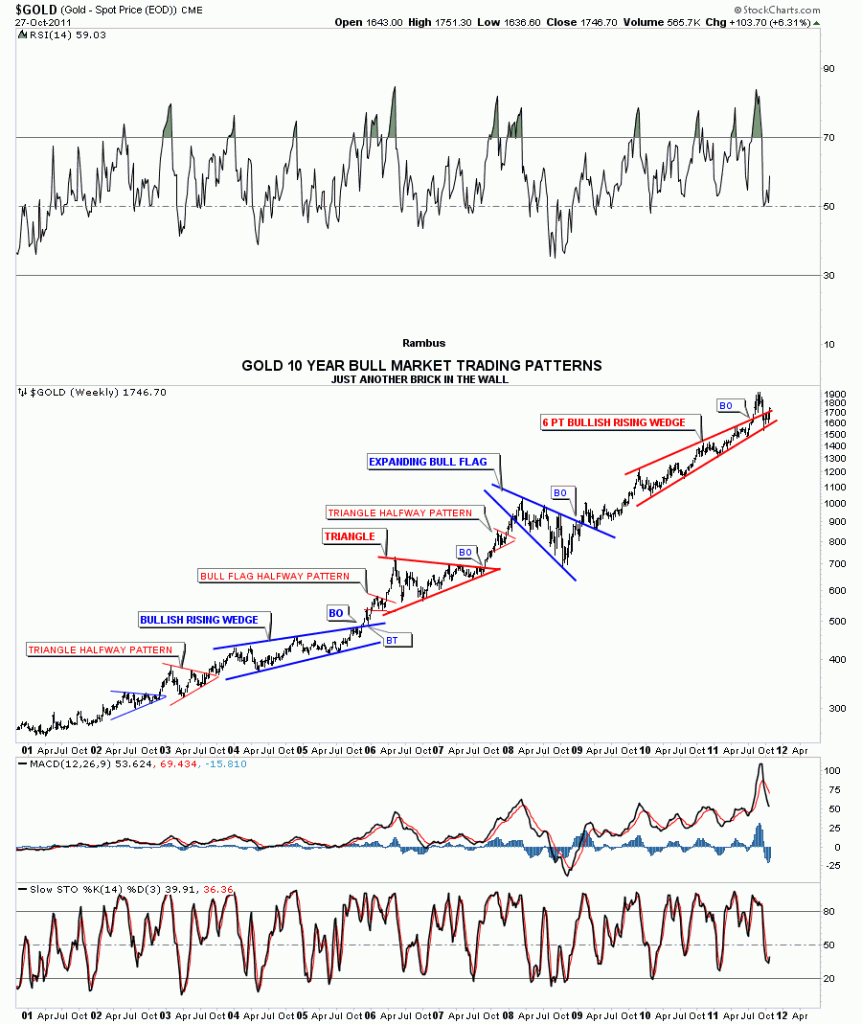
Gold has also been creating nice consolidation patterns and impulse legs since the beginning of it’s bull market. Alot of times an impulse leg up will be divided into two equal parts with a smaller halfway pattern that shows up in the middle of the move. I’ve labeled two little red triangles as halfway patterns on the chart below. You can see they came right in the middle of the impulse leg up. One at the end of 2005 and the other in 2007.
Gold weekly chart patterns with impulse legs in between.
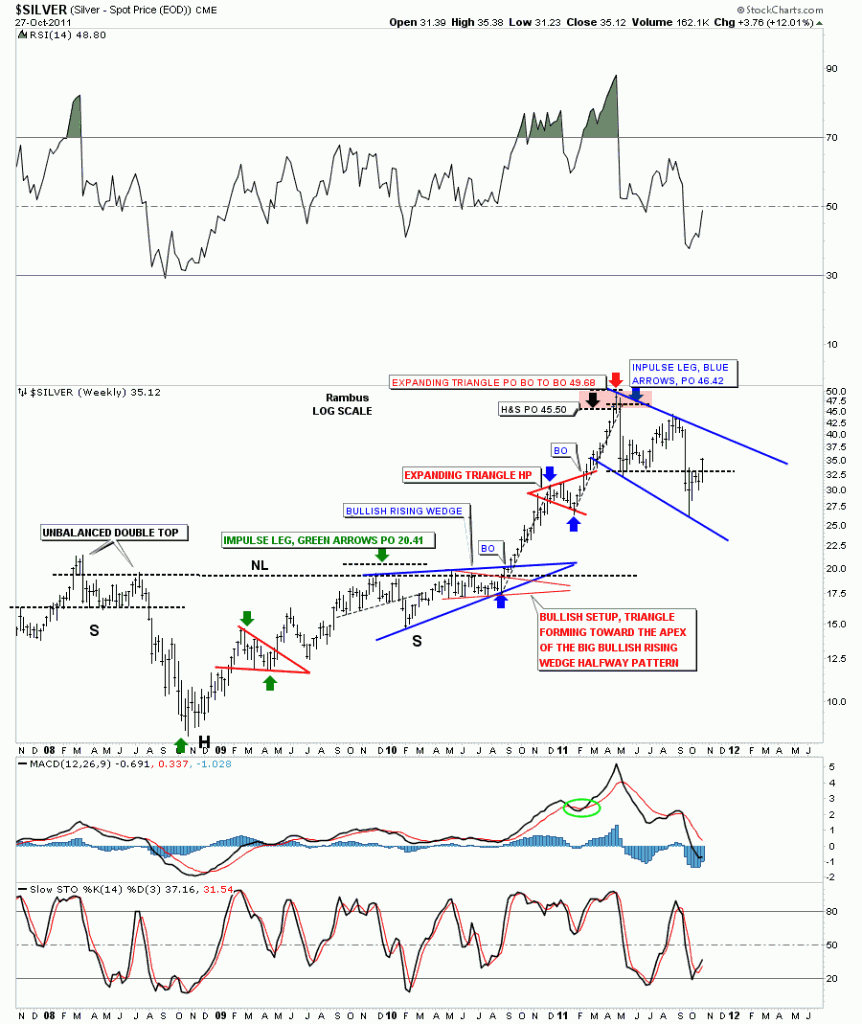
Lets take a look at Silver’s last impulse leg up to the 50 area. It was a text book move divided by an expanding triangle halfway pattern. On the silver chart below there are two impulse legs measured by the green and blue arrows. Just remember an impulse leg starts from the last reversal point within the consolidation pattern. Impulse legs are the power moves during a bull market.
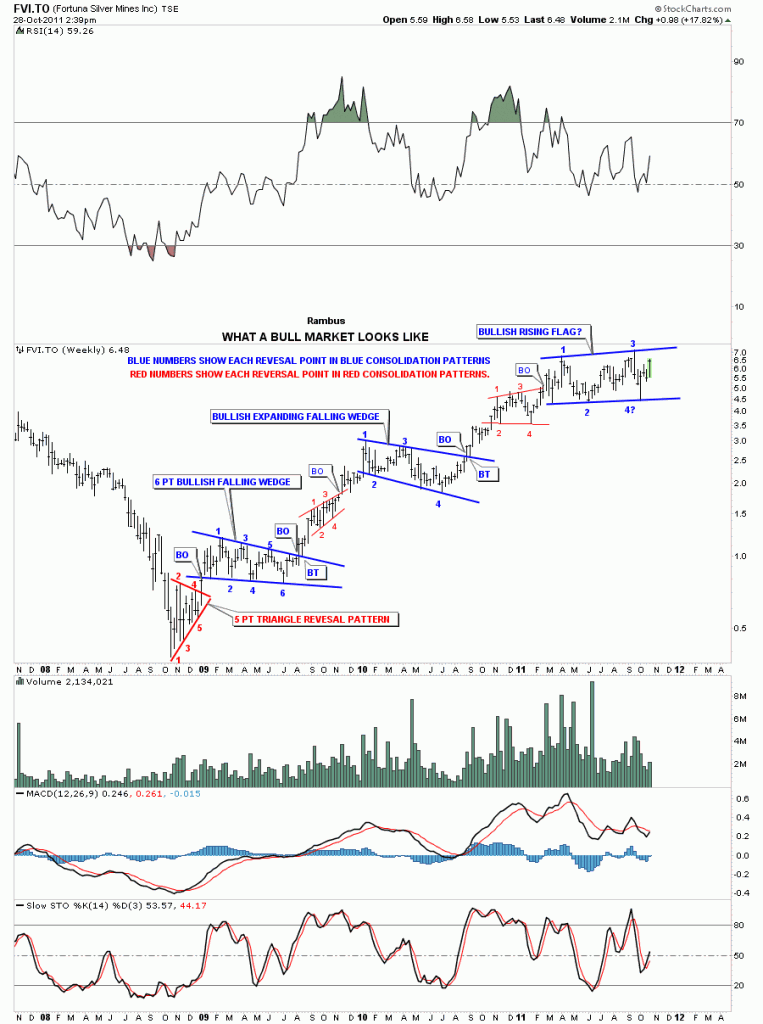
Lets take one more look at what an impulse looks and feels like. Below is a chart from our model portfolio that shows each impulse leg higher off the 2008 crash low. The big blue consolidation patterns are where the energy is derived from to create the next impulse leg up. The smaller consolidation patterns are roughly the halfway point during the impulse leg higher. If you look at our latest blue consolidation pattern you may begin to understand what might be coming down the road in the not to distance future. Understanding how markets works, from a chartists point of view, can give you an edge in knowing what and where to look for certain things to develop.
FVI.TO weekly look.
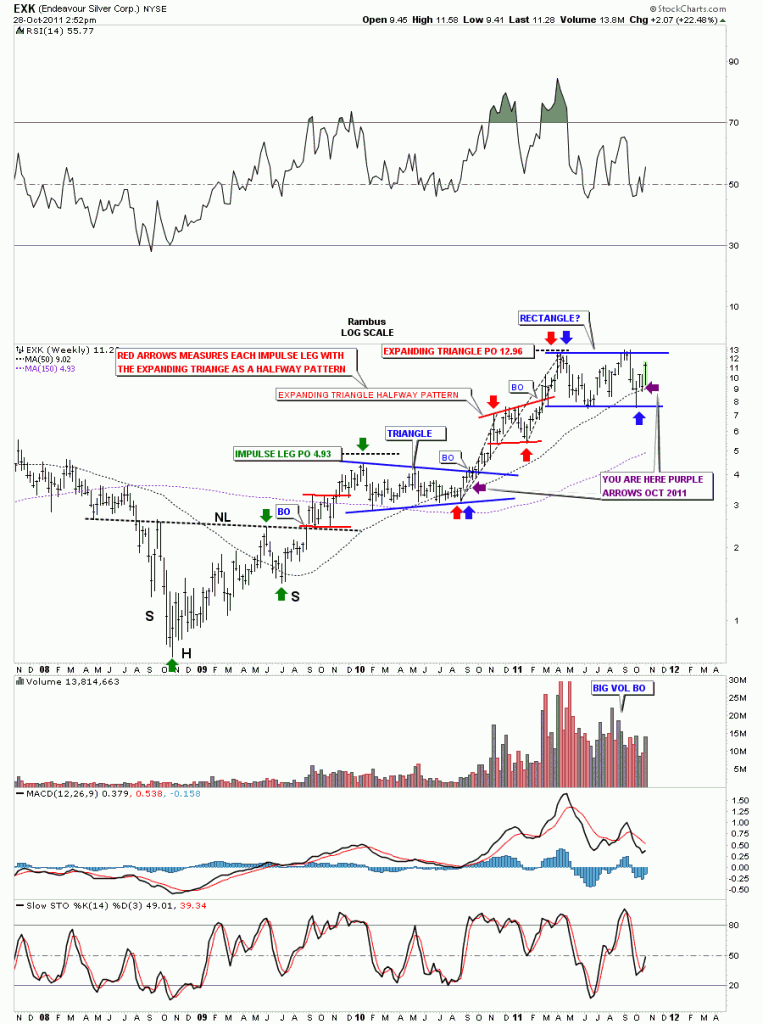
I posted this chart a couple of weeks ago showing where I think we are in context of the big picture. Note the purple arrows, your are here, on the chart below. If this is truly the start of the next big impulse leg higher you can see what lies ahead of us. Impulse moves are NOT to be traded. They are to be rode like a wild bronco for 8 seconds and then you jump off after the impulse leg is finished and wait for the next consolidation phase to begin.
EXK weekly look, you are here.

