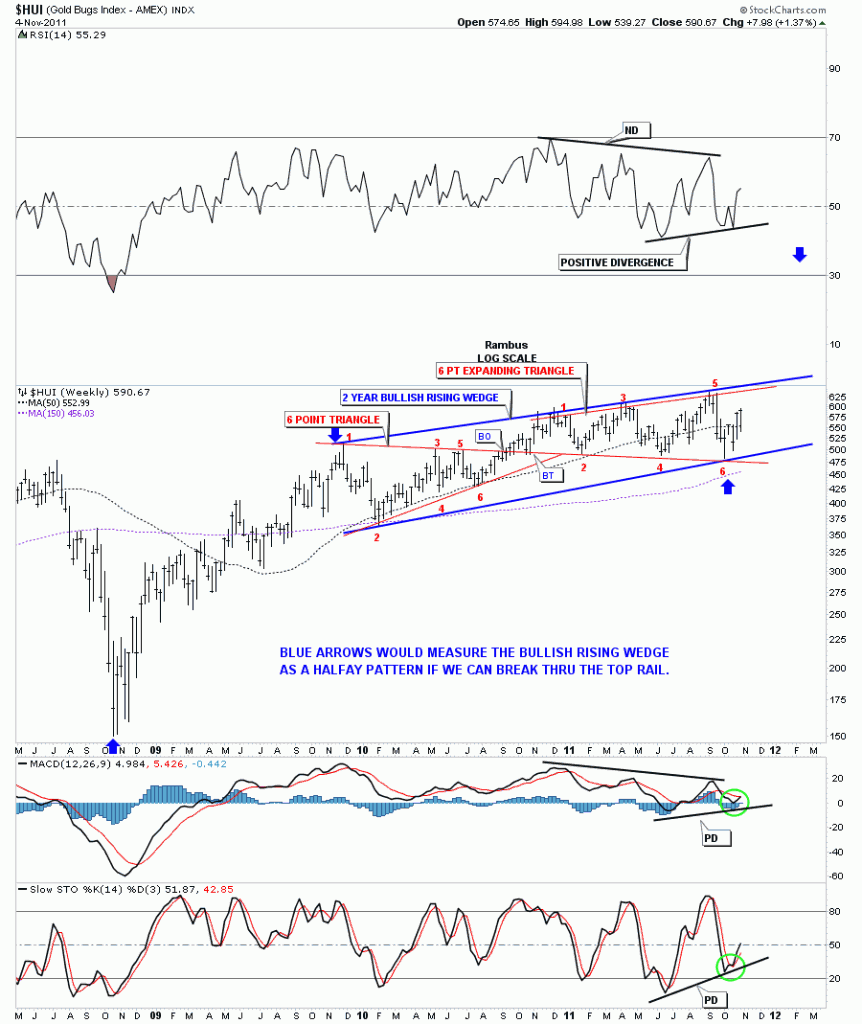
This was a volatile week for the precious metals stocks along with the stock markets. Tuesday was a pivotal day when everything was hard down, doing their backtest, to their breakout points. The market quickly recovered and left a long tail on the bar chart signaling there was a good chance the bottom was in.. The weekly chart will show you why the H&S bottom, that has been forming for the last five weeks, is critical to the long term look.
On the chart below you will notice a big blue pattern that is a 2 year rising wedge.. The rising wedge pattern has 2 separate smaller patterns in red. The first one is a triangle that failed to reach it’s price objective and our current one is an expanding triangle.They were both 6 point consolidation patterns. Whenever a pattern fails, like the triangle above, it usually becomes part of a bigger pattern, like the bullish rising wedge is showing now. Also notice the positive divergences on the indicators.The reason I believe this 2 year bullish rising wedge is a big deal is because it could very well be a halfway pattern. The blue arrows on the chart shows how I would measure it. Think of that big 2 year bullish rising wedge as a running correction. I know it doesn’t feel like a running correction but that, in fact, is what is happening right now. How we inter act with the top rail of the rising wedge will give us some more clues as to it’s validity. All in all it was a very positive week for the HUI. From Tuesday’s low at 539, the HUI gained about 50 points. Not bad for 3 1/2 days work. Enjoy your weekend….Rambus
HUI weekly look.

