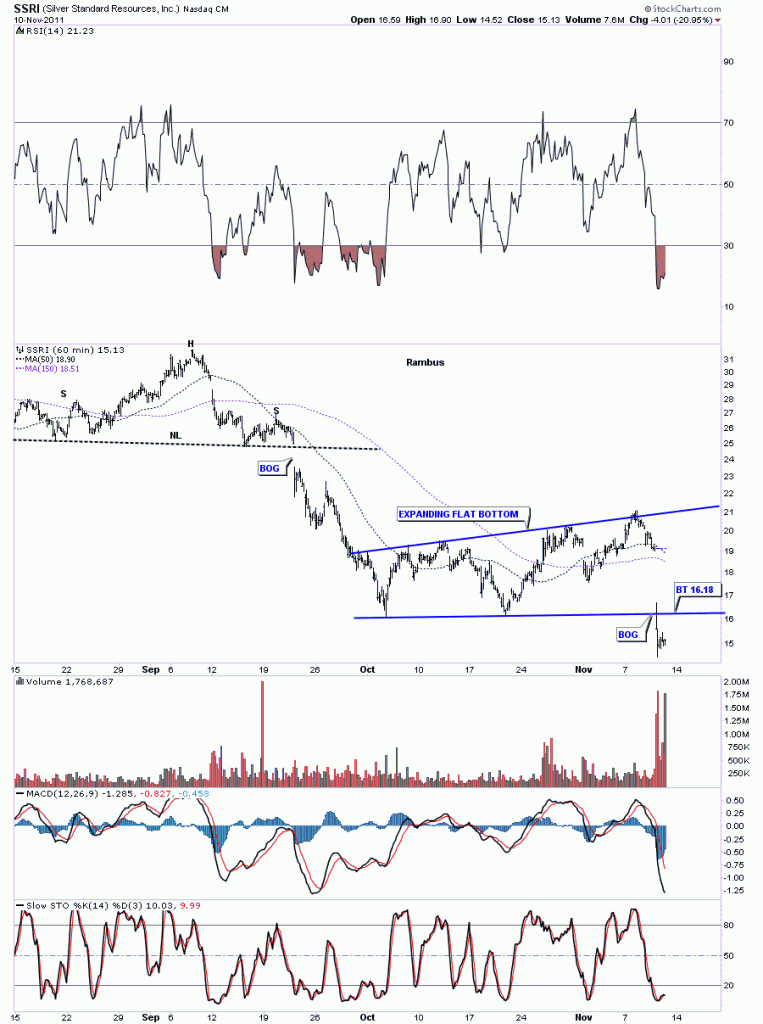
This weeks stock review comes from a new subscriber, flasinthepan, who is interested in SSRI as he’s been holding it for sometime now. Today’s action was not pretty as the stock gaped down 2 points on the opening and didn’t look back. The pattern on the 60 minute chart broke down from an expanding flat bottom triangle. The breakout came on extremely heavy volume giving investors little chance to get out.
SSRI 60 minute breakout.
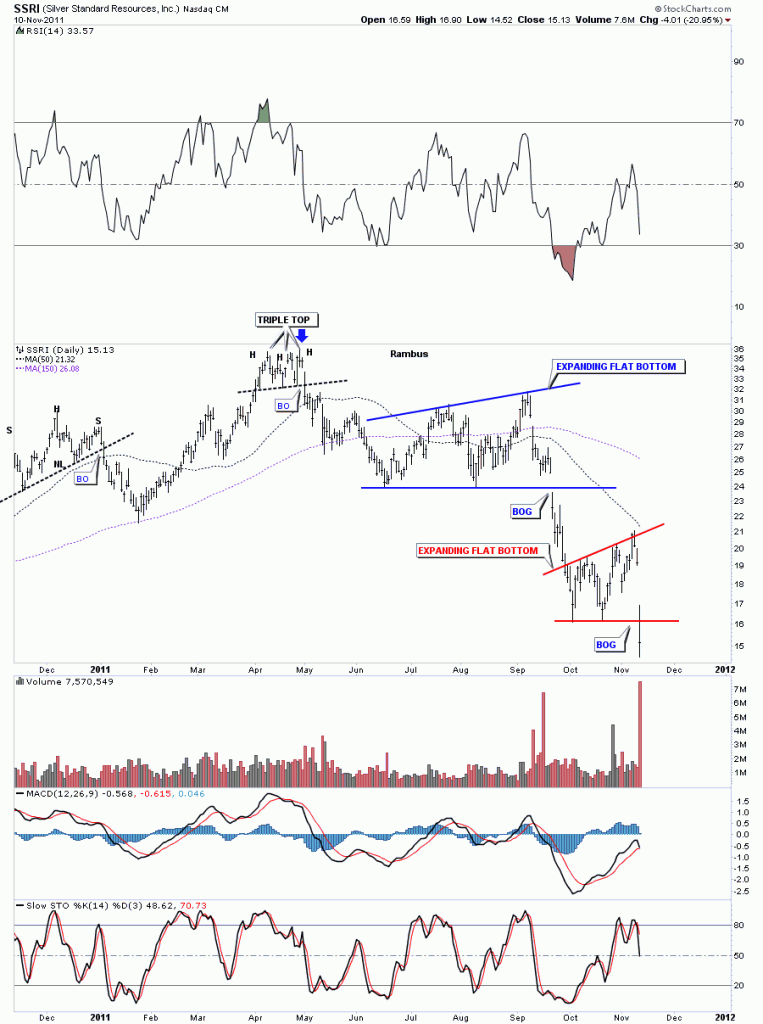
The daily look is just as ugly as the 60 minute. Note the blue expanding flat bottom triangle that formed just above our smaller one. The thing about either a flat top or flat bottom pattern is that the breakout usually occurs thru the flat horizontal rail. This stock has been cut in half since it hit it’s high back in April – May of this year. Notice the big gaps that accompanied each breakout from the expanding flat bottom triangles. Also note today’s volume spike.
SSRI daily expanding flat bottom breakout.
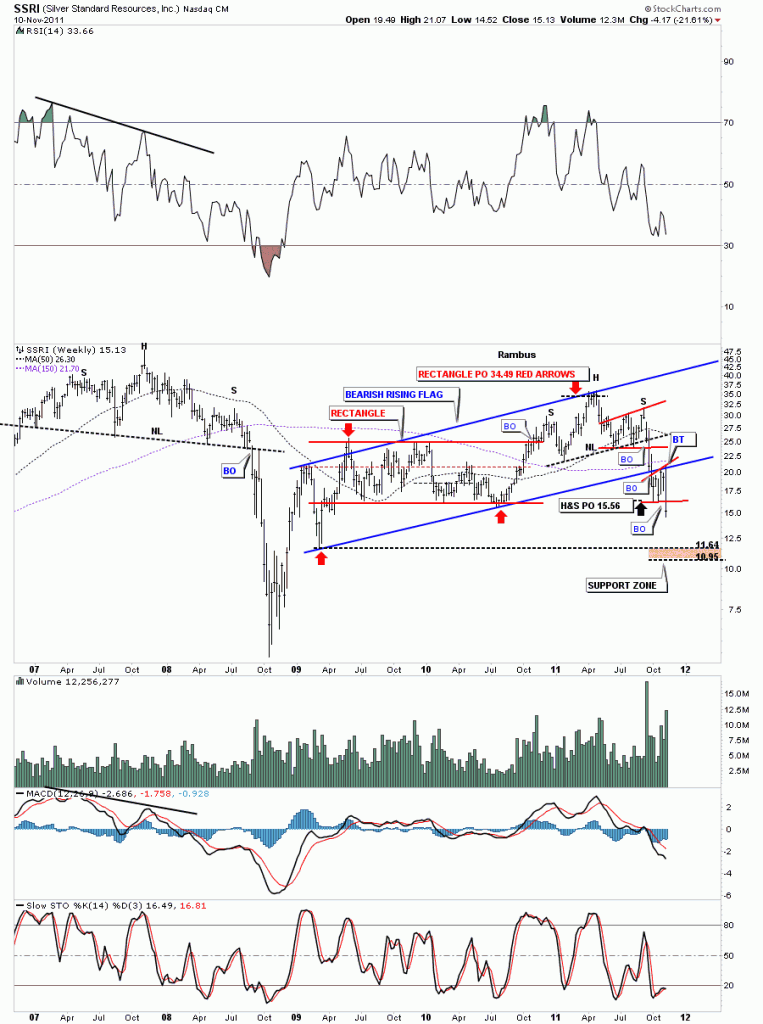
The weekly looks paints an even more bearish picture for SSRI. Notice the big blue rising flag that is made up of a rectangle and a H&S top formation. The expanding flat bottom on the daily look is the right shoulder. That H&S top projected down to 15.56 which was below the bottom blue rail of the rising flag. That was your first clue that SSRI might be in trouble. Next notice the backtest which stopped right at the blue bottom rail and was the top of our latest expanding flat bottom. Again another important clue that SSRI was not acting like it should if it was in a bullish phase. I’ve added a brown support zone where the decline may run into some support.
SSRI weekly bearish rising flag.
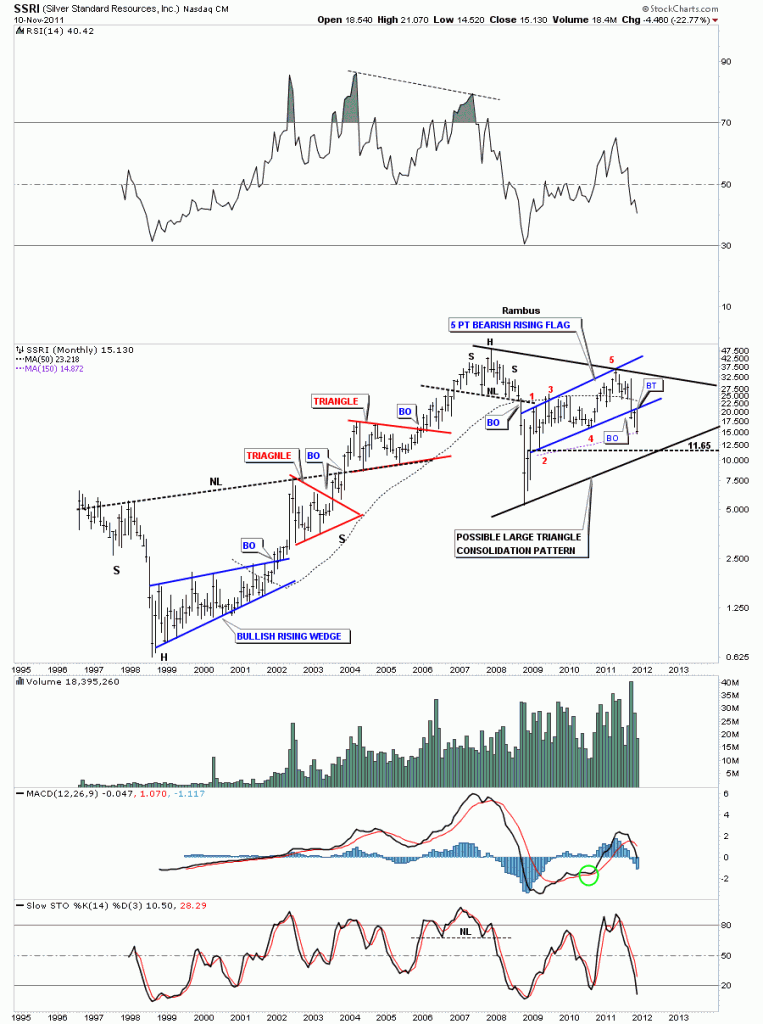
The monthly look shows all of SSRI’s history going all the way back to 1997. Please note the bearish rising flag has 5 reversal points making the rising flag a reversal pattern. As bearish as the monthly chart looks there is an outside possibility that the whole area from the 2008 high and wherever the eventual bottom is could end up being a huge triangle consolidation pattern, black rails.
SSRI monthly look.
Bottom line with the precious metals stocks is that they are all over the place right now. Some are close to all time highs some are in the middle of their big trading range and some like SSRI, AEM and TRX are breaking down. It pays to keep a close eye on any precious metals stock you are holding. What you don’t want to see is it breaking a support zone like the chart of SSRI did today. Even if you had a sell/stop in place, on the daily chart, chances are today’s gap may have gaped over your sell/stop leaving you still in the game when you might not want to be. The only rule in the stock markets is “THERE ARE NO RULES”.All the best flashinthepan. Rambus


