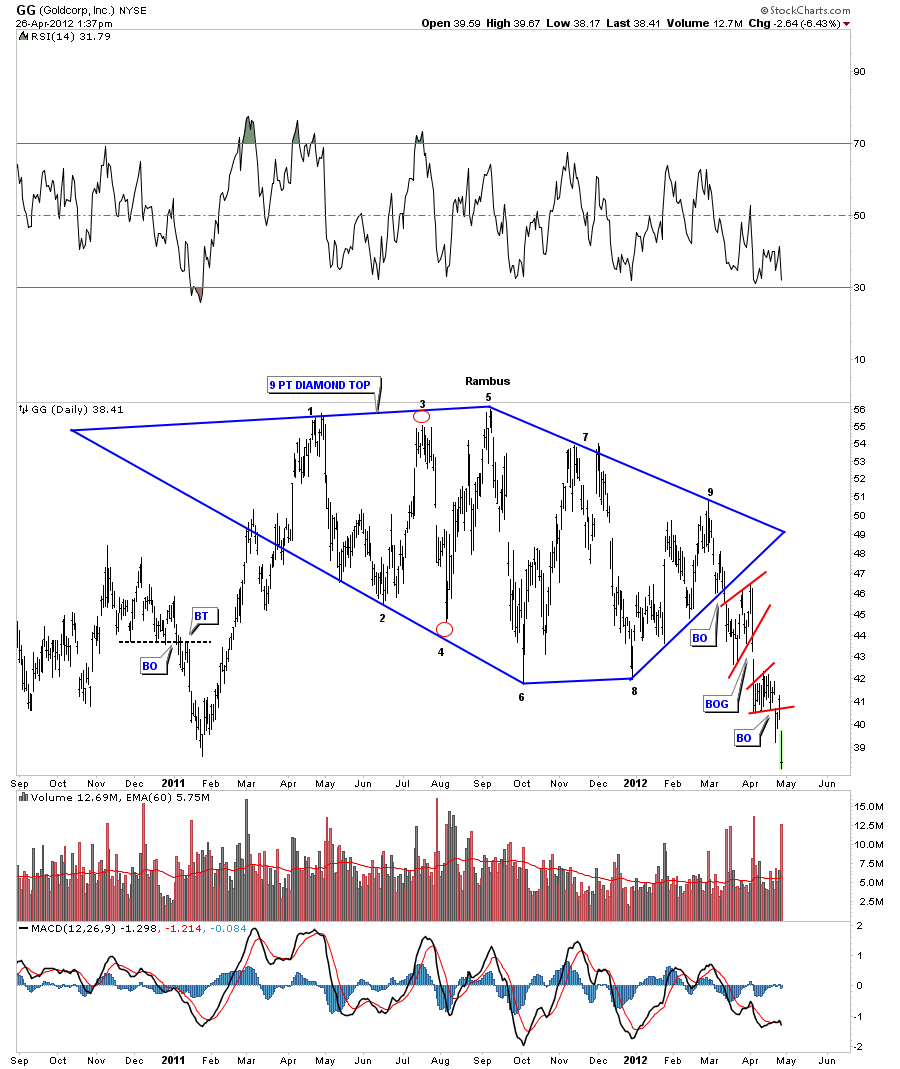
Goldcorp is a big part of the HUI so it stands to reason that the chart patterns may look similar. Like the HUI, GG also has a diamond top pattern that is leading the HUI down at the moment.
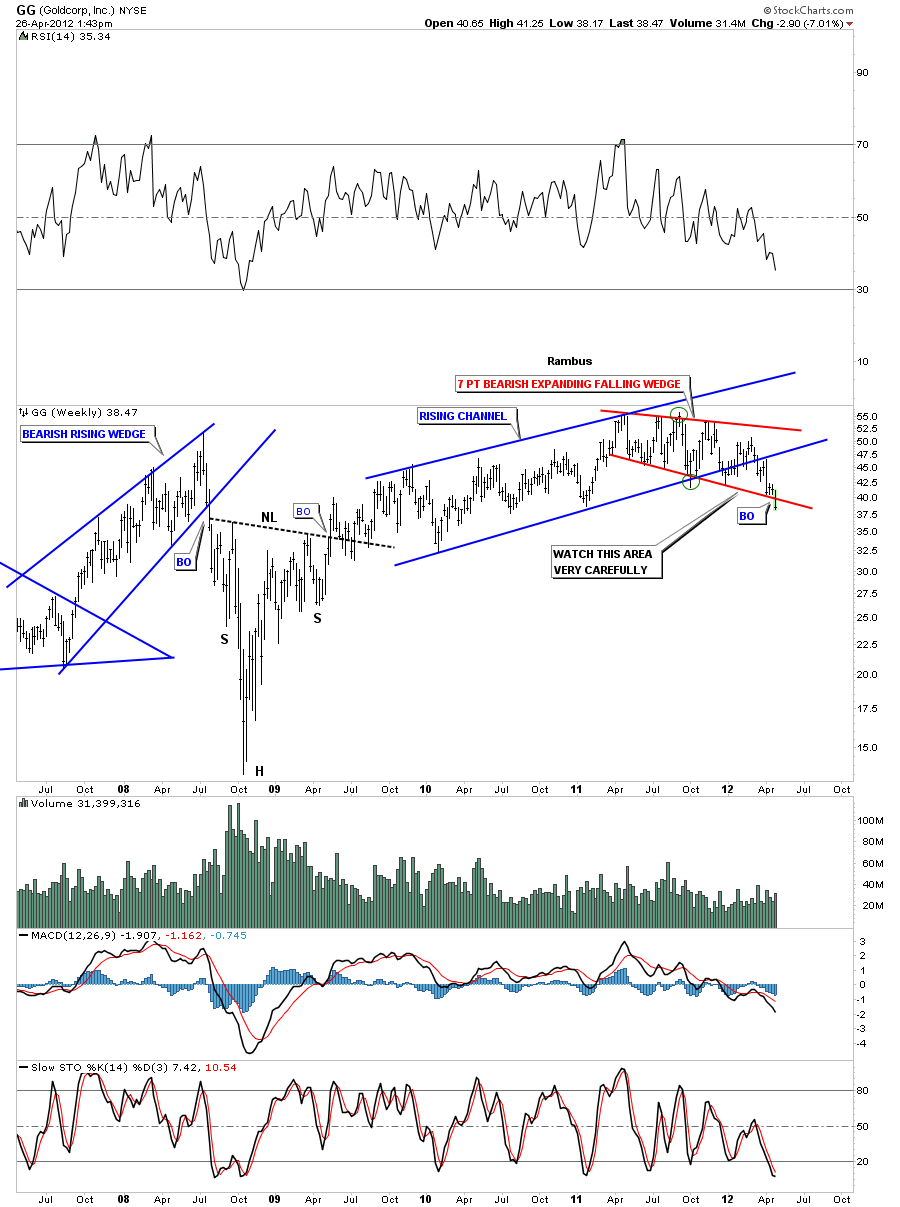
There is another bearish pattern on the weekly look that is a red 7 point bearish expanding falling wedge reversal pattern that is breaking down today. There is also a blue rising channel that held the price in check for almost 18 months or so that broke the bottom blue rail about 2 months ago. If we were in an uptrend these important rails should not have been violated. The fact that they are is not a healthy sign for the long term view of the big cap precious metals stocks.
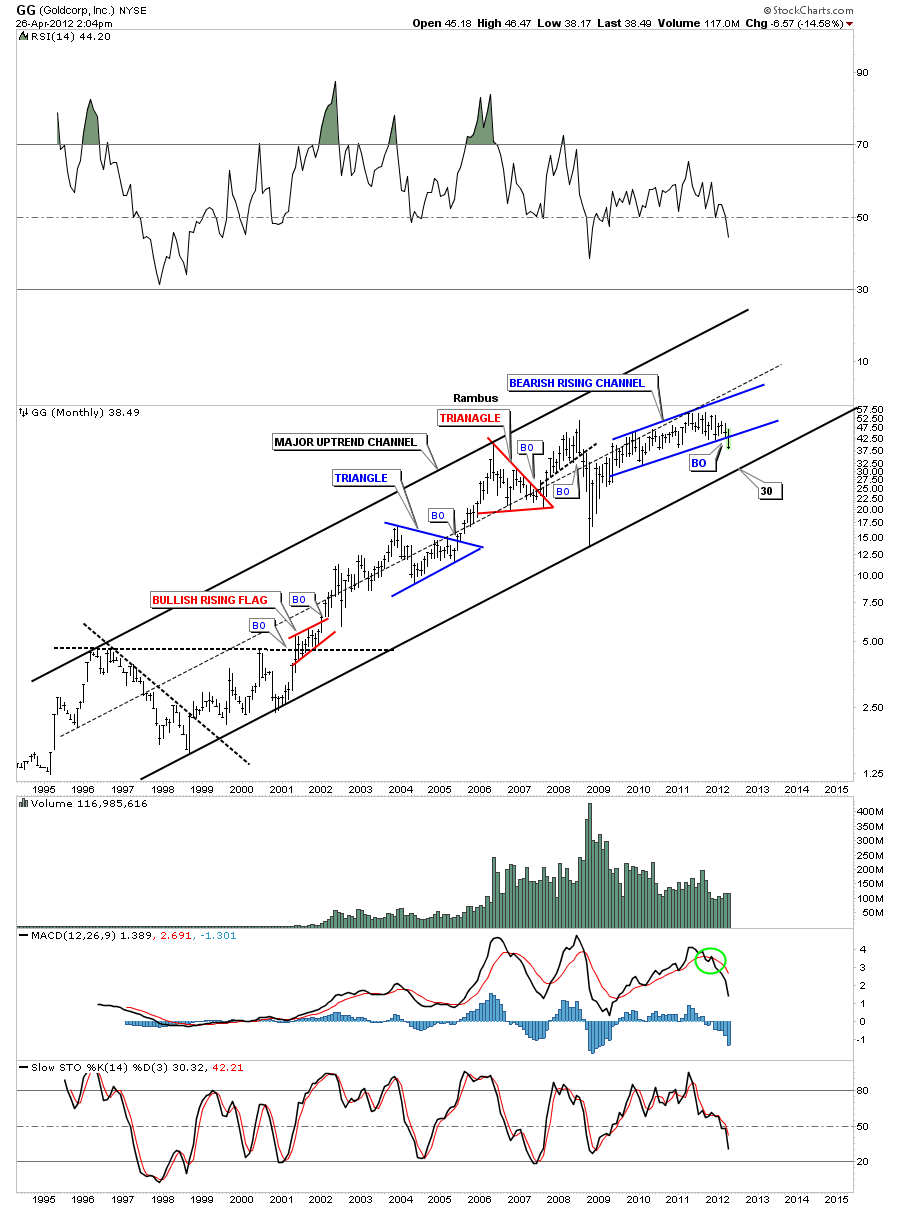
The monthly chart shows the big uptrend channel that has been in place since the late 1990’s. The bottom rail of the major uptrend channel comes in around the 30 area. As you can see the very big picture doesn’t look quite as ominous as the shorter time frames. Eight more points lower on this stock will have a negative impact on the HUI if indeed it does trade down to the bottom rail. Its been a rough month for GG as its down over 14%. The bottom rail would be a good low risk entry point if one has the cash on hand to take the trade.


