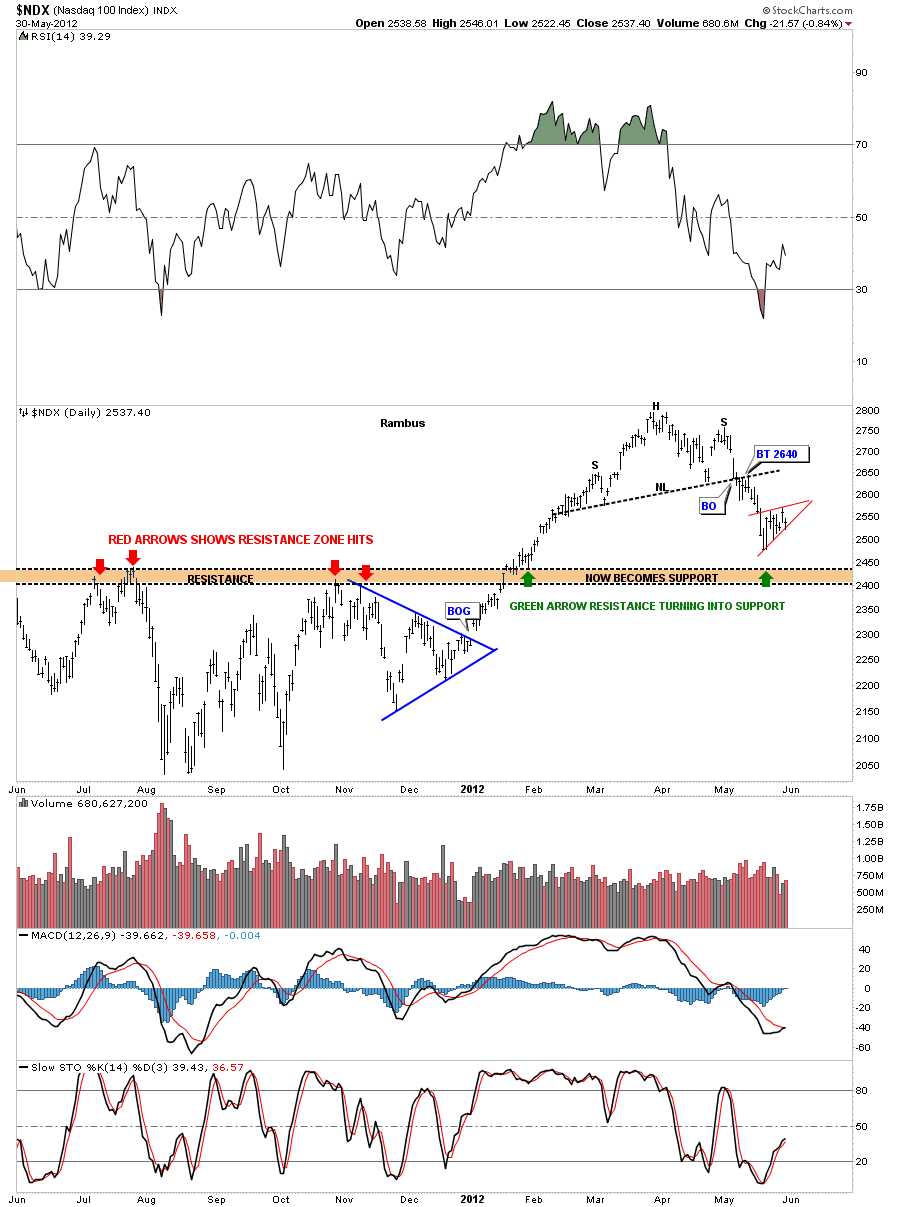
Tonight I want to bring everyone up to date on the many H&S top patterns that have been forming for sometime now. All these H&S top patterns are telling a very big story as to the direction of the world marketl. These H&S top patterns are showing up in every corner of the investing complex. There are several more that have broken their necklines this week. I will let the patterns speak for themselves.
First, lets look at some of the world stock markets and see what kind of shape they’re in as this is a world wide phenomenon taking place.
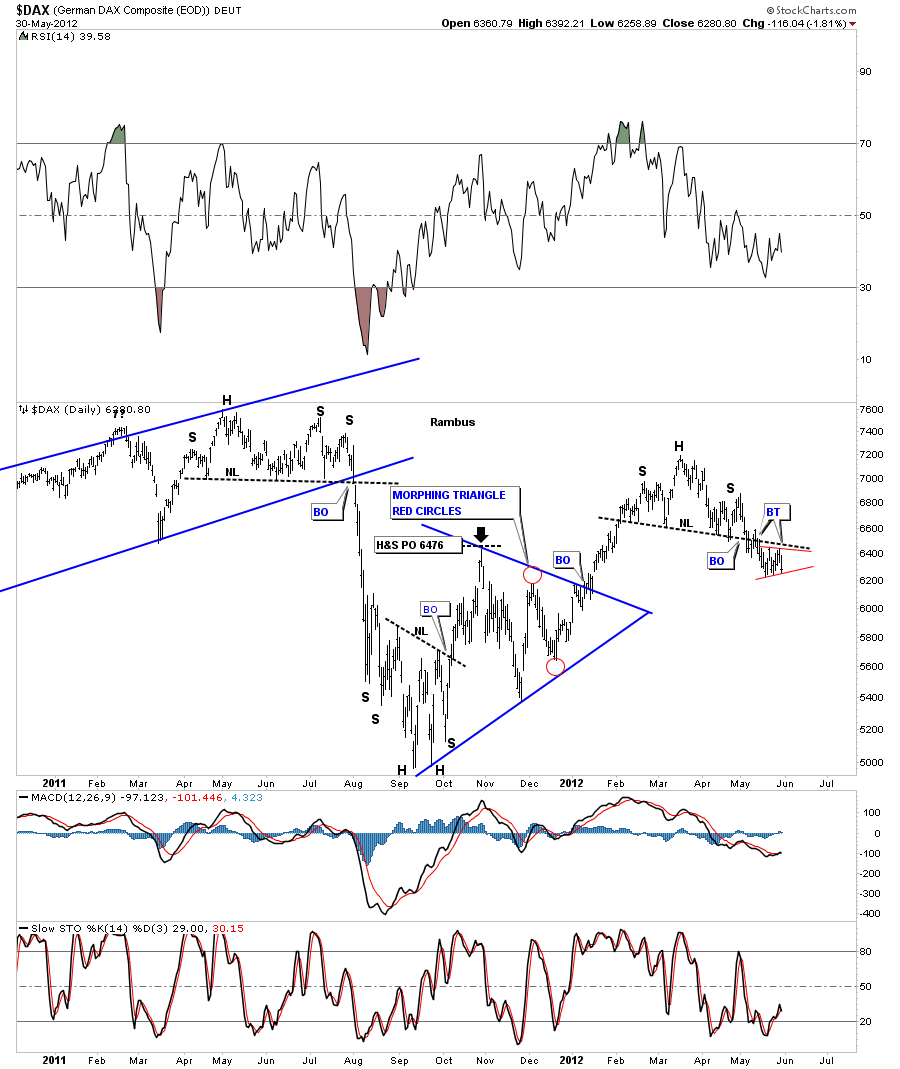
One of the stronger European stock markets the DAX. Note the little red triangle forming just below the neckline.
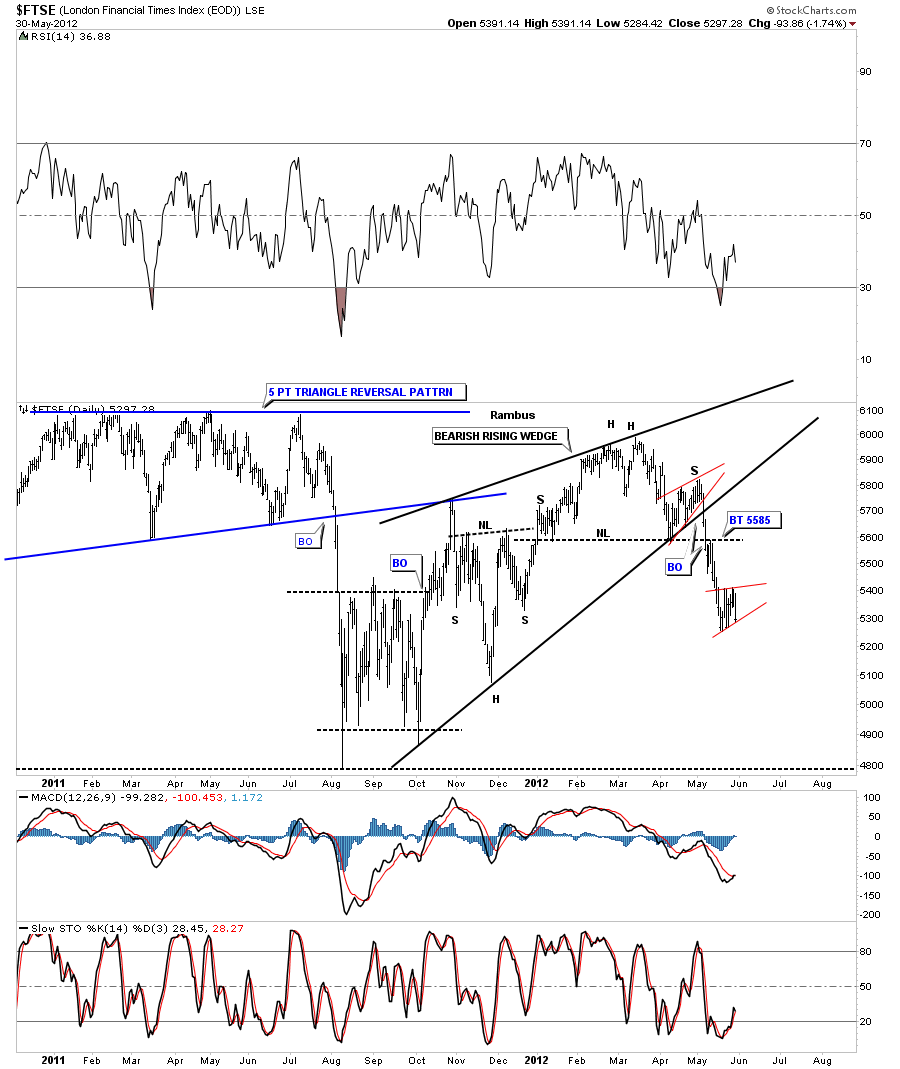
The FTSE is alittle further along than the DAX in it’s move lower. Note the little red bearish rising wedge.
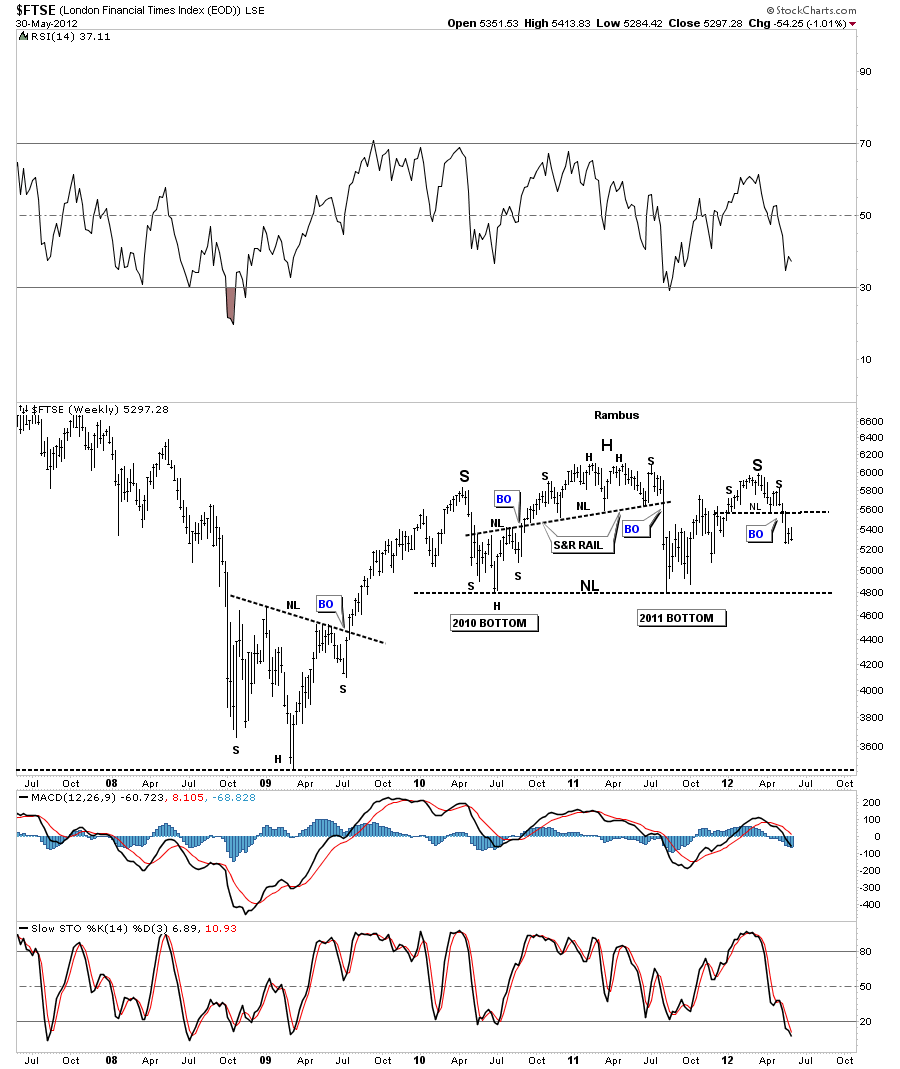
The weekly FTSE look shows a much larger H&S pattern that is almost 2 1/2 years in the making.
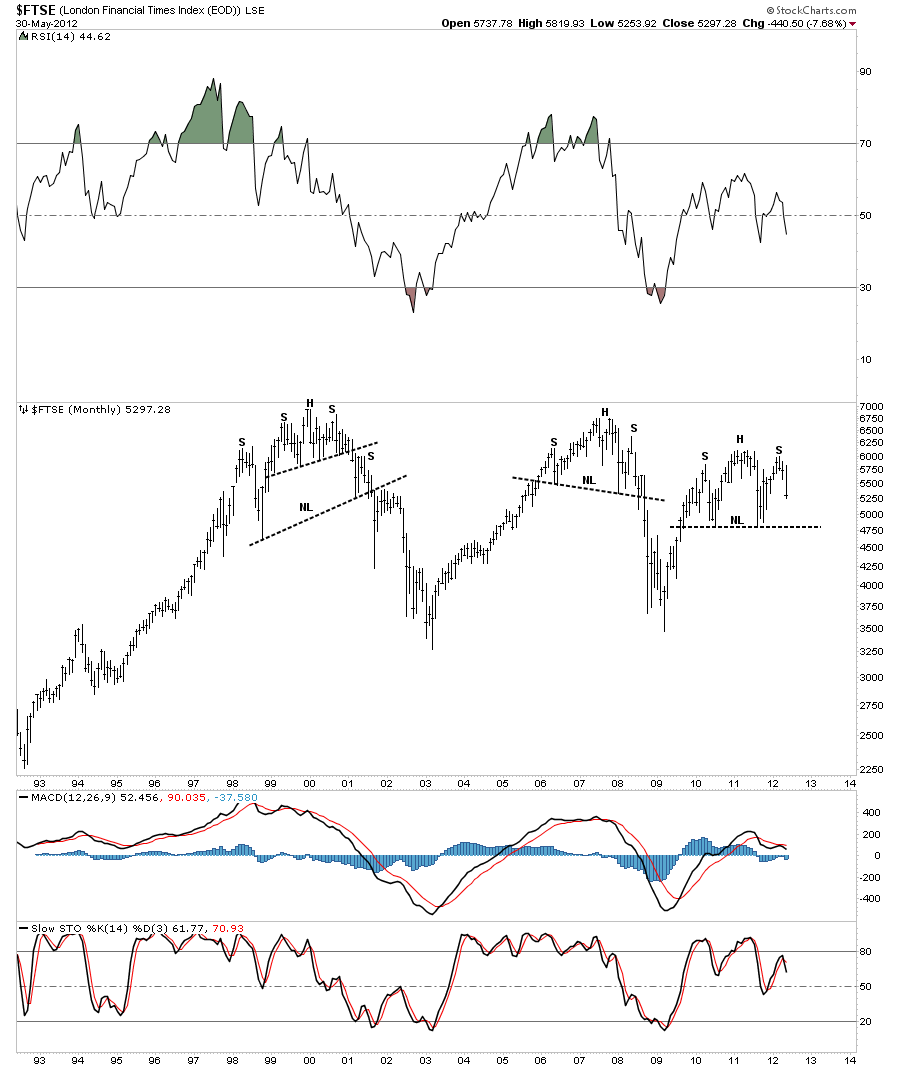
The monthly chart shows the similarities between the two other big topping patterns from 2000 and 2007 and our current one.
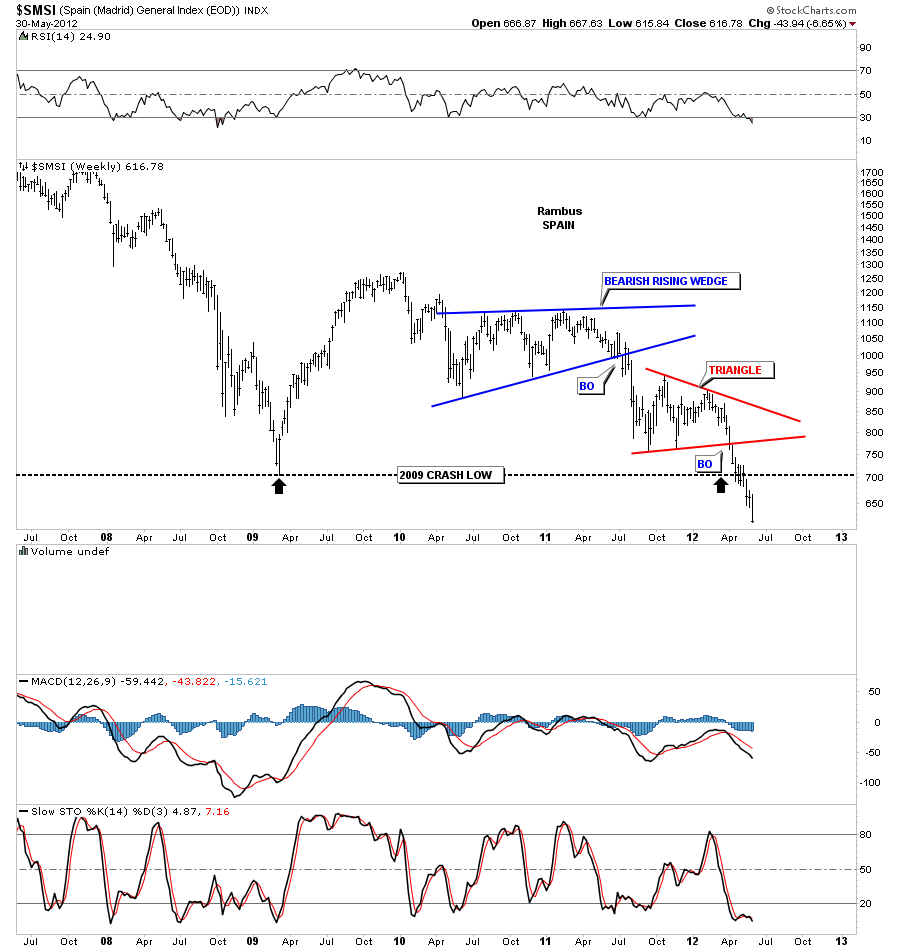
The SMSI is the Spain stock market that doesn’t have a H&S top but it does have a triangle consolidation pattern and is breaking down below the all important 2008 crash lows.
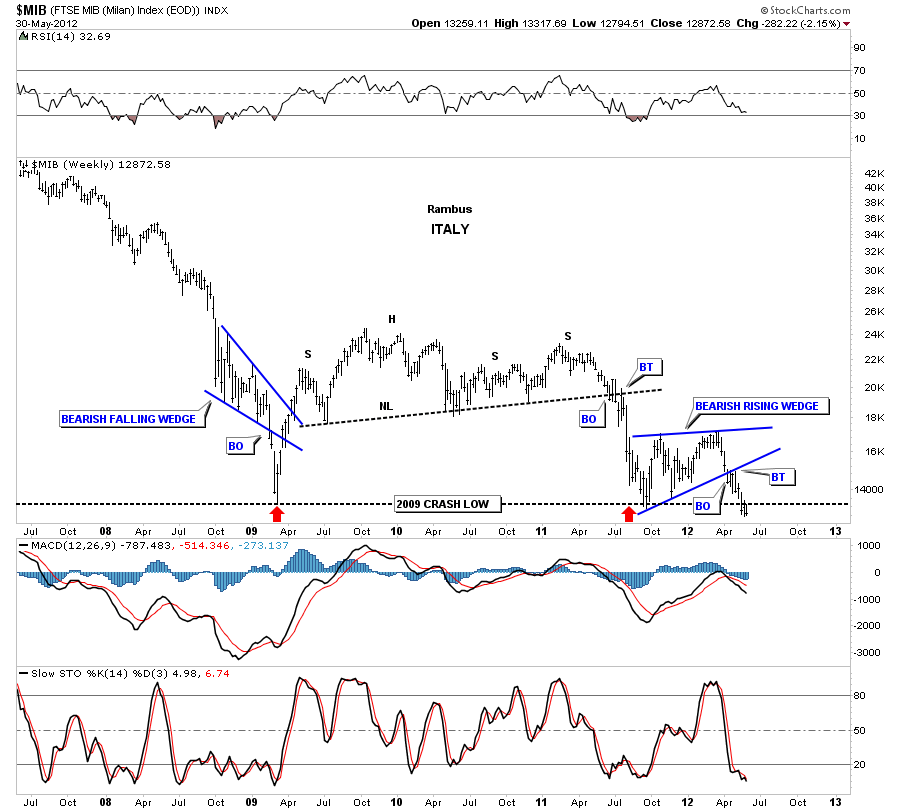
The MIB Italian stock market is also breaking below the 2008 crash lows.
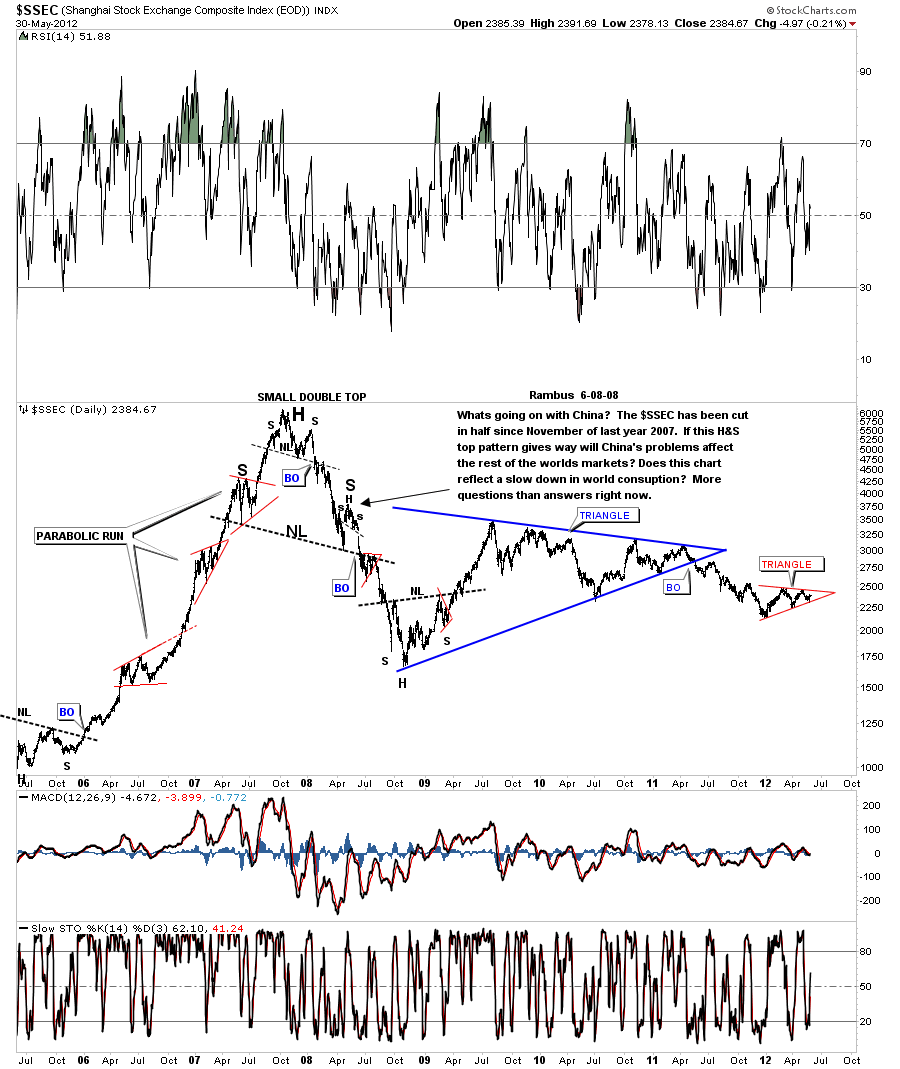
The SSEC has formed a red triangle pattern that has yet been decided on which way it will breakout. Note the parabolic run the SSEC had back in 2007. This is a good example of what happens after a parabolic run is over. Its been trending down for over four years now with no real bottom in sight yet.
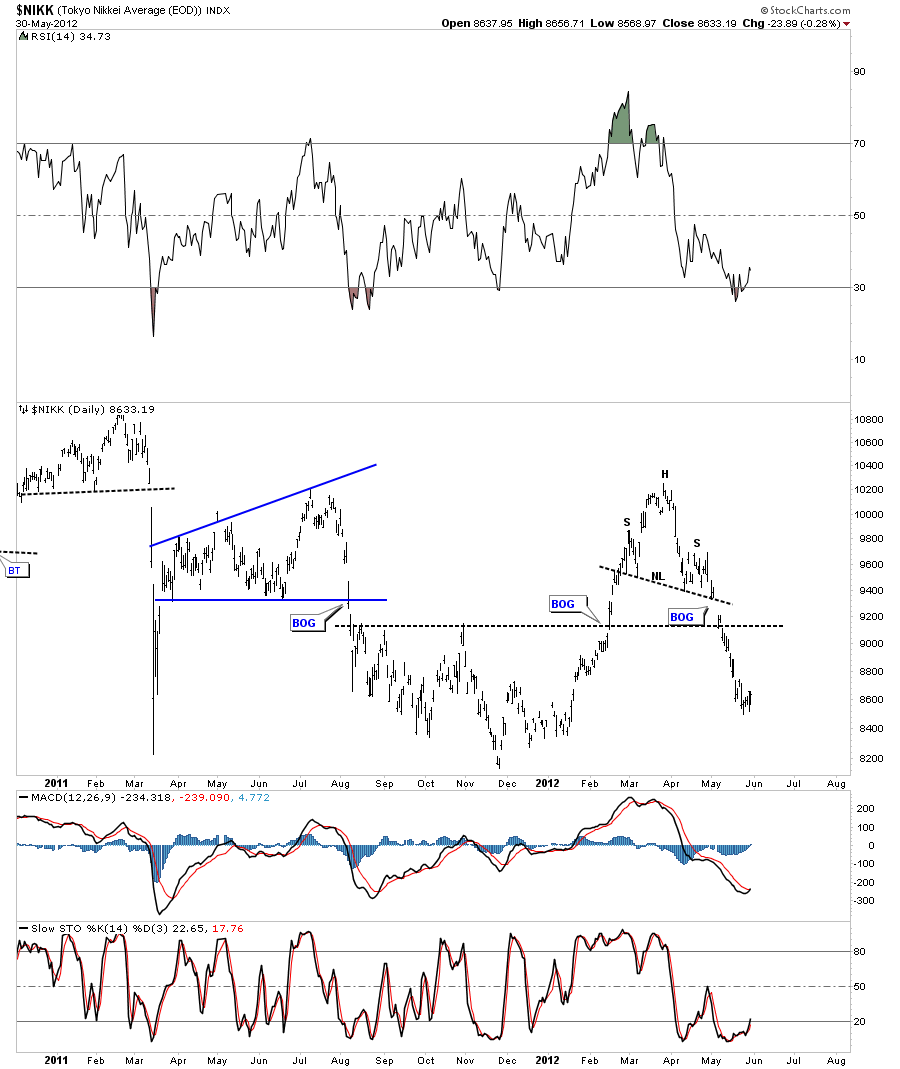
The NIKK daily H&S top.
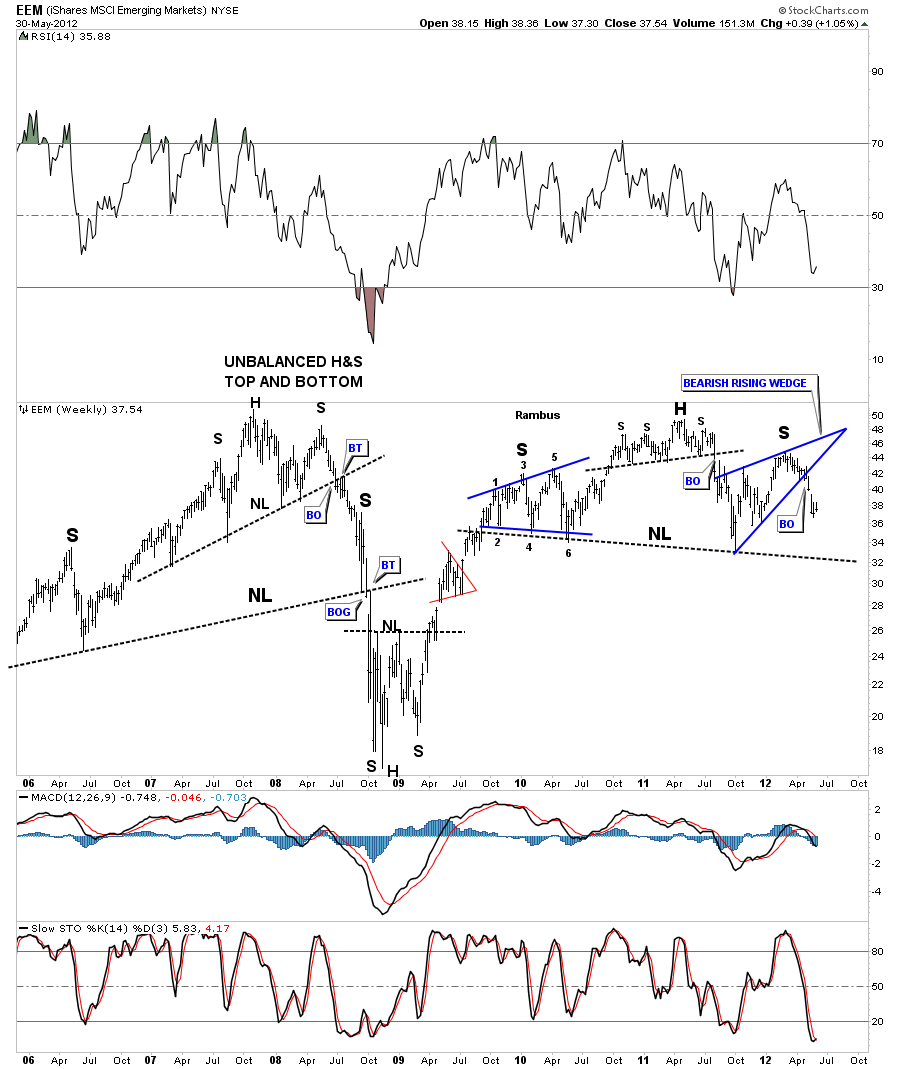
The EEM emerging markets are showing a large H&S top. No area seems to be immune to what seems to be coming our way.
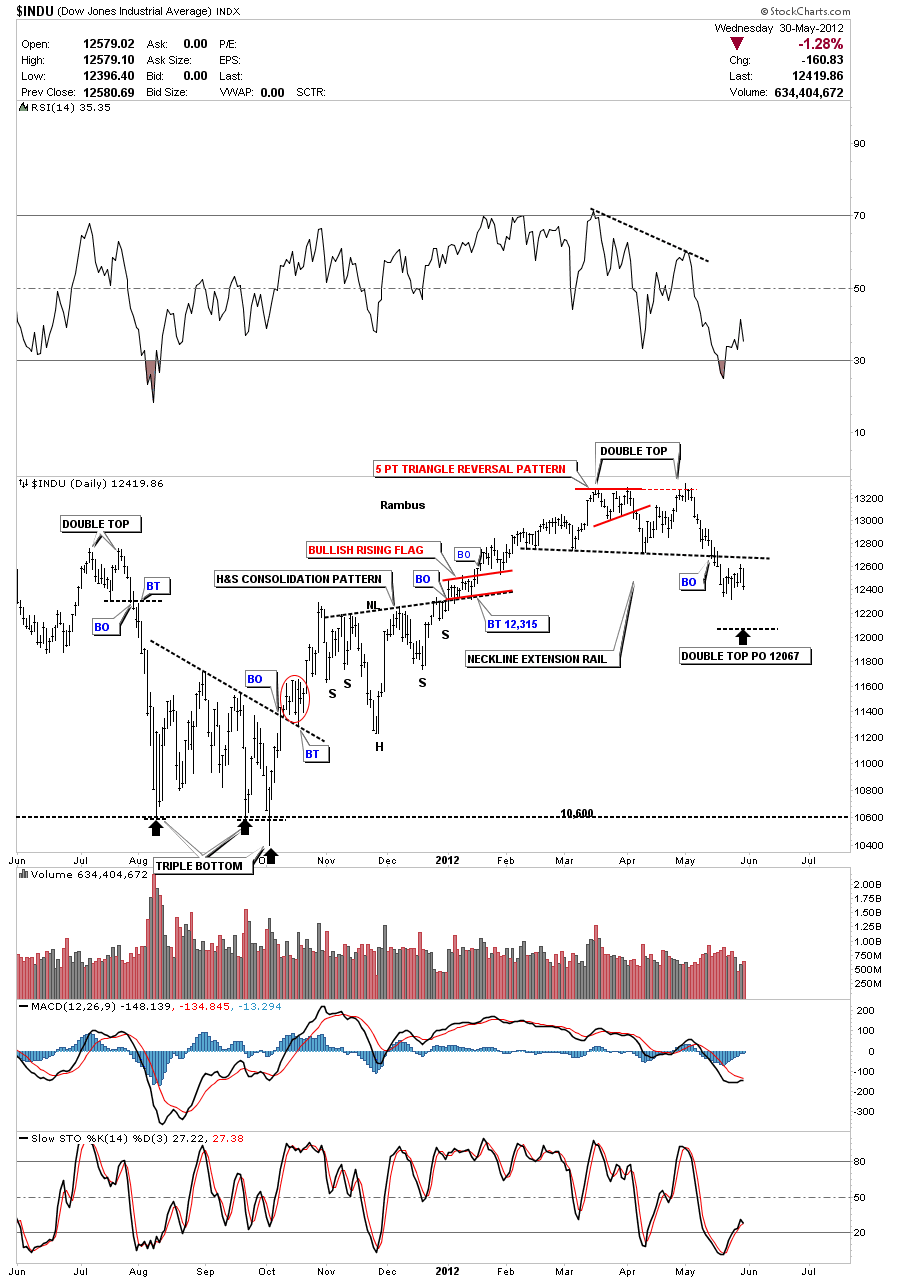
Lets now take a look at some of the US stock markets. Most are showing H&S topping patterns as well. The Dow is the only US stock index that is showing a double top which is still a reversal pattern.
The S&P shows a H&S top pattern with two left and two right shoulders. Note the little red bear flag that has formed over the last couple of weeks.
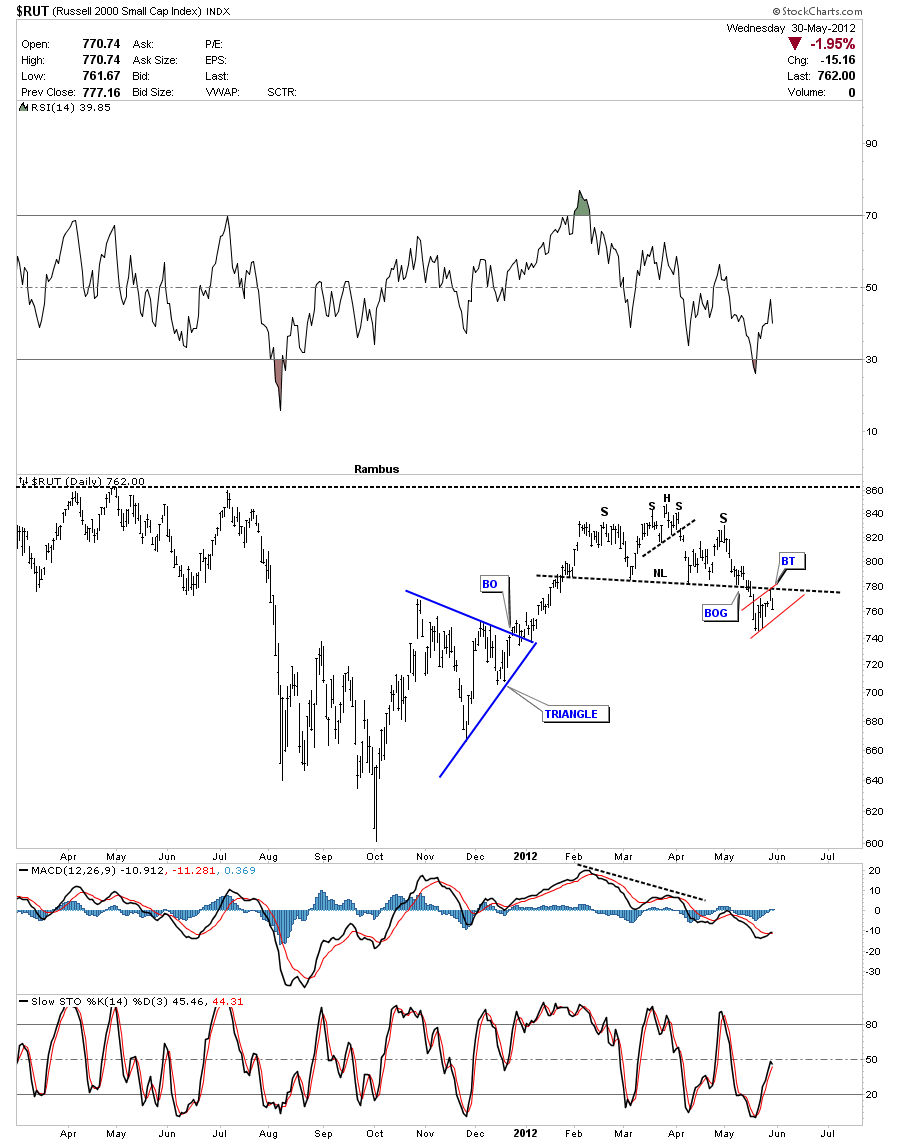
The RUT small cap index has a nice H&S top pattern with a bear flag forming just below the neckline which is a bearish setup.
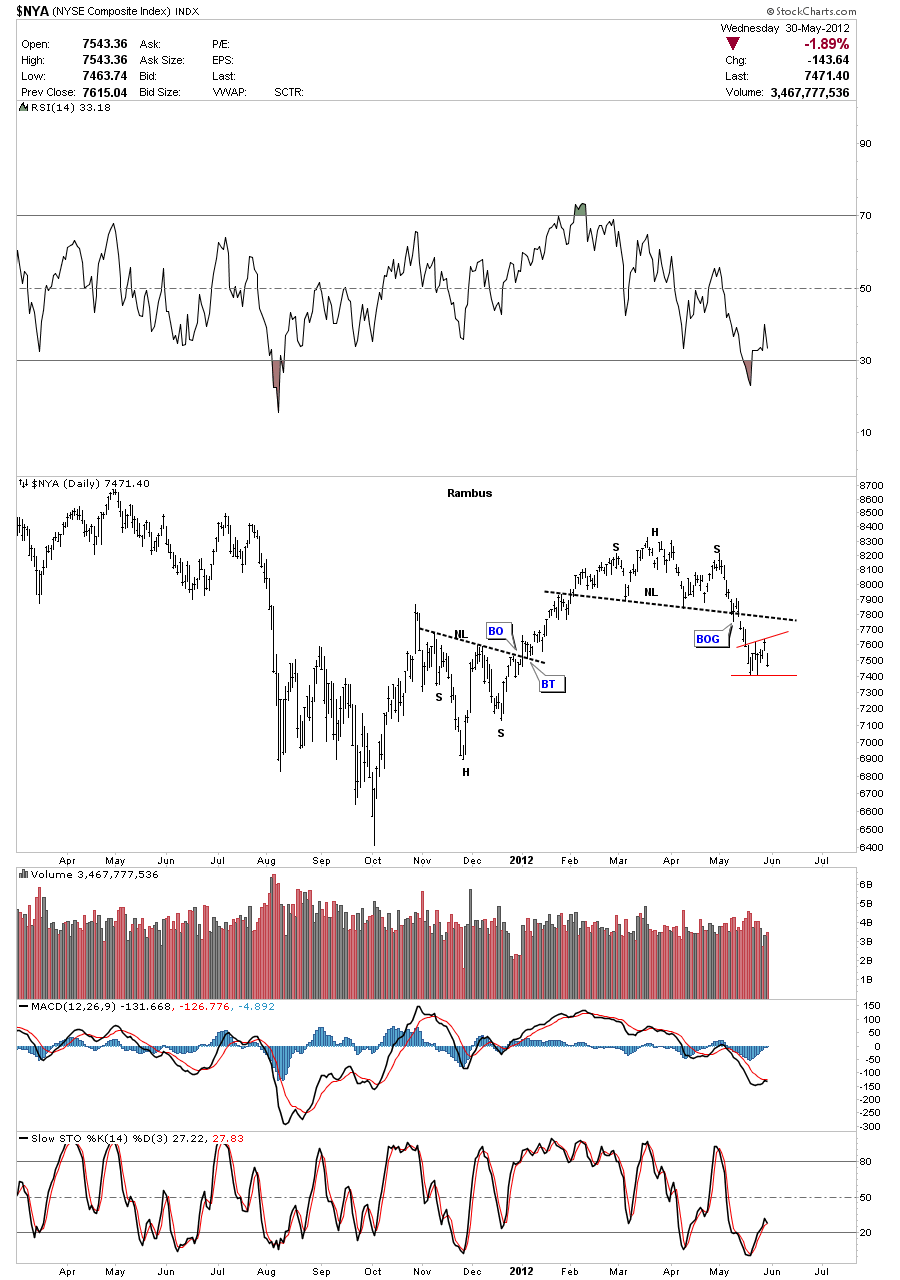
The NYA is a broad measure of US stocks.
Lets look at one more US stock index that has the 100 biggest tech stocks, the NDX 100. Note the little red bearish rising wedge that will most likely be a halfway pattern to the downside.
I was going to show some other areas of the markets tonight with H&S top patterns but its getting late. I will bring you up to date on the weekend report. All the best ..Rambus
EDITOR’S NOTE :
Rambus Chartology is Primarily a Goldbug TA Site where you can watch Rambus follow the markets on a daily basis and learn a great deal of Hands on Chartology from Rambus Tutorials and Question and Answeres .
Most Members are Staunch Goldbugs who have seen Rambus in action from the 2007 to 2008 period at www.goldtent.org and now Here at Rambus Chartology since early 2012 .
To review his Work and incredible calls from the 2007-2008 period click on the top right sidebar in the “Wizard of Rambus” ….”What If !!” Post
To Follow Rambus Unique Unbiased Chart Work and participate in a Chartology Form with questions and answeres and learn the Art and Science and Mindset of a Pro Trader please Join us by subscribing monthly for $29.99 at
www.rambus1.com
We have many subscribers from all over the world who are glad they did as they enjoy the many daily updates and commentaries provided at this exciting new site
As you will see Rambus (Dave) has prepared us for this difficult period by being one of the only ones to see and warn about this incredibly debilitating PM smackdown as early as Jan 2 2012 …click on the” HUI Diamond in the Rough” Post in the “Wizard of Rambus” top right
You will find Rambus to be a calm humble down home country tutor with an incredible repitoir of all the TA based protocols tempered with his own one of a kind style…simply put…He wants to keep his subscribers on the right side of these crazy volitile and downright dangerous markets
See you at the Rambus Chartology
……………………. ..

