In this weekend report I want to take a look at some of the big cap precious metals stocks that help make up the HUI, XAU and the GDX. What we’re basically doing is looking under the hood of the big cap PM indexes to see what the individual components look like. By doing this we can see where these individual stocks are since topping out over the last one to two years. Big tops need time and price to reset sentiment. There are two ways to get back to oversold condition. First you can have a long drawn affair that takes alot of time to bring the price back down to oversold readings. The second way would be similar to the 2008 crash in the PM stocks that only took 3 or 4 months to get everything washed out so a new leg could begin.
The charts I’m going to show you tonight will be a weekly line chart that takes the weekly close and adds the next weeks close to it to get your line. Line charts can sometimes show nice clear chart patterns that are hard to detect on a bar chart that may have some big price spikes. A pattern may show up on a line chart that you didn’t see on a bar chart and vise versa. Using both bar charts and line charts can give one a much clearer interpretation of what is really going on when a stock starts chopping out a chart pattern.
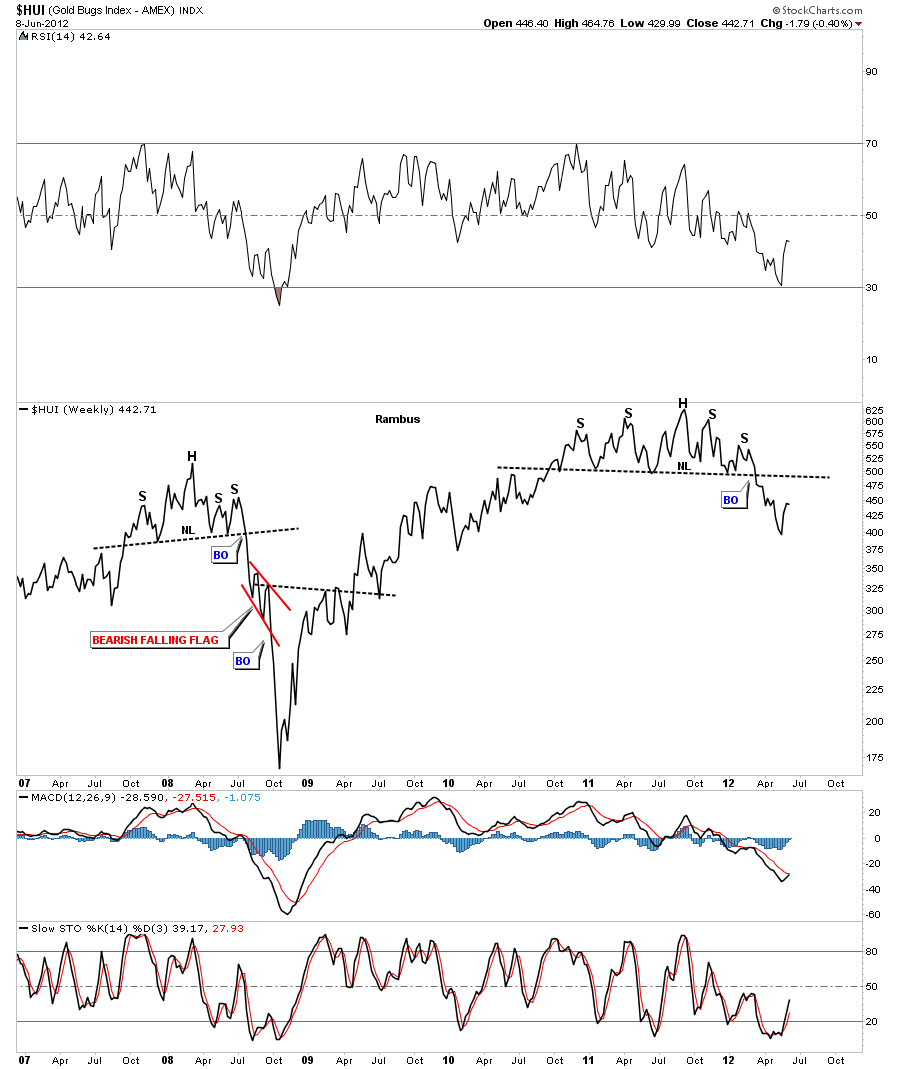
Lets look at the HUI first, on a weekly line chart, so you can see the clear 18 month or so H&S top formation. From just a common sense symmetrical look it doesn’t look like the HUI has put in near enough time in relationship to the big H&S top formation. I think we could be in a more drawn out type decline that will take time to play out by moving 2 steps down and one step up like we are seeing right now. Notice the 2008 H&S top that didn’t waste any time going down once the neckline was broken to the downside.
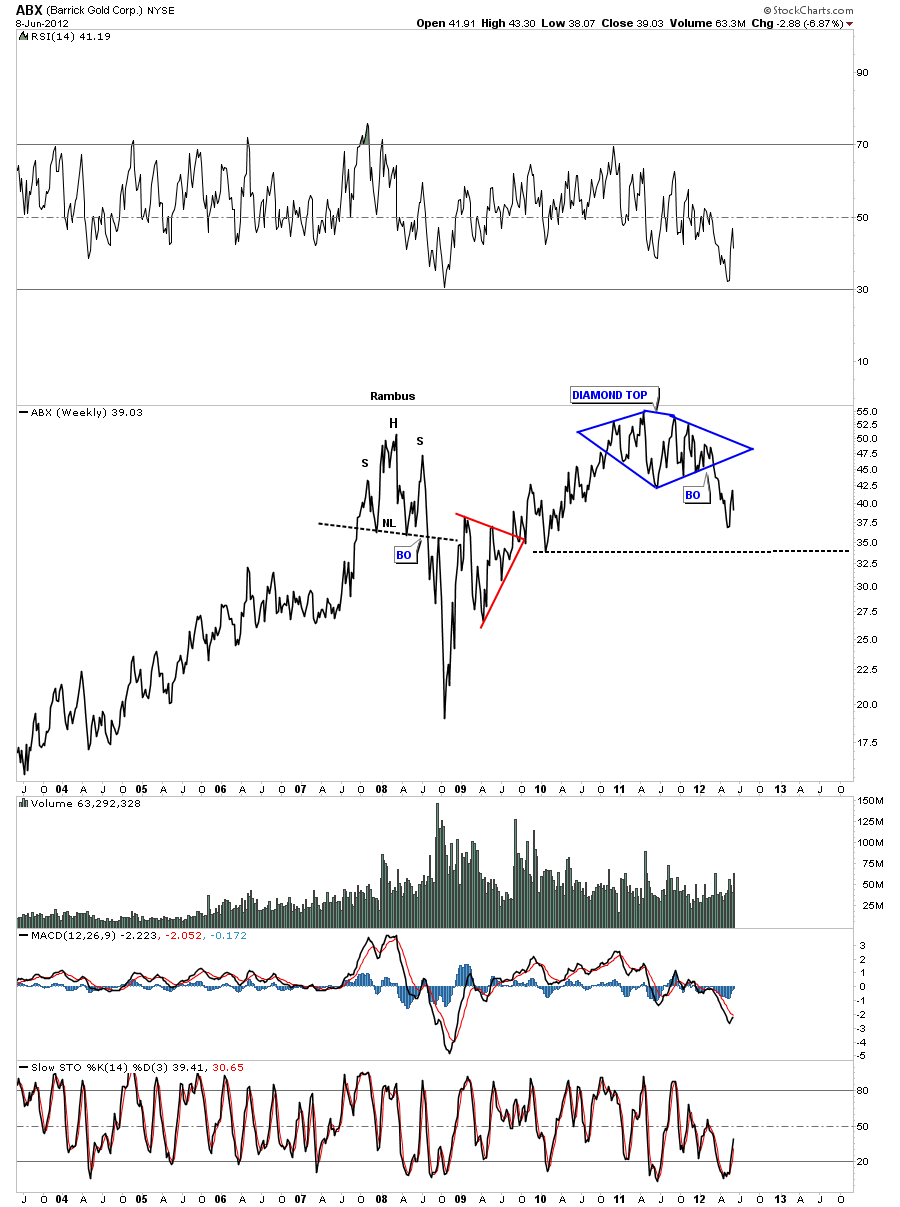
Lets now look at some big cap precious metals stocks on a weekly line chart and see what they look like. ABX has a big diamond top in place. Note the bottom blue up sloping rail of the diamond and how the price action dropped in a vertical fashion once it was broken to the downside. That’s what a breakout looks like.
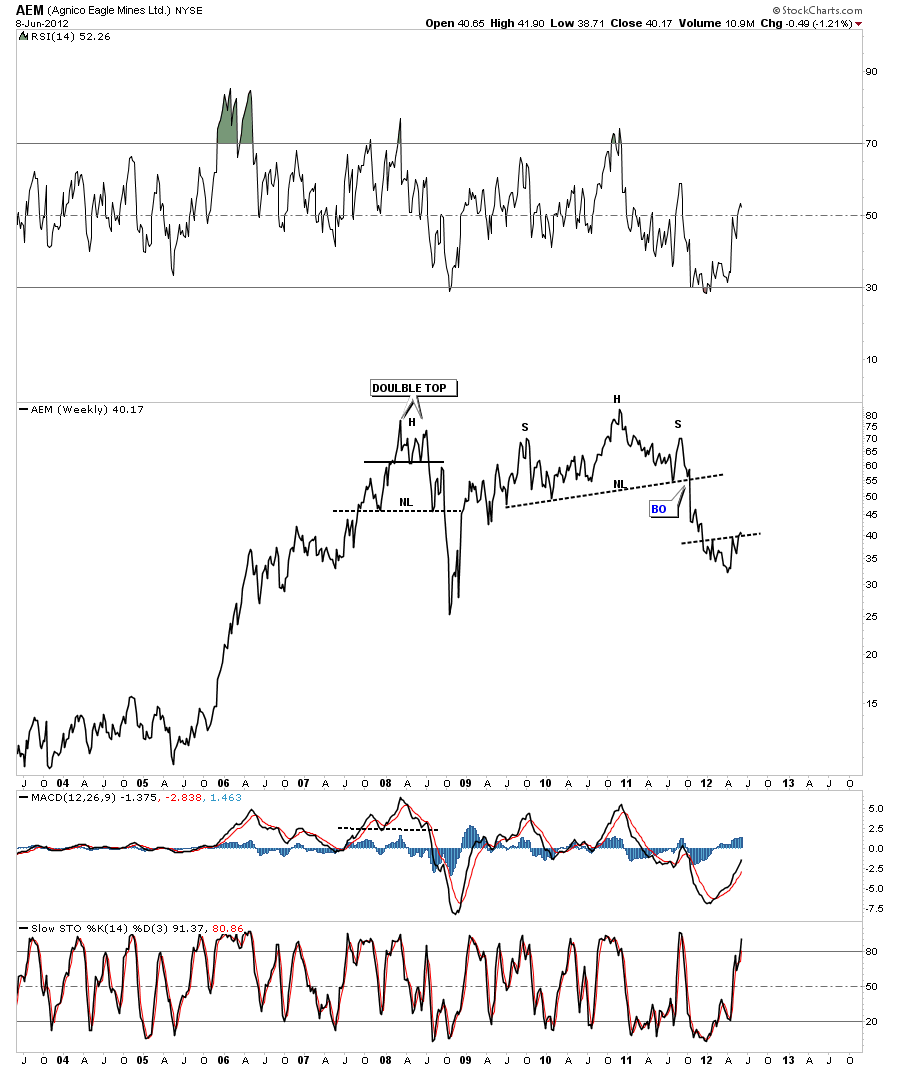
AEM was one of the first PM stocks to break down from it’s H&S top formation.
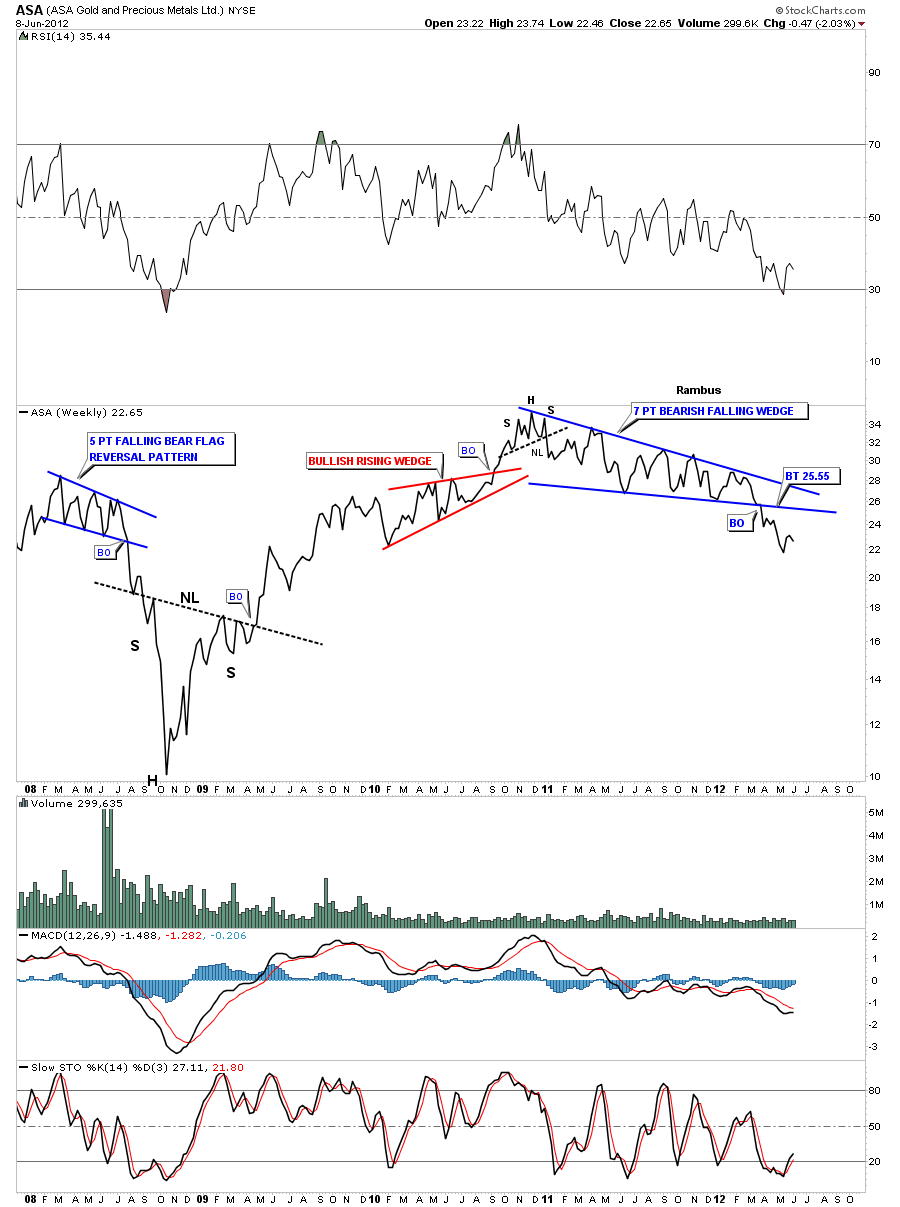
ASA topped out at the end of 2010 & 2011 with just a small H&S top pattern. The real pattern that is talking to us is the 7 point bearish falling wedge that broke through the bottom rail in the middle of March of this year.
AU has a diamond top in place. Note the bottom blue rail and how it supported the price action until it finally was broken to the downside. There were no more bulls left to buy the bottom rail so you get a breakout that is vertical in nature. On the weekly bar chart you can see a beautiful H&S top formation.
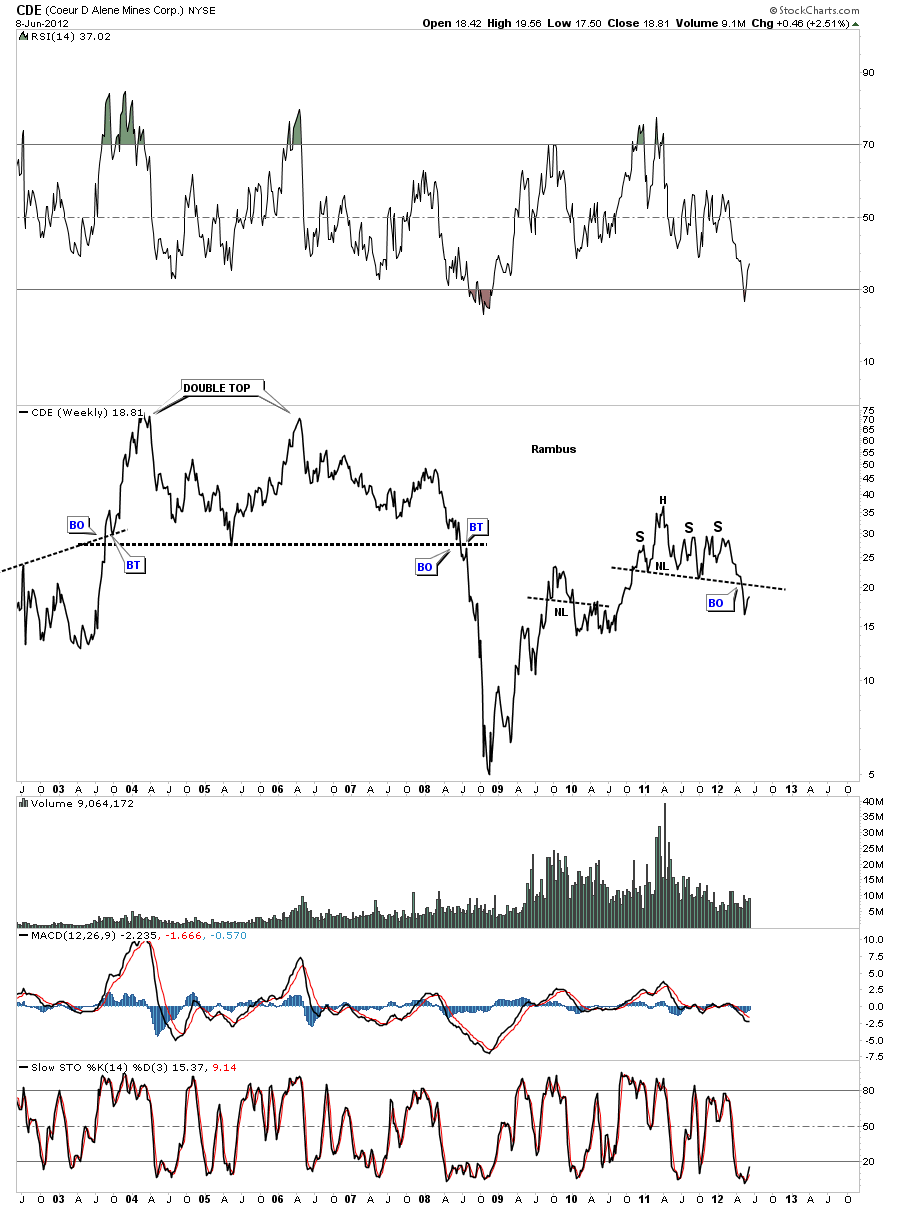
CDE has an unbalanced H&S top in place.
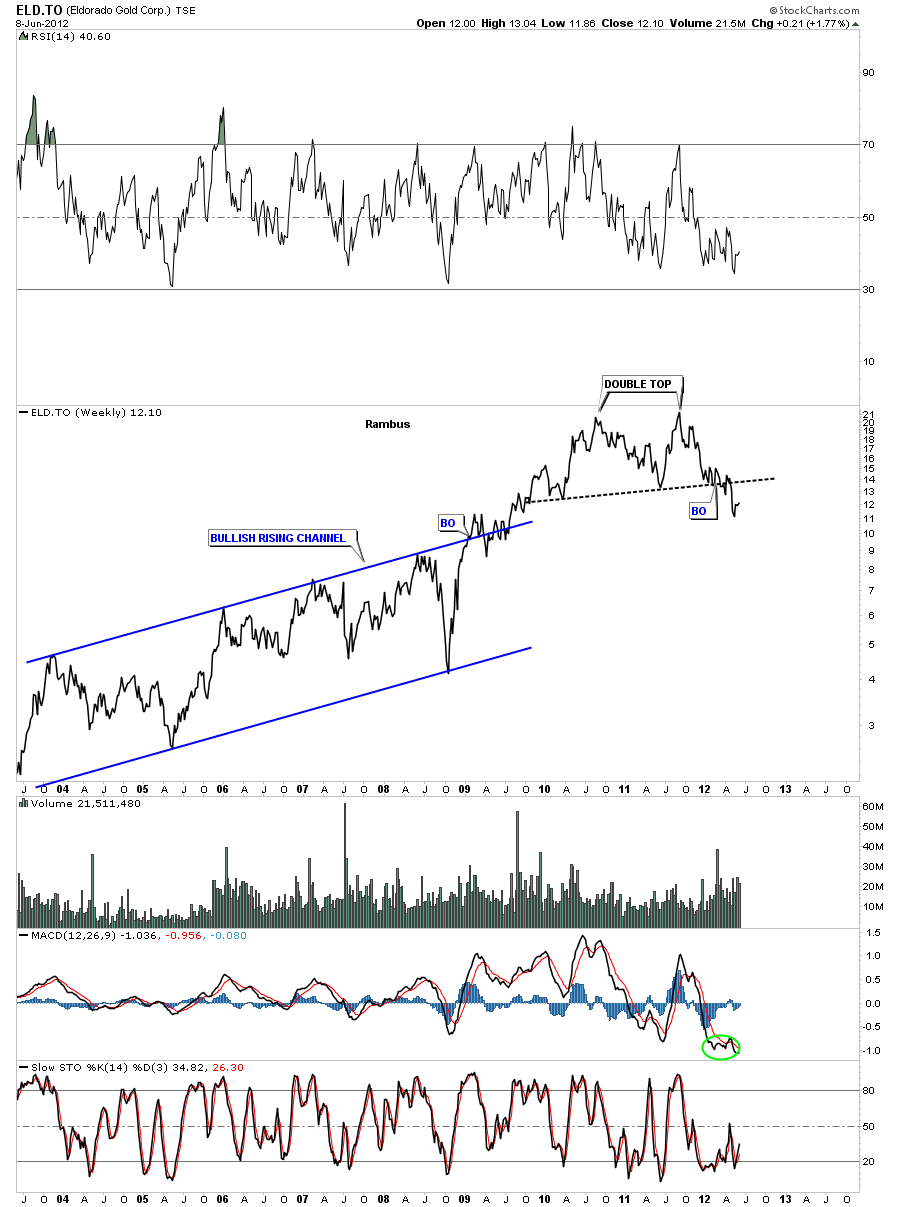
ELD.TO has a double top in place. You could make a case for a H&S top also but the bottom line is, the dashed black rail that is your support and resistance rail. That goes for all the charts I’m showing. Regardless of what pattens are above the black dashed rails its the dashed black rails or the support and resistance rails that count. Just think of them as support rails turning into resistance rails once they are broken.
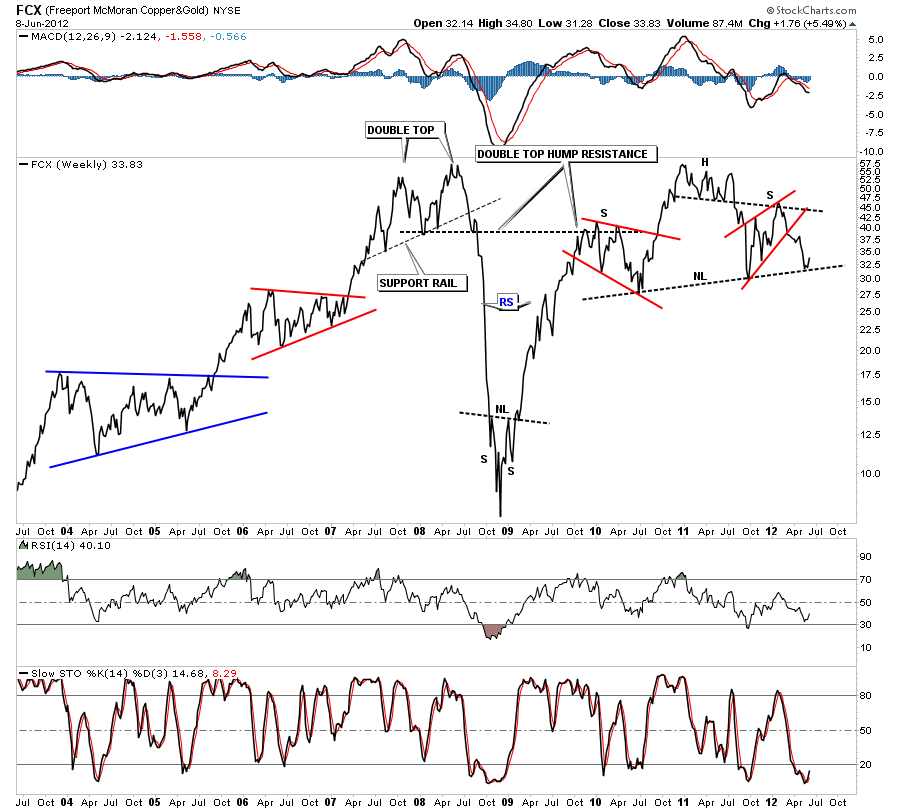
FCX has a beautiful H&S top pattern in place but is still trading above the all important neckline. Note the end of the chart and the little bounce we are getting off the neckline. That little bounce is telling us that neckline is hot and when it gets broken to the downside it will then reveres it’s role and act as resistance on any backtest.
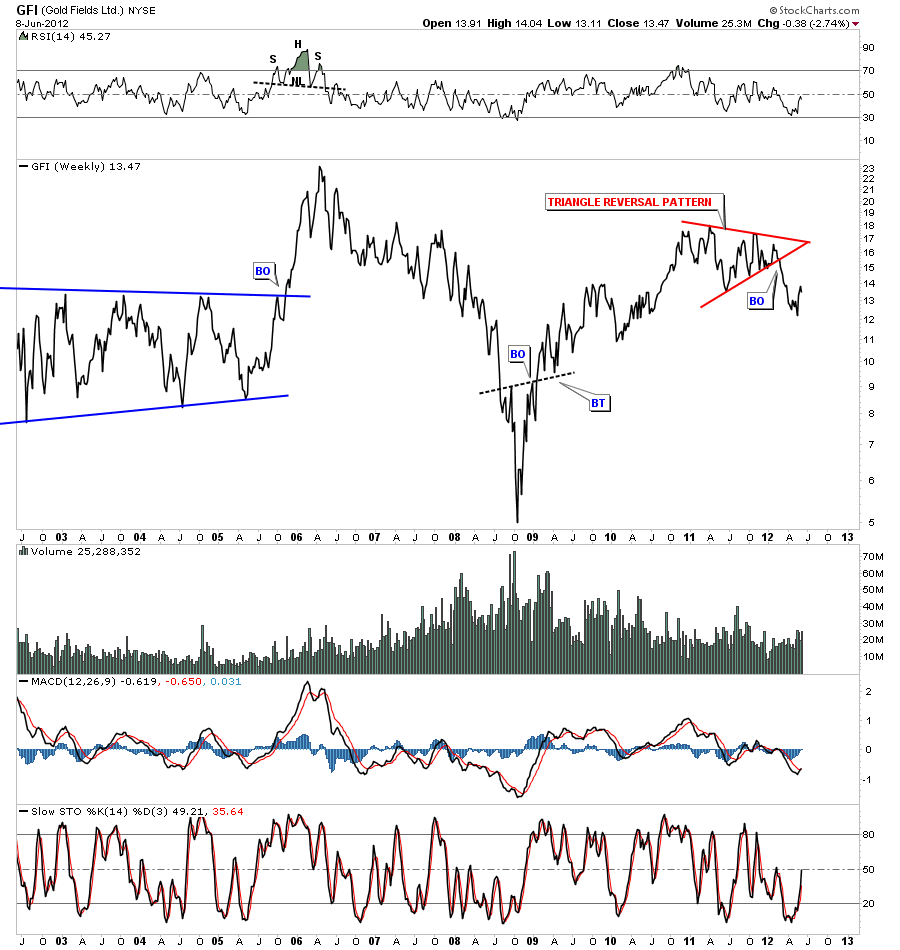
GFI has a triangle reversal pattern as it’s top. Again notice the bottom red rail of the triangle and how it held support and then once broken prices fell in a near vertical move until it can find some support.
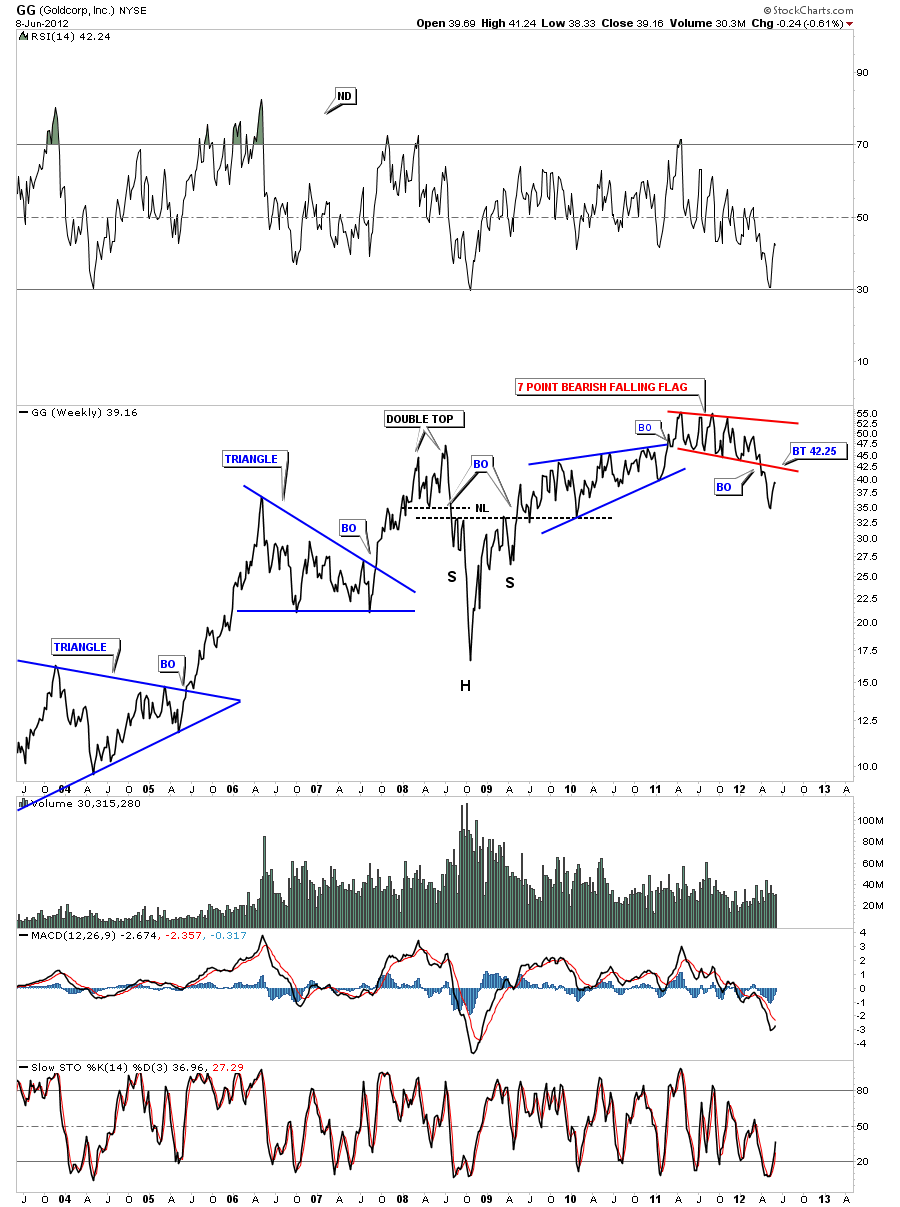
GG has a 7 point bearish falling flag in place. It got to within a point or so of doing a complete backtest this past week at 42.25.
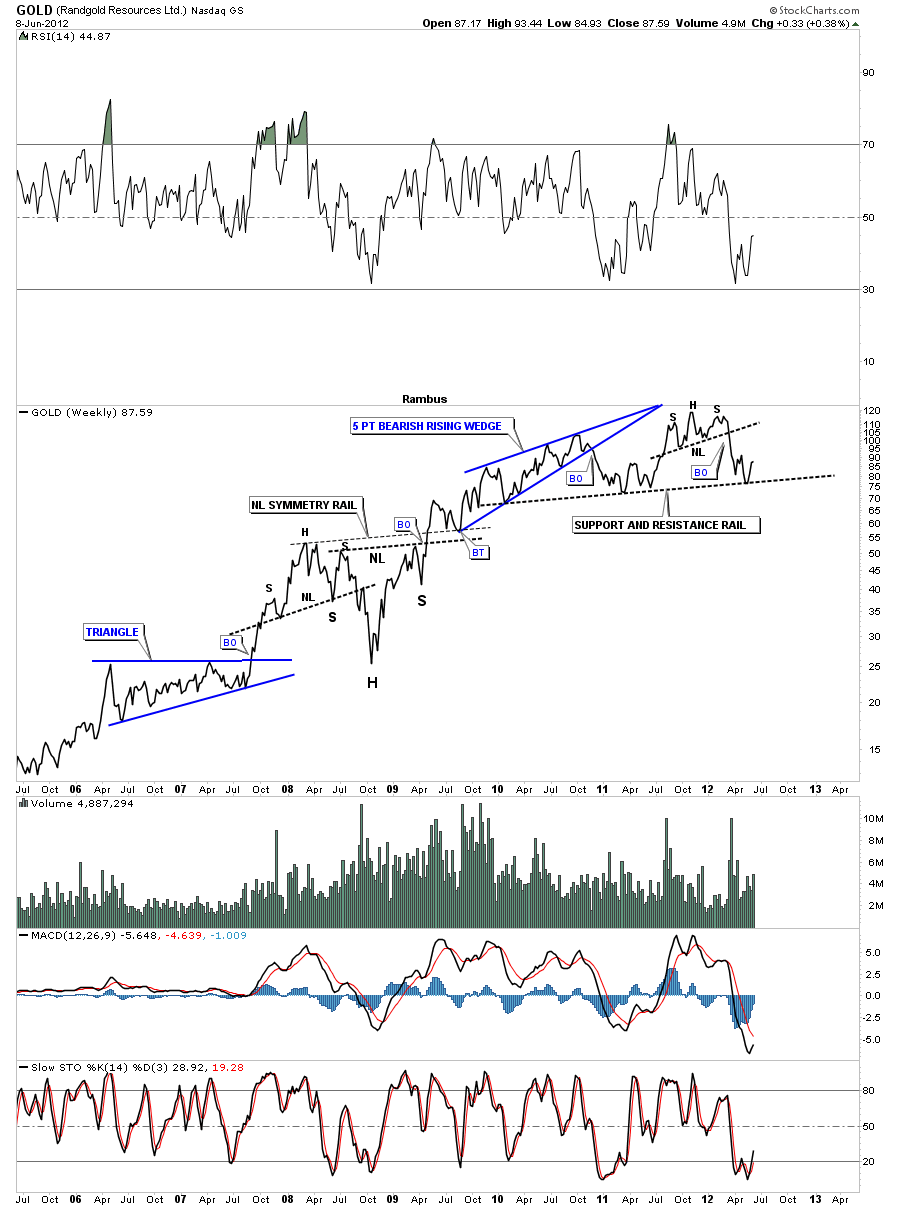
Gold, Randgold, is bouncing off it’s support and resistance rail. Note the small H&S top that started this latest move down. This stock could be building out a bigger H&S top formation before its all said and done.
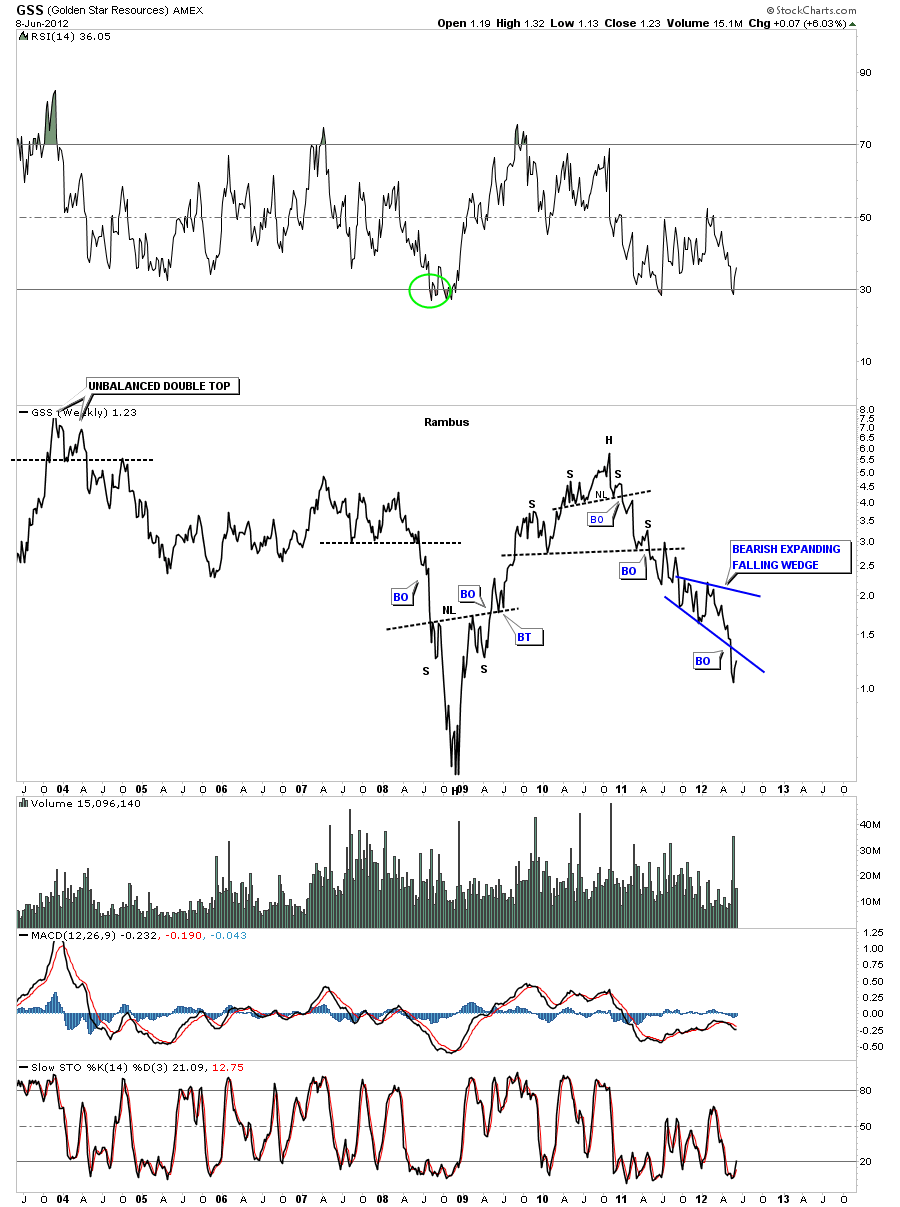
GSS built a H&S top and more recently broke out of a bearish expanding falling wedge consolidation pattern.
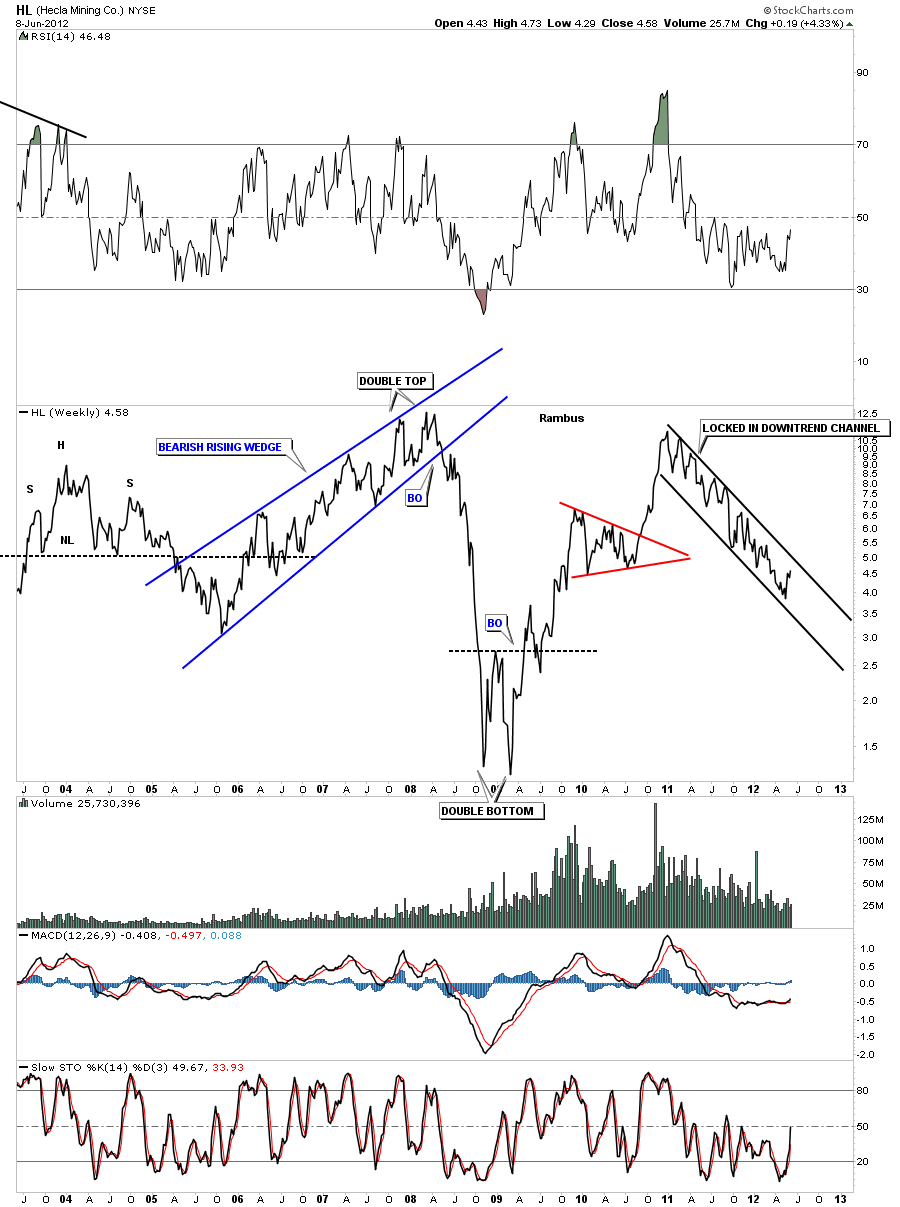
HL has been locked in a downtrend channel for well over a year now. Anyone trying to pick a bottom in this stock has been disappointed so far.
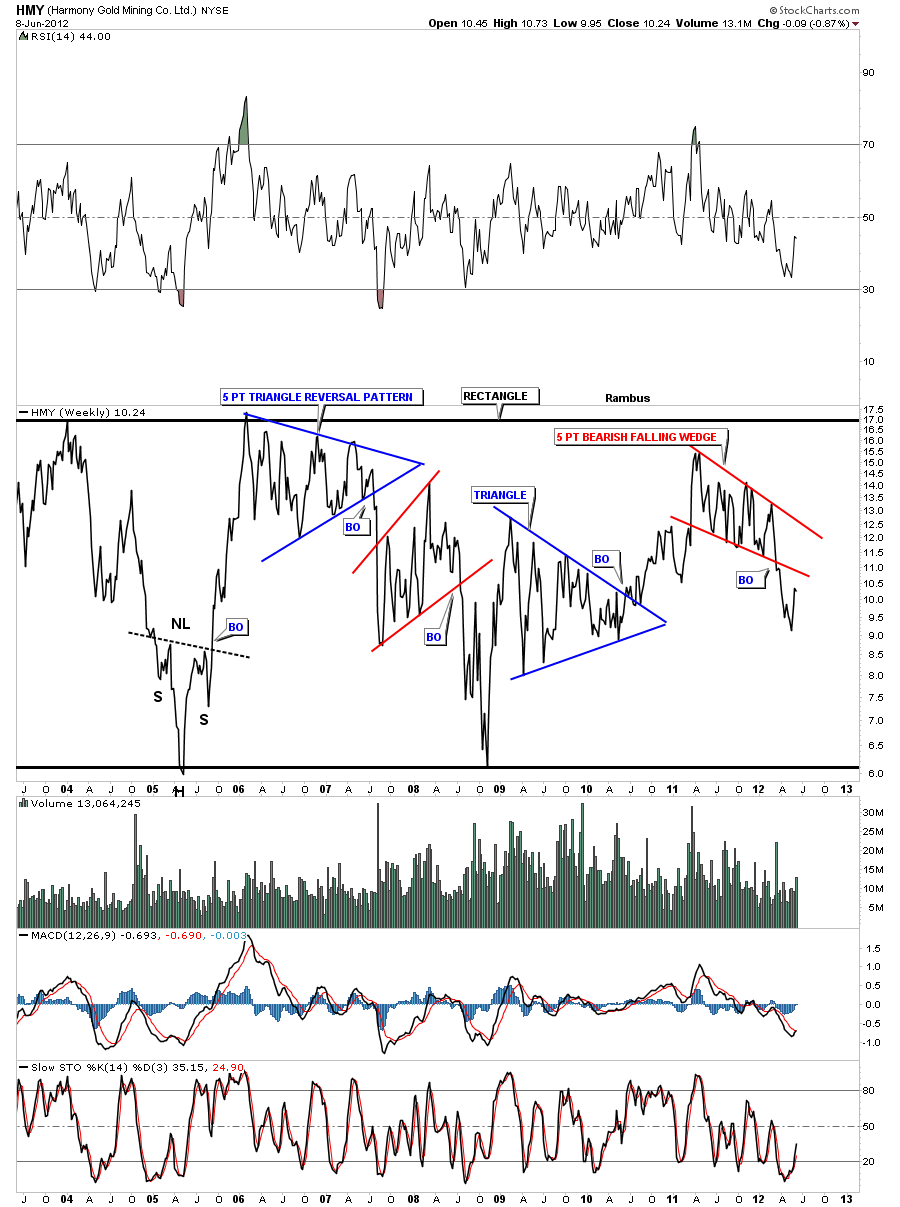
HMY has a 5 point bearish falling wedge that has broken down.
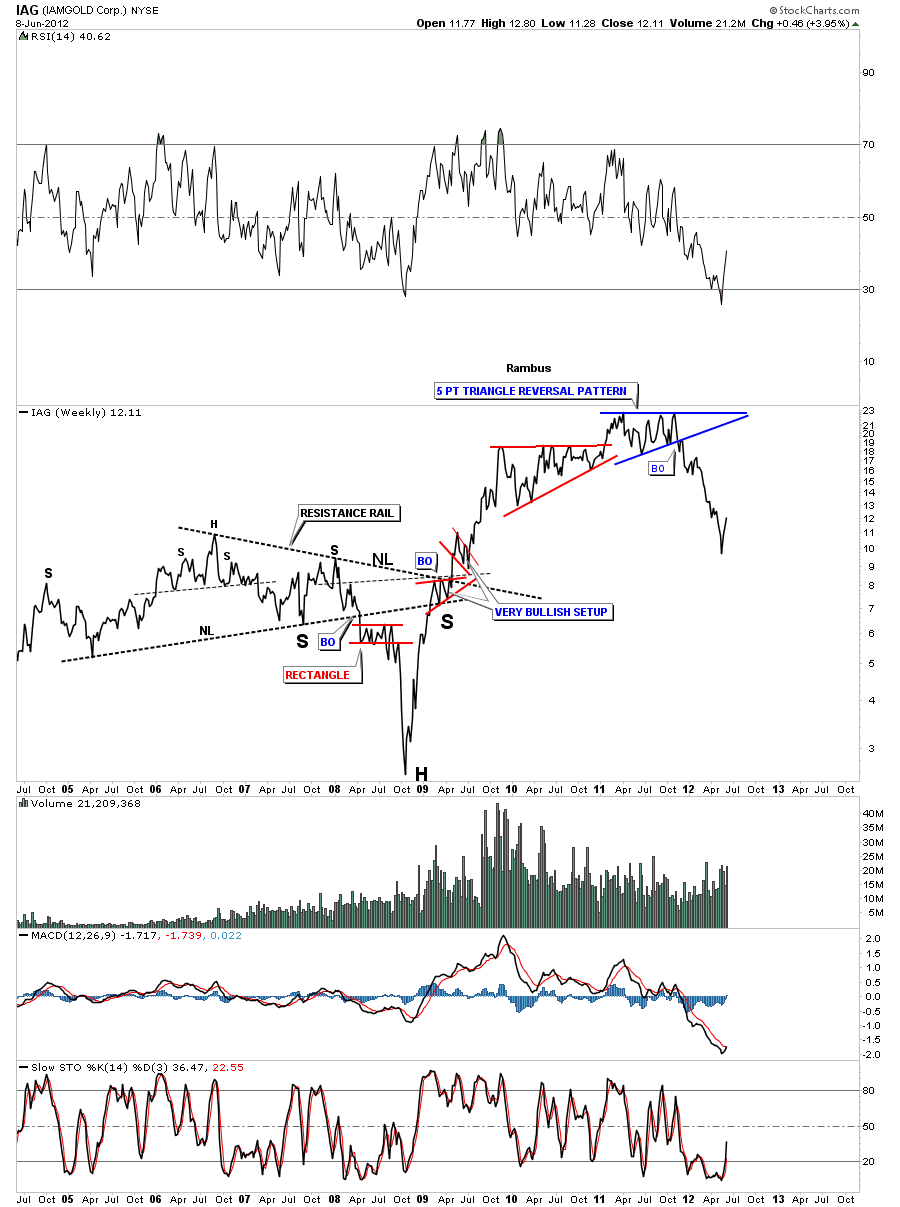
IAG had a 5 point triangle reversal pattern for it’s top. It wasted little time in falling to it’s most recent lows where it may start to form some type of consolidation pattern.
NEM has a small H&S top in place but the real pattern is the expanding uptrend channel. Note the price action once the bottom blue rail of the expanding channel gave way.
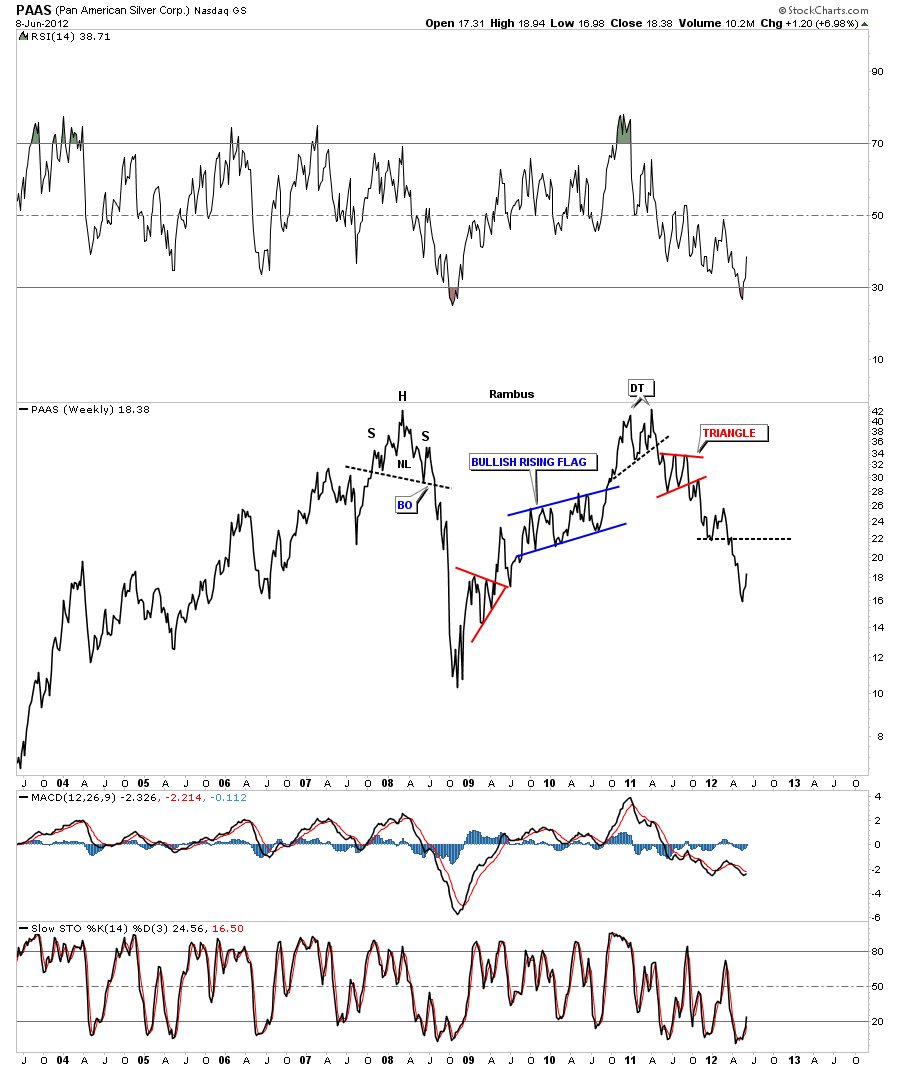
PAAS was one of the PM stocks that broke out earlier than the rest. It had a small double top that started the decline you see on the chart below.
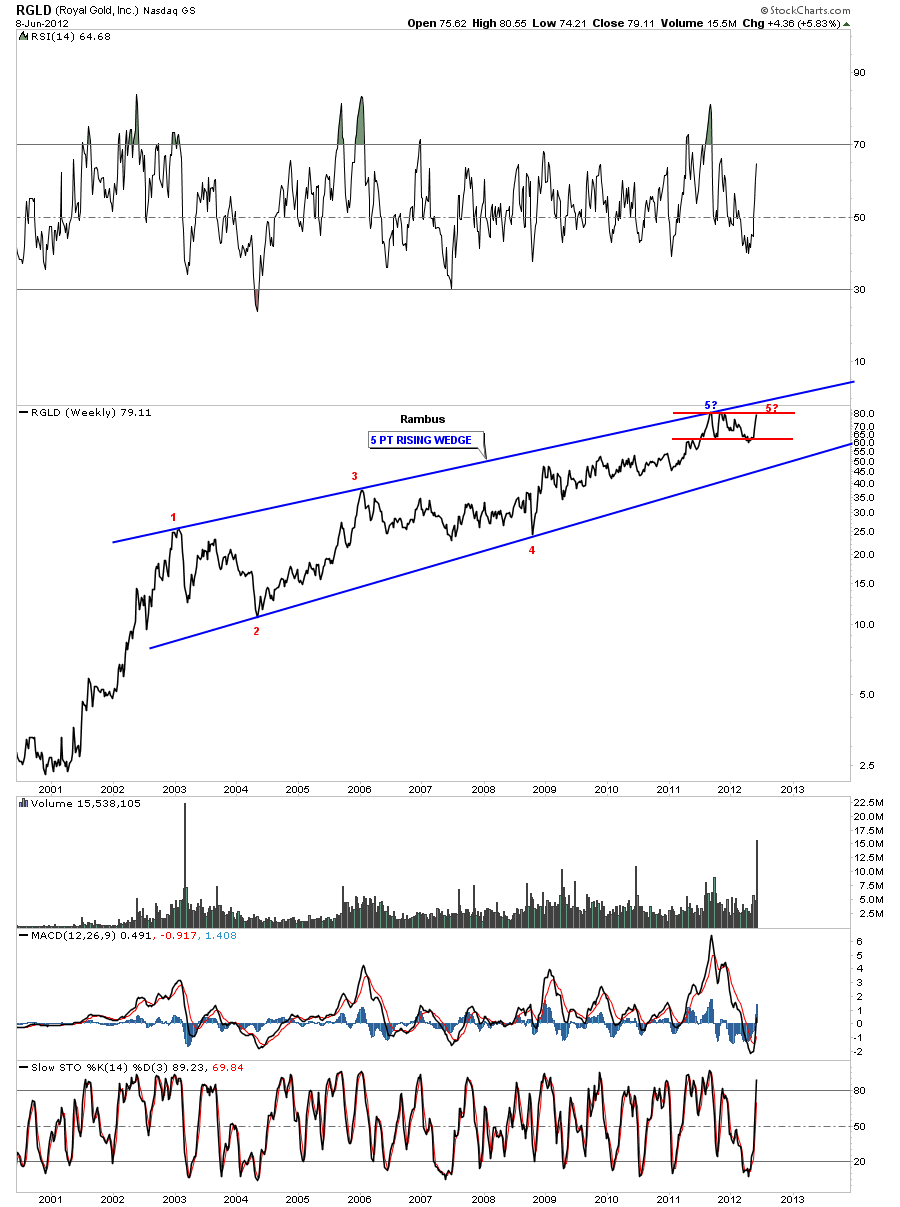
RGLD has been one of the stronger PM stocks. It has an interesting setup as there are 5 reversal points in the big blue rising wedge and we now are working on a possible 5th reversal point on the red rectangle. If RGLD can take out the top blue rail that would be a very positive development.
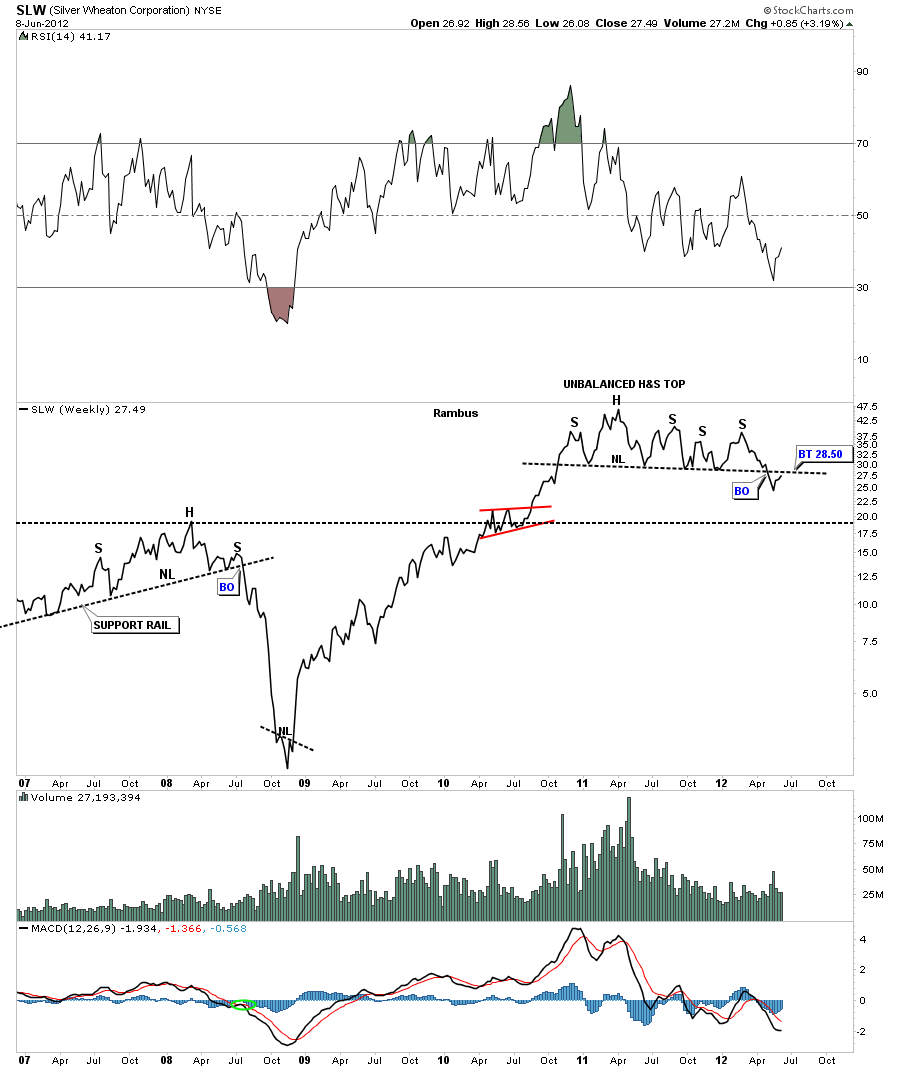
SLW is showing an unbalanced H&S top in place. It’s in the process of backtesting the neckline at 28.50 on a weekly closing basis. Note how many times the neckline was tested before the breakout came.
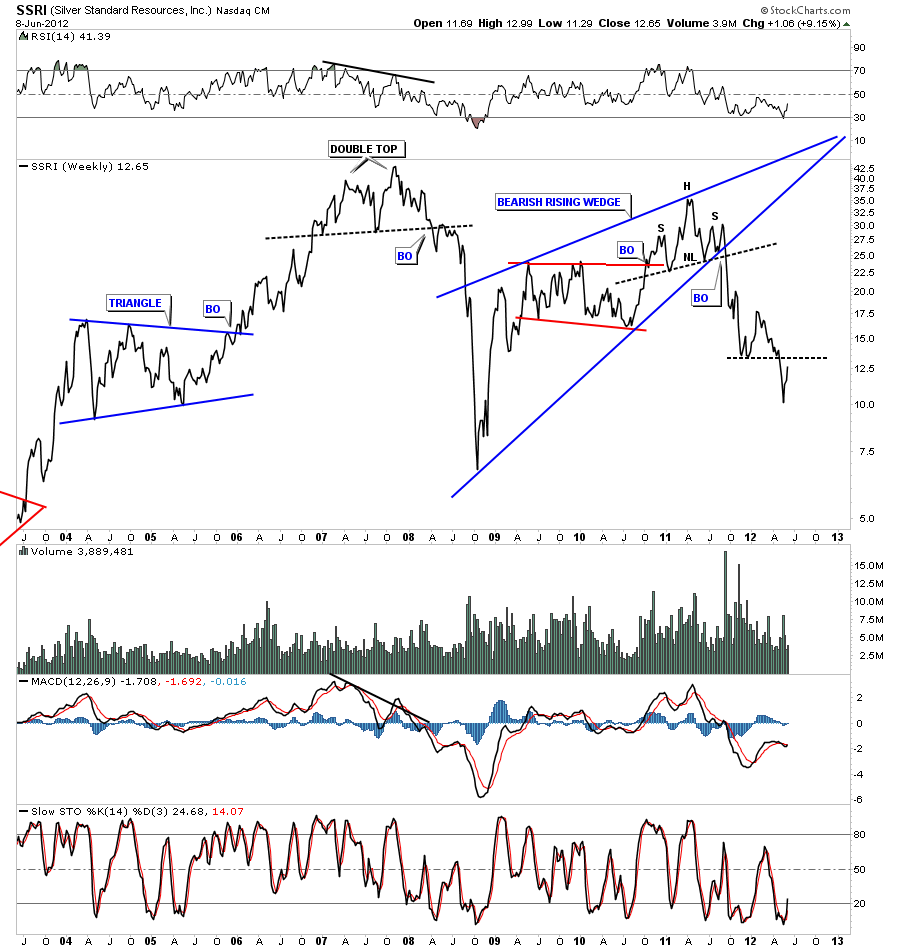
SSRI had a nice H&S top that was built at the apex of the big blue bearish rising wedge.
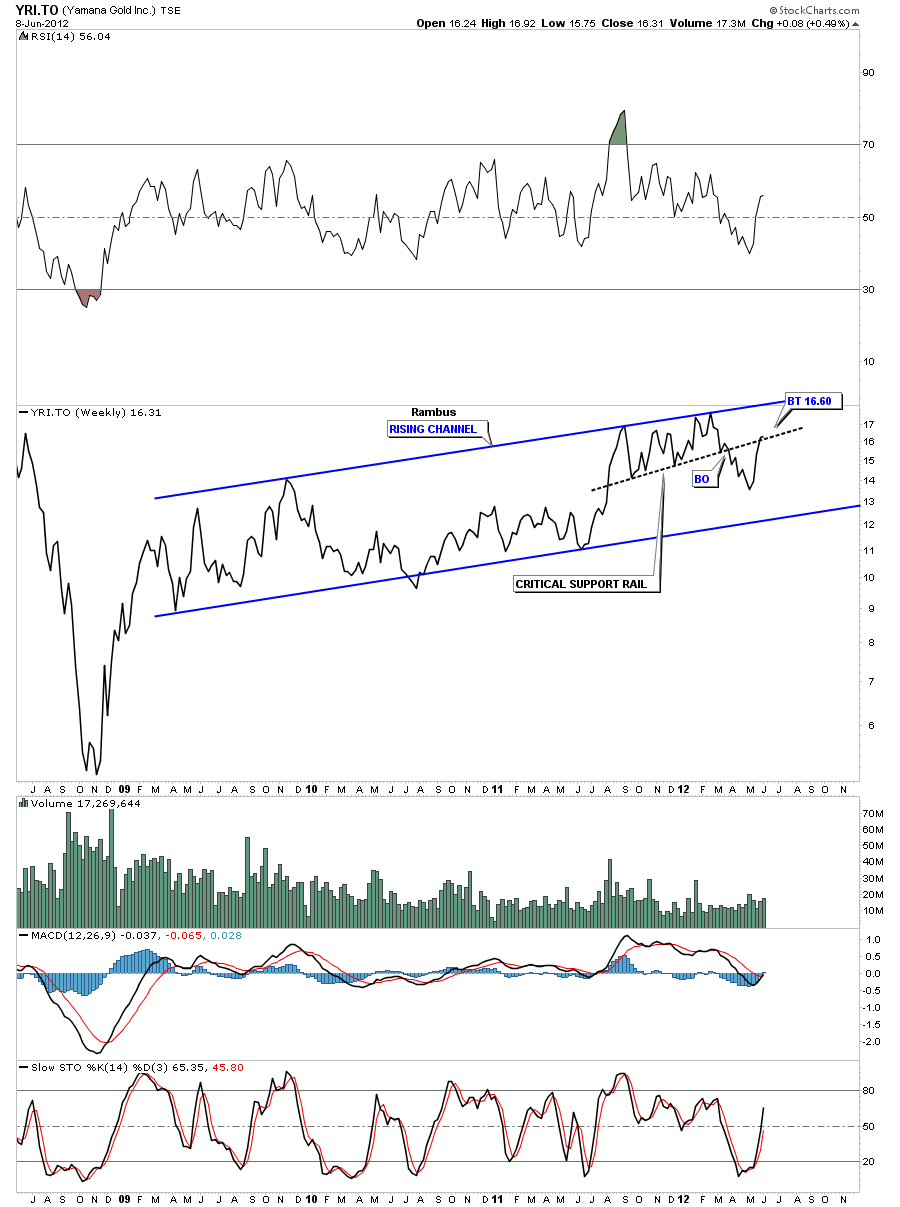
Lets look at one more chart. YRI.TO that has been one of the stronger PM stocks. Notice the black dashed rail that I have labeled as a critical support rail. Note how many times it was touched as support and now its having a critical backtest from the underside.
Now that we have looked under the hood of the precious metals indexes it looks to me like we still have alot of work to do before these stocks are ready to launch a major rally. I Know how hard hard it is to be on the sidelines right now waiting for the opportunity to buy the PM stocks but I can guarantee you that it would be more painful if you bought in and watched your favorite PM stock go against you. Cash is king right now and the opportunities will present themselves if we have patience. We had a successful backtest to the neckline, on the bar chart, this week for the HUI. We could still go up and test that big neckline several more times before its all said and done. As always I’ll be on the lookout for any bottoming formations to form from which the PM stocks could launch a major rally. As of right now we still seem to be in an impulse leg lower with some backing filling to be expected along the way. All the best…Rambus
EDITOR’S NOTE :
Rambus Chartology is Primarily a Goldbug TA Site where you can watch Rambus follow the markets on a daily basis and learn a great deal of Hands on Chartology from Rambus Tutorials and Question and Answeres .
Most Members are Staunch Goldbugs who have seen Rambus in action from the 2007 to 2008 period at www.goldtent.org and now Here at Rambus Chartology since early 2012 .
To review his Work and incredible calls from the 2007-2008 period click on the top right sidebar in the “Wizard of Rambus” ….”What If !!” Post
To Follow Rambus Unique Unbiased Chart Work and participate in a Chartology Form with questions and answeres and learn the Art and Science and Mindset of a Pro Trader please Join us by subscribing monthly for $29.99 at
www.rambus1.com
We have many subscribers from all over the world who are glad they did as they enjoy the many daily updates and commentaries provided at this exciting new site
As you will see Rambus (Dave) has prepared us for this difficult period by being one of the only ones to see and warn about this incredibly debilitating PM smackdown as early as Jan 2 2012 …click on the” HUI Diamond in the Rough” Post in the “Wizard of Rambus” top right
You will find Rambus to be a calm humble down home country tutor with an incredible repitoir of all the TA based protocols tempered with his own one of a kind style…simply put…He wants to keep his subscribers on the right side of these crazy volitile and downright dangerous markets
See you at the Rambus Chartology
…………………….

