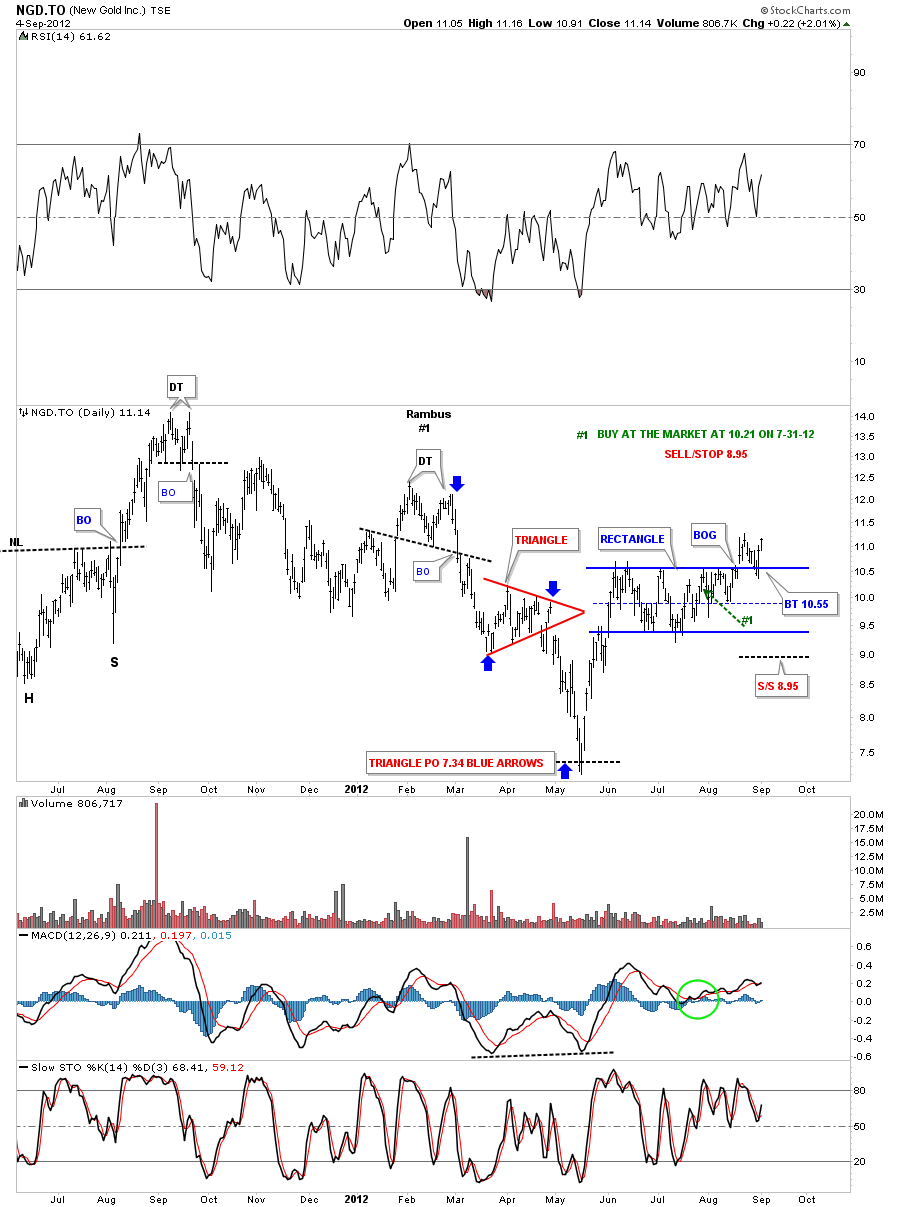
NGD.TO September 4th update. I’ve updated the daily chart for NGD.TO that is showing a very well defined rectangle consolidation now after a months worth of trading.
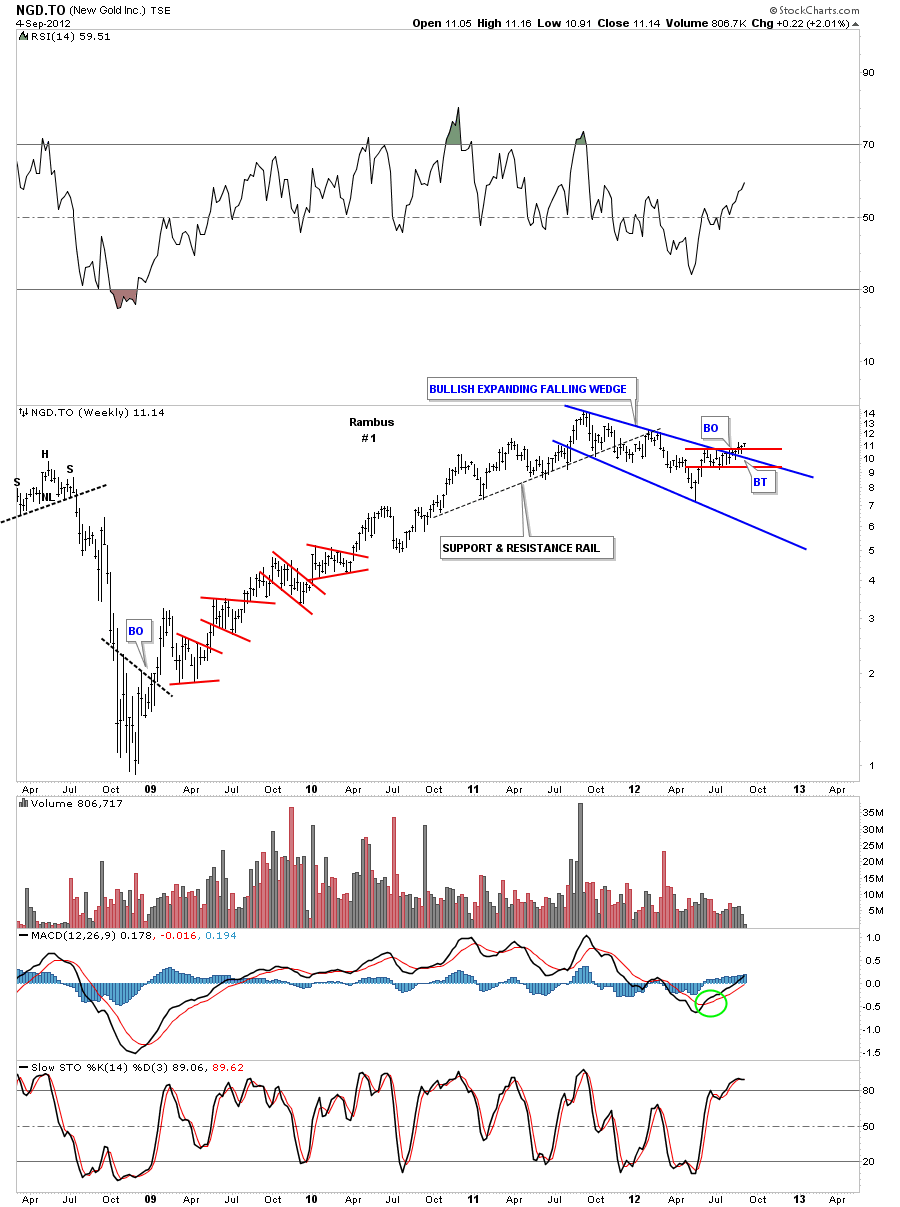
The weekly look shows NGD.TO has just now broken out of two important chart patterns. The red rectangle that I showed you on the daily chart above and a blue bullish expanding falling wedge several weeks ago.
This will be the first stock I will start the model portfolio with. Its been a long time coming but it looks like its time to start dipping our toes in the water. There are several PM stocks that are starting to show some life so I will start to post more PM stocks that we’ll add to the model portfolio as their trade setups become apparent. My goal is to get positioned for an impulse leg that may last anywhere 18 months to 2 years. This will be where the real big money will be made. Get right and sit tight. So far the precious metals complex hasn’t allowed us to do that as gold and silver have been consolidating, gold for 10 months and silver for 15 months, and the precious metals stocks have been totally hammered during the corrections in gold and silver. The HUI, GDX and XAU all look to have a double bottom in place which is a 3 point reversal pattern to the upside. As the double bottom is a reversal pattern it will give us more confidence to take the long side for a change. There is still some serious overhead resistance on the HUI at 465 that will have to be over come to really get the bull market going in the precious metals stocks. For right now as I see a decent trade setup in one of the precious metals stocks I will post it and put it into the model portfolio.


