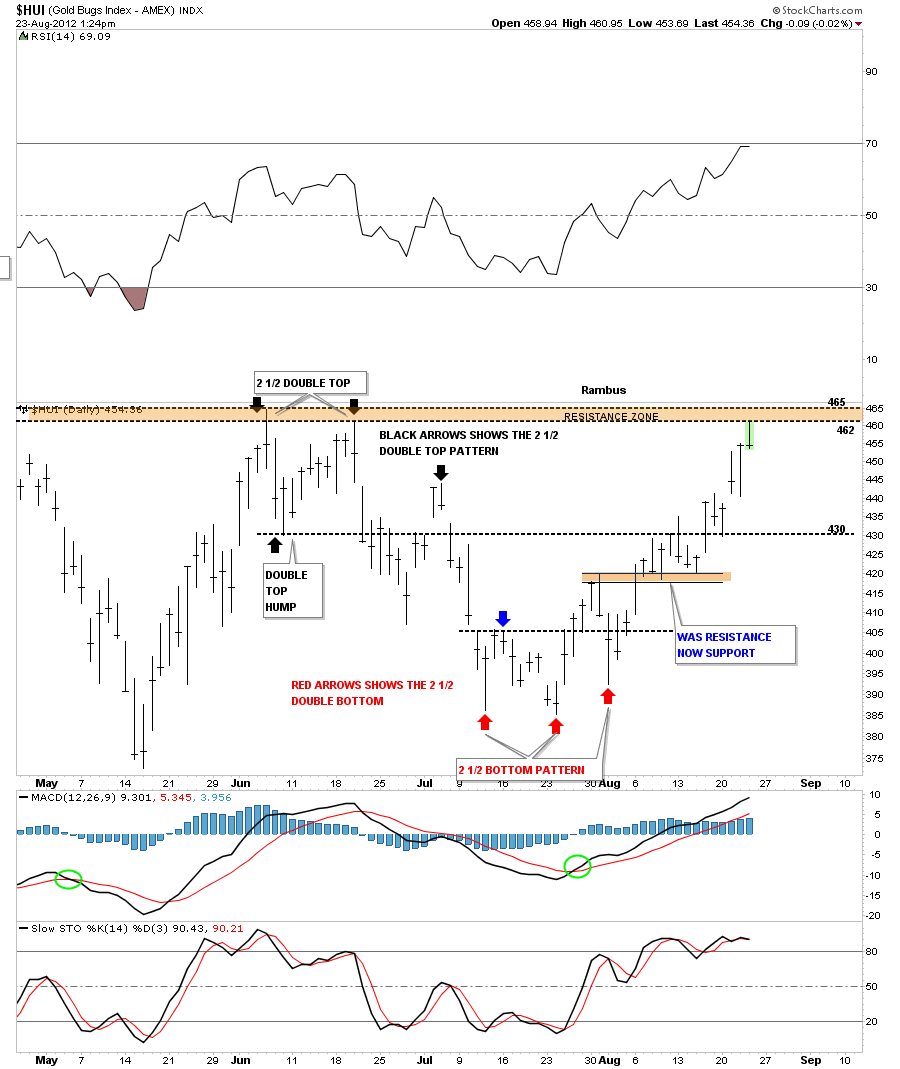
The HUI along with some of the other precious metals stock indexes are approaching some overhead resistance. The first chart I want to show you is a 4 month daily look that shows the HUI hitting the top horizontal resistance zone at 460 today. Initially you would expect a failure to occur right here as the bears see this as a place to go short or sell their positions. If the HUI is truly starting a new impulse leg higher its normal to see some backing and filling at overhead resistance. Whats important though is that after a few days or so the HUI rallies backup to the overhead resistance again attacking the bears. At some point, if this is a new impulse leg higher is for real, the bears will run out of ammunition and the bulls will overwhelm them in a big way and there will be a vacuum just above the horizontal resistance zone. The bulls will then run up to the next resistance zone where the same thing will happen again until there is no more overhead resistance. At that point the price action can move up more freely until the bears can mount another attack at higher prices.
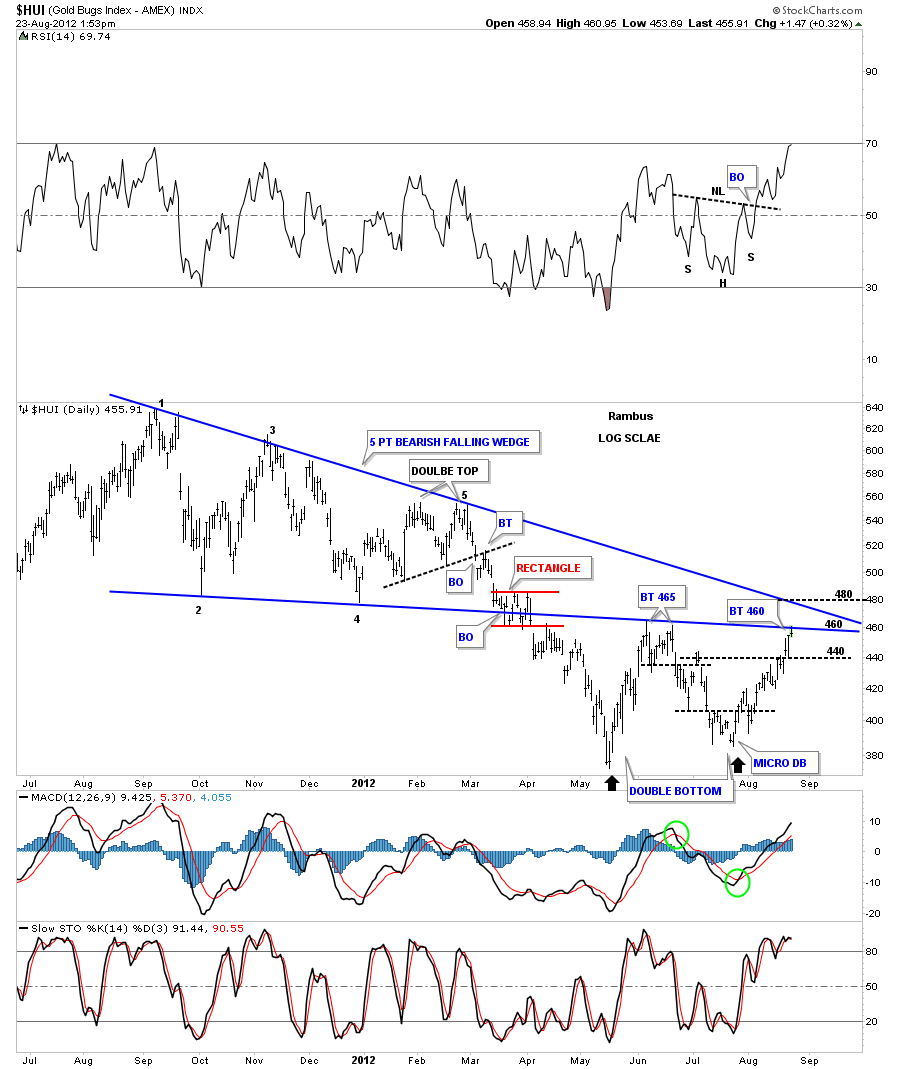
The next chart for the HUI shows the big 5 point blue bearish falling wedge that has been in place for close to a year now. As you can see on the chart below the HUI hit the bottom blue rail this morning at 460 and has bounced off. This tells us that bottom blue rail is HOT and the bears are in control for the time being. A break above that bottom blue rail will have the bears running for cover looking for the next logical place to put up some resistance which will probably be the top blue rail of the bearish falling wedge around 480 or so.
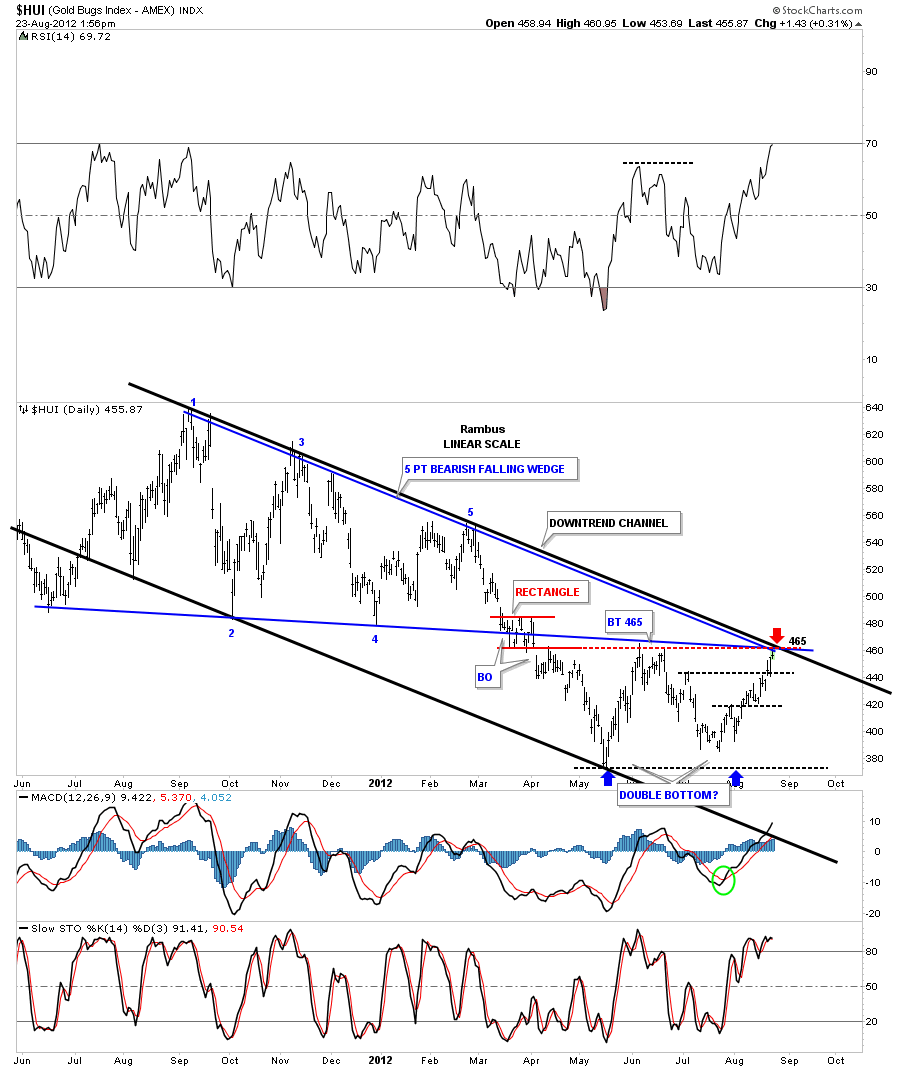
This last chart I want to show you is a one year and 3 month look at several of the big patterns that have formed over that period of time. The first pattern is the bearish falling wedge that I showed you on the chart above, in blue. Another important chart pattern is the downtrend channel that has been in play for the whole move down and the last pattern is the little red rectangle that formed right on the bottom blue rail of the blue falling wedge. You can see on the chart below how the bottom rail of the red rectangle has held resistance since the price action broke below it in April of this year. The red arrow shows you where we have a confluence of trendlines all intersecting at roughly the 465 area. This is why today’s action is alittle disappointing if one doesn’t understand how support and resistance works. This is perfectly normal behavior being displayed by the HUI. Keep in mind that once all this overhead resistance is taken out to the upside it will then reverse it’s role and act as support on any decline.


