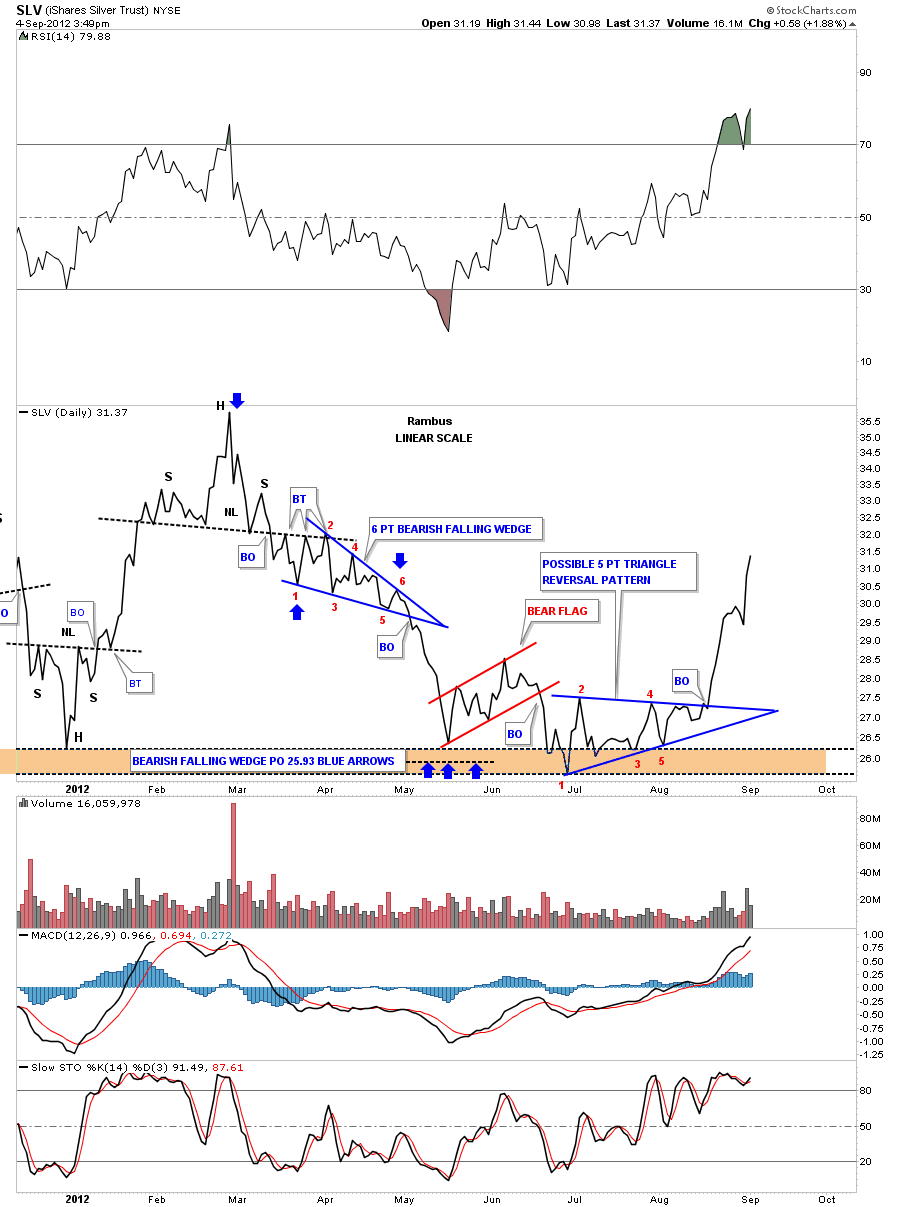
Just a quick update that shows a daily line chart for SLV. I know alot of chartists don’t like to use line charts but I find they add a different dimension to a chart. Double bottoms and tops tend to show up very well with line charts as they takeout some of the noise that a bar chart can produce. Also some other chart patterns like H&S and triangles can show a more clean chart pattern sometimes, that is why I find it useful to look at both. When you look at the daily line chart below notice the price action that takes place once a chart pattern is complete. On a line chart you will generally see a nice smooth line when the rally or decline begins letting you know the chart patterns was in fact a valid pattern. Also notice how the fight between the bulls and the bears takes place within each consolidation pattern by the choppiness within the confines of the pattern. Then the pressure is released and to the victor goes the spoils.
I have been working on getting the charts for the model portfolio and the other trades we have listed on the sidebar brought up to date. Most of the changes will take place on the daily charts as the weekly and monthly charts don’t change much over a month or so. I will try to post something interesting each day but my main focus for the very near term is to get the model portfolio updated so everyone can see what is taking place. Thanks Rambus

