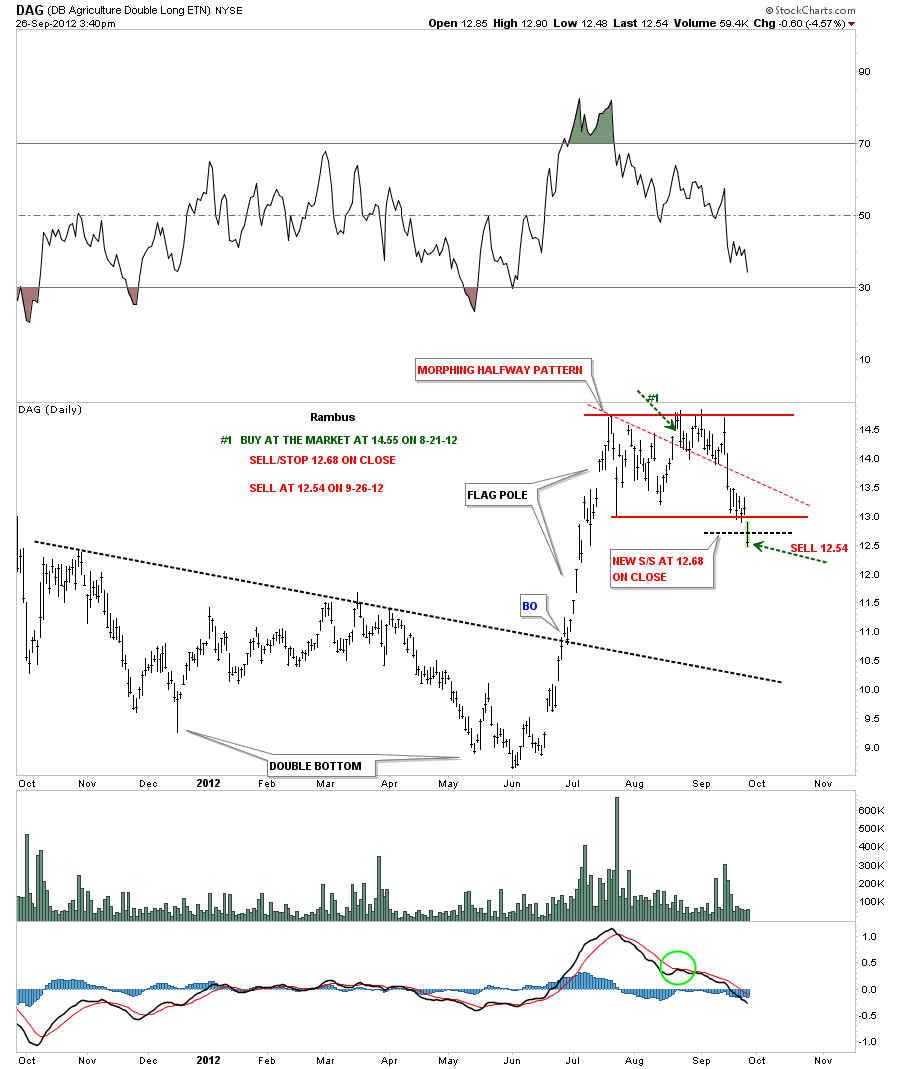
DAG daily update 9-26-12. Sold today at 12.54.
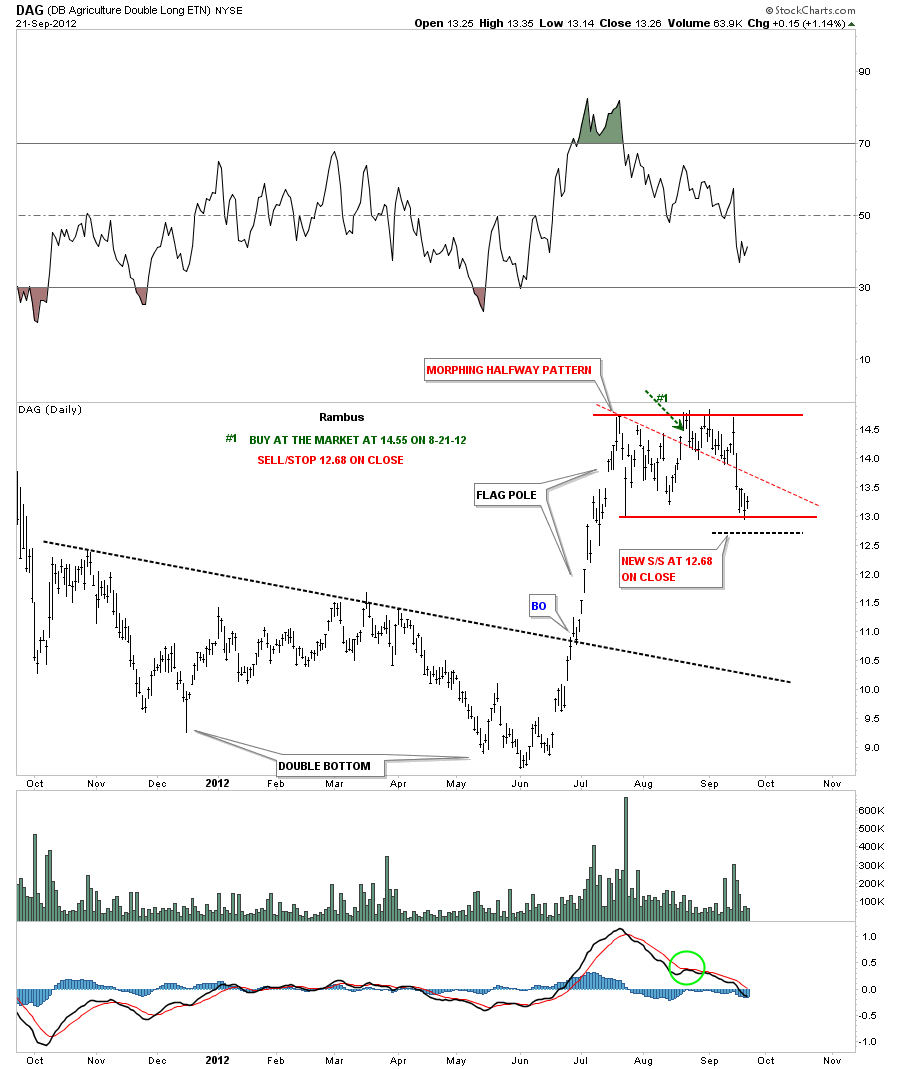
DAG daily update 9-22-12. Moving sell/stop down to 12.68 on close. If DAG closes below 12.68 we are out.
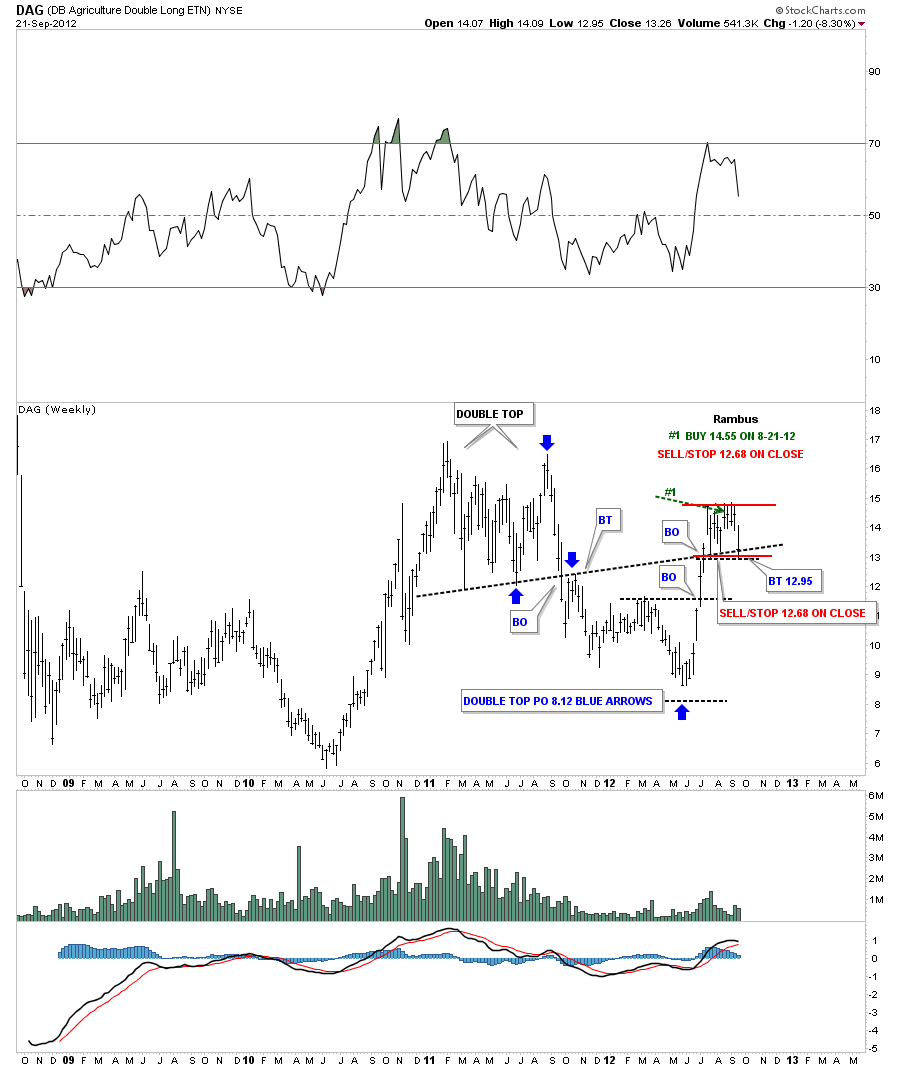
DAG weekly update 9-22-12
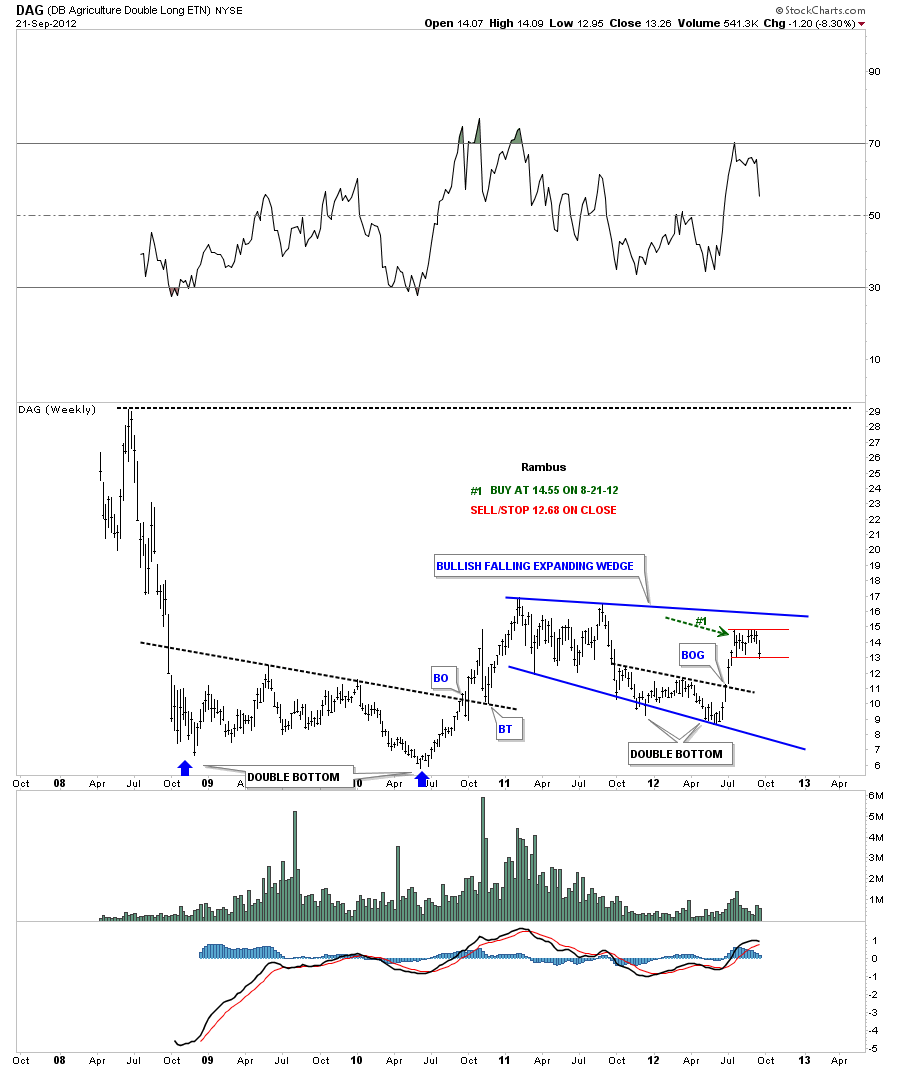
DAG weekly update 9-22-12. Another view of the weekly chart.
Update 9-20-12
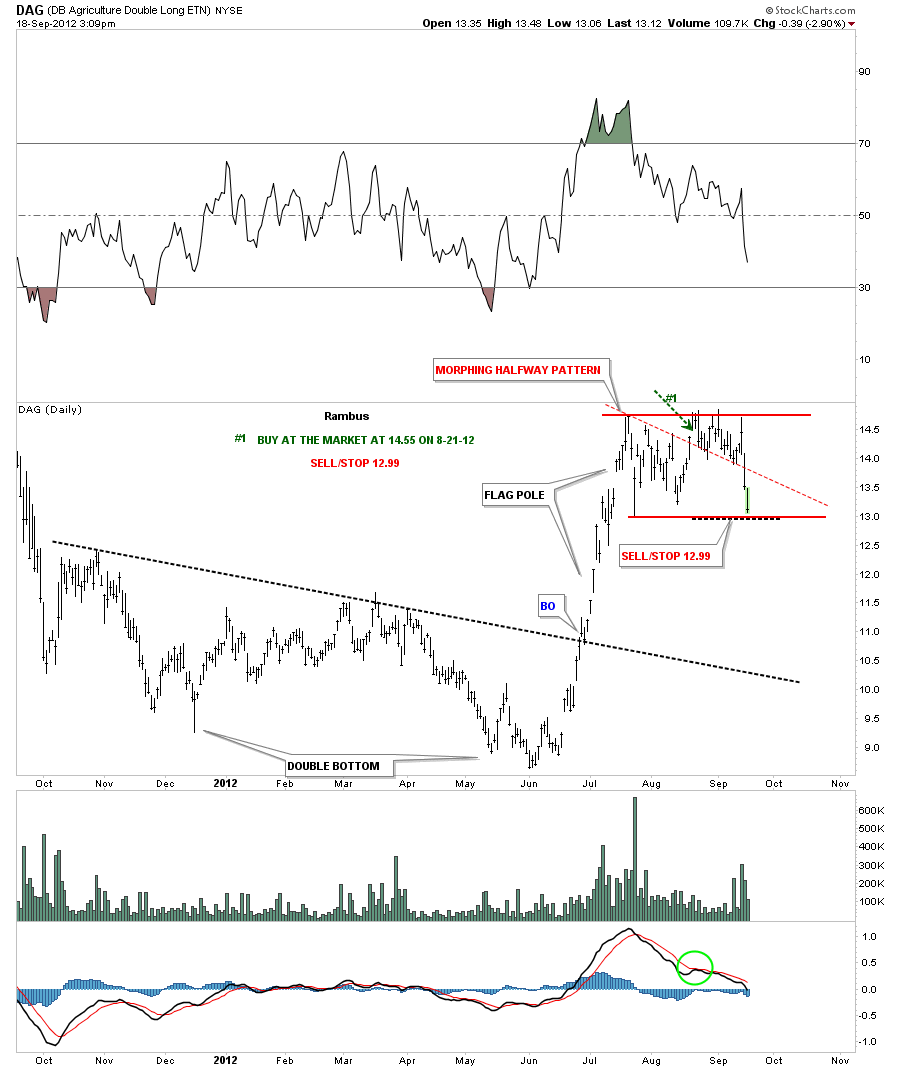
DAG is approaching it’s sell/stop at 12.99. The original pattern started out as a triangle that has now morphed into a horizontal trading range or rectangle. You can see on the chart below our buy point was on the breakout gap from the smaller triangle. The top rail of the triangle was the red dashed trendline. DAG is now trading back at the bottom of the trading range just a few points from our sell/stop. This pattern could still be a consolidation where prices breakout to the upside. The weekly chart looks more encouraging. First the daily chart.
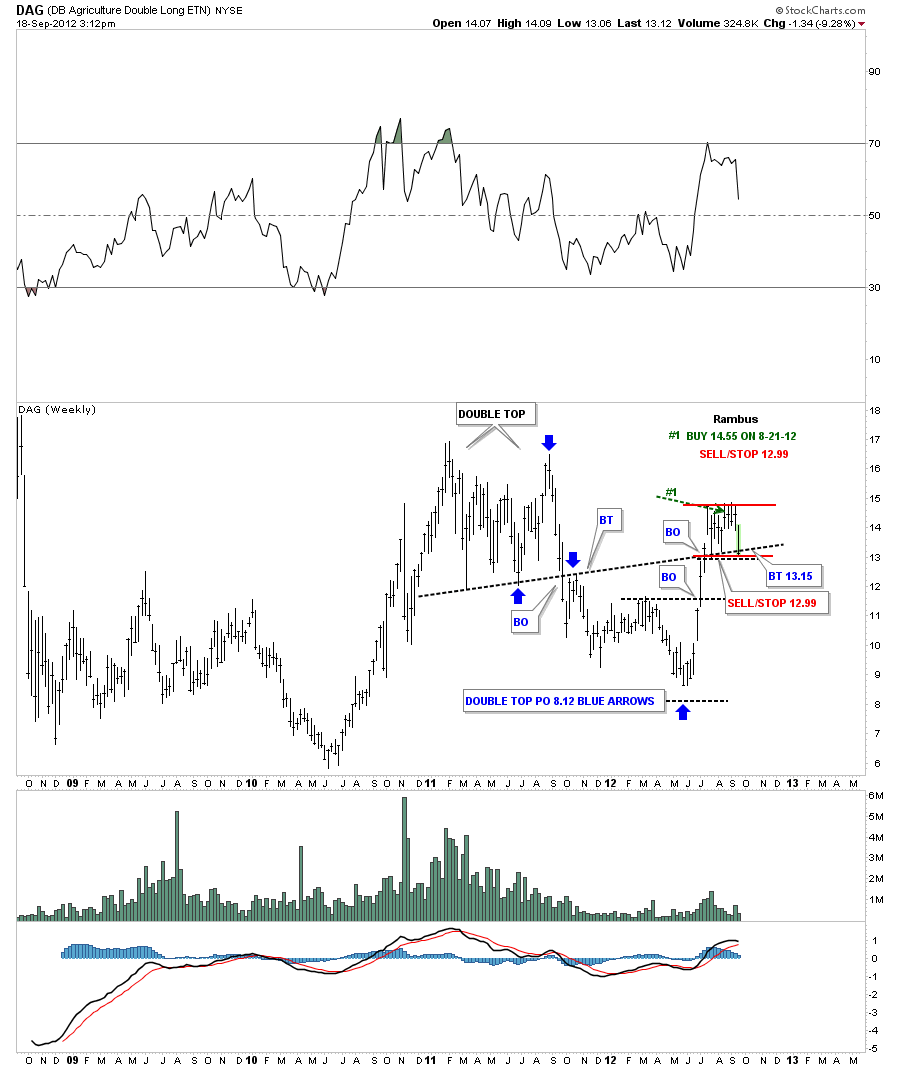
You can see on the weekly chart that the price action is now testing the black dashed support and resistance rail. This would actually be the best lowest risk entry point if one wasn’t already in. I’m personally going to wait one more day and see what happens tomorrow around the support and resistance rail. You can use the existing sell/stop at 12.99 if you prefer. There are many other places to put your capital to work if you get stopped out. I will let you know when I actually sell my position if it happens.

