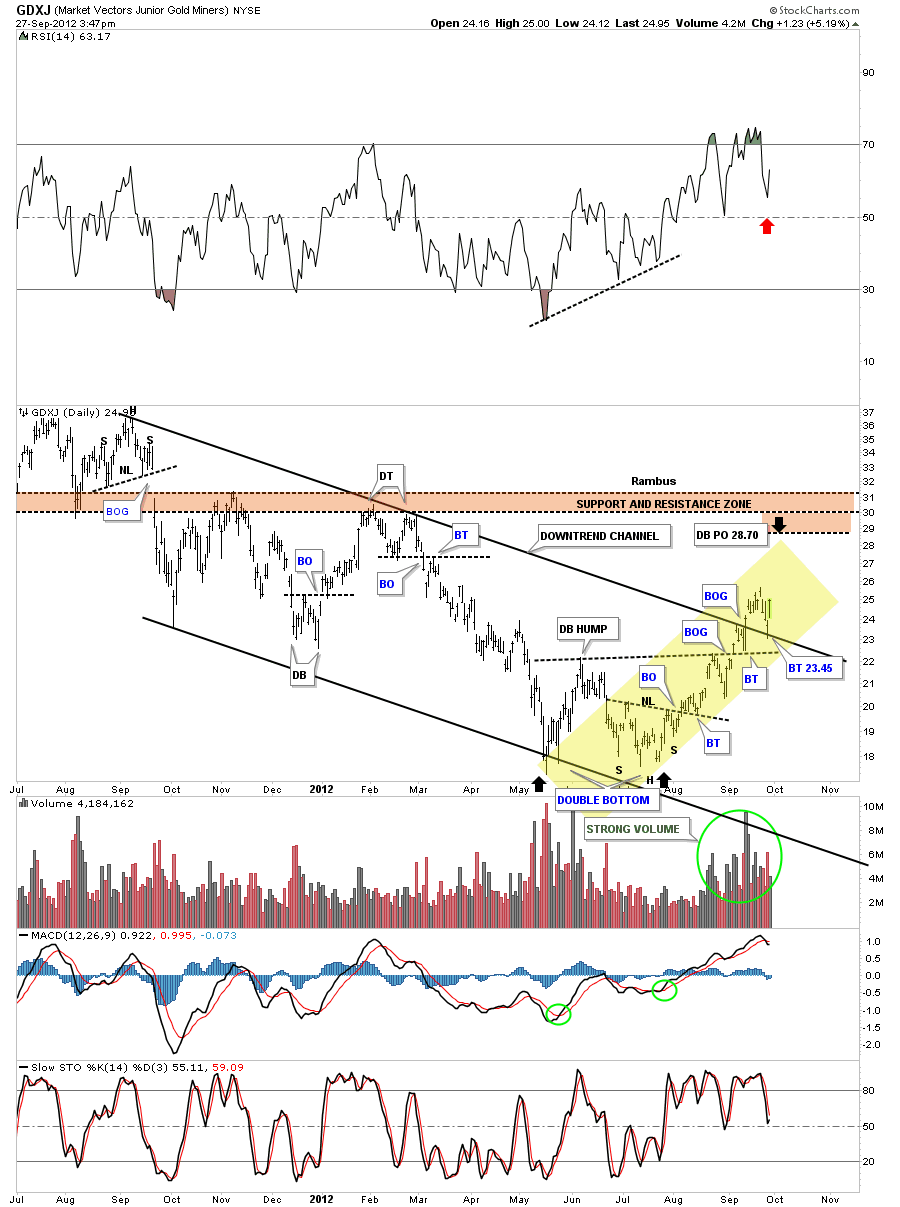
Just a quick update on the GDXJ chart that I showed you a couple of days ago. I showed you how perfect this junior index has been performing. The yellow shaded area shows you how each breakout was followed by a backtest. Yesterday we got the backtest to the the top rail of the downtend channel. This was a big deal IMHO. It told us that top rail is still very hot and to be respected. The yellow shaded area should be in a textbook somewhere that shows how charting works and that it isn’t some kind of voodoo magic or something. Its all based on investor psychology. Read my post on September 24th.
Rambus Chartology
Moving forward

