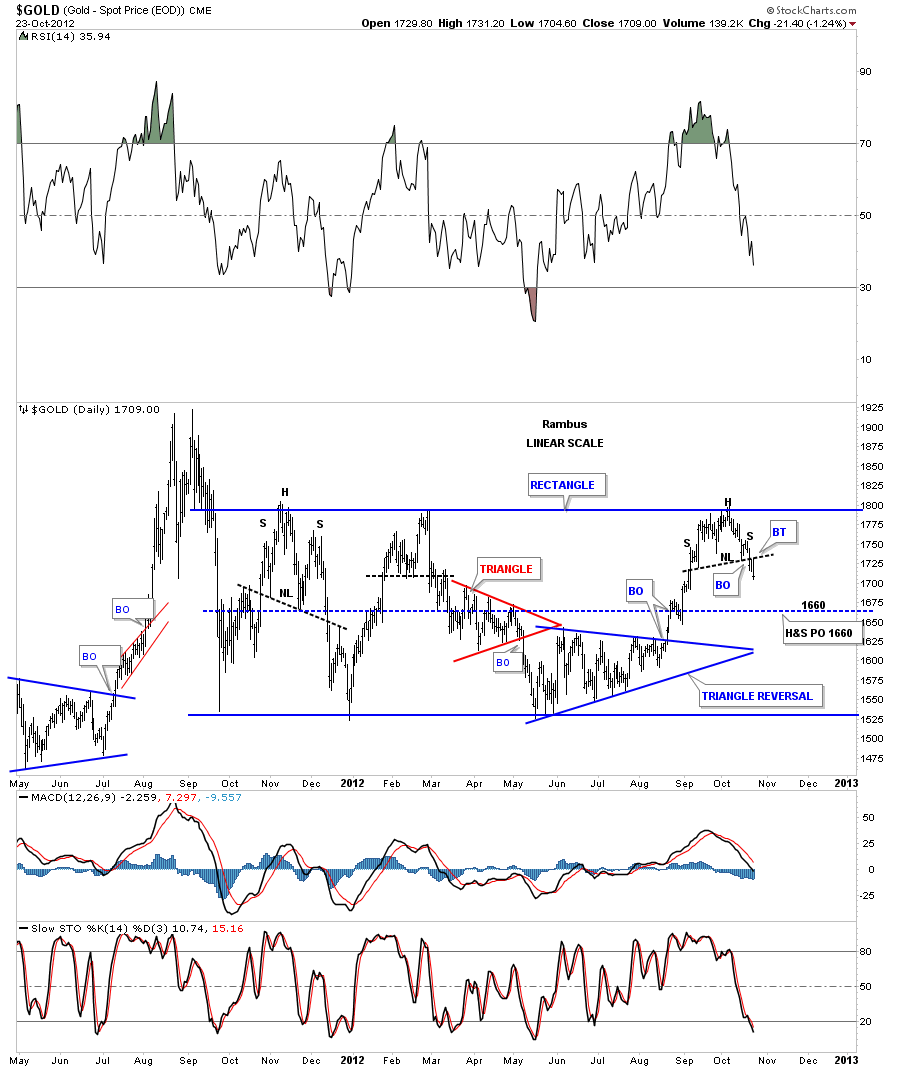
Below is a daily chart for gold that is showing a small H&S top pattern that I recognized last night after going over many charts for gold. This pattern is forming just under the top horizontal rail of the big rectangle. I was looking for a small consolidation pattern just under the top rail but it now looks like a H&S top is in place. This H&S top has a price objective down to the 1660 area that is the center of the rectangle. Yesterday’s price action was the tell by the way gold backtested the neckline from below and then sold off. This is the reason we sold our Kamikaze trades this morning. We also had some nice profits that I didn’t want to see evaporate away if gold does trade down the the 1660 area. Raising some cash in here looks like the prudent thing to do for the Kamikaze trades.
Rambus Chartology
Moving forward

