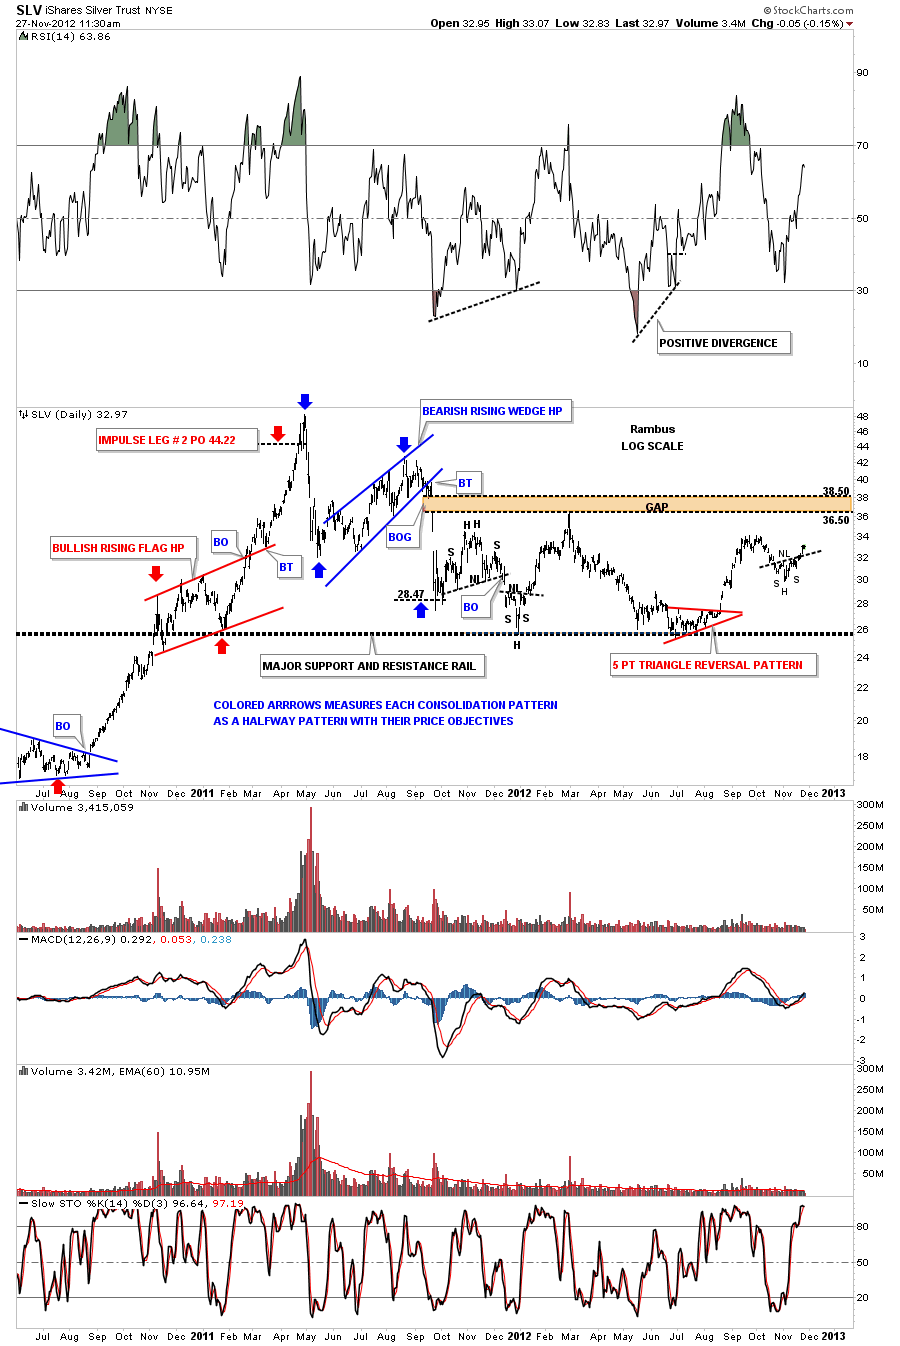
I just want to show you a quick update on the 2 1/2 year daily chart that shows the big 2 point gap that was made on the way down back in September of 2011. I have always kept the big gap on my radar screen knowing one day we would eventually be back to visit this area. You can see our little H&S bottom on the far right side of the chart that may give SLV enough energy to reach the gap area. For those that are studying halfway patterns there are a couple of good examples on the chart below.
Rambus Chartology
Moving forward

