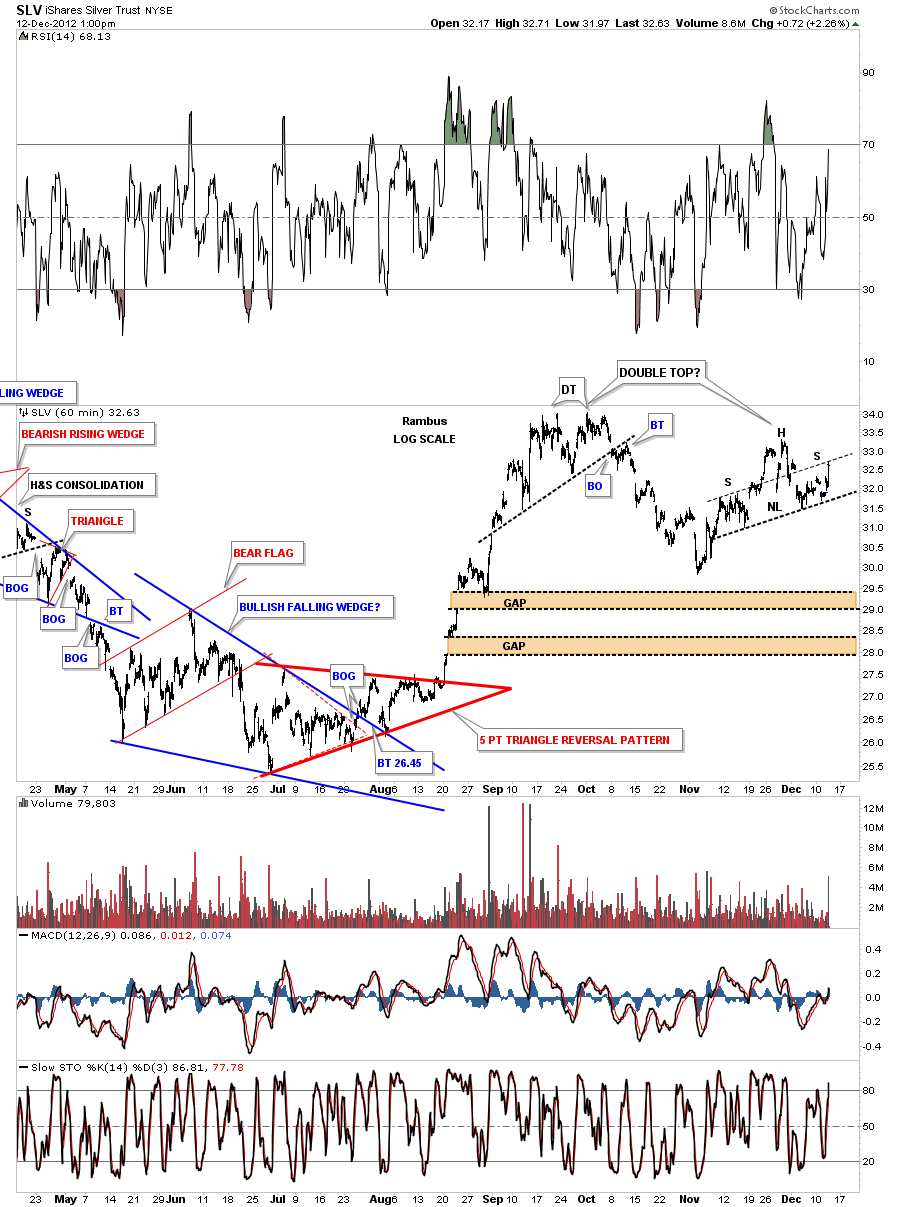
I’ve been watching the 60 minute chart for SLV that is at a critical area right here. SLV just hit the neckline symmetry rail for a possible right shoulder of H&S top pattern that could be part of a bigger unbalanced double top.
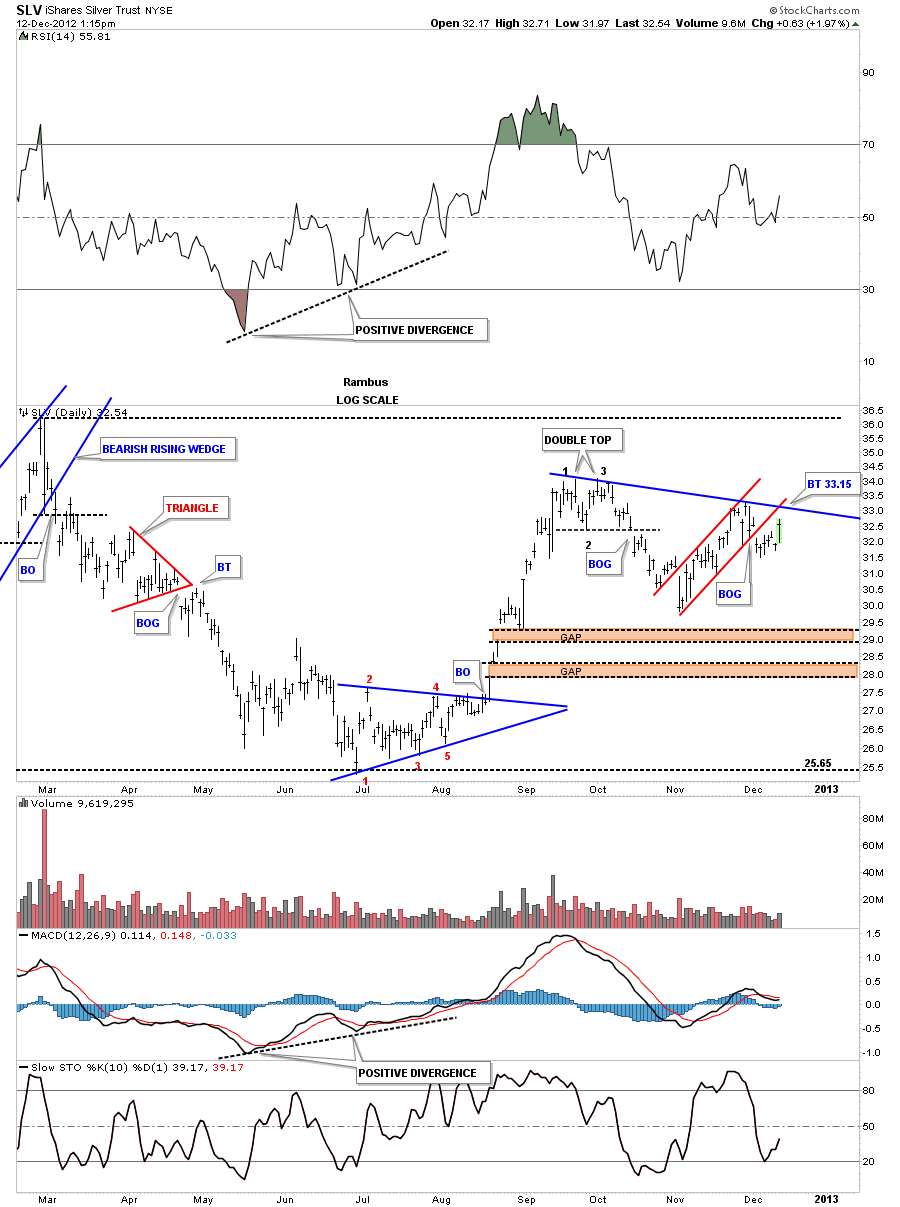
This next chart shows the small double top that was made back in September and the red uptrend channel that broke out to the downside 8 days ago. I’ve connected both tops with a blue downtrend rail that intersects around the 33.15 area. If SLV can trade above that area that would be a bullish sign as it would be making a higher high. There are still two unfilled gaps down at the 28 and 29 area that still may get filled at some point in time.
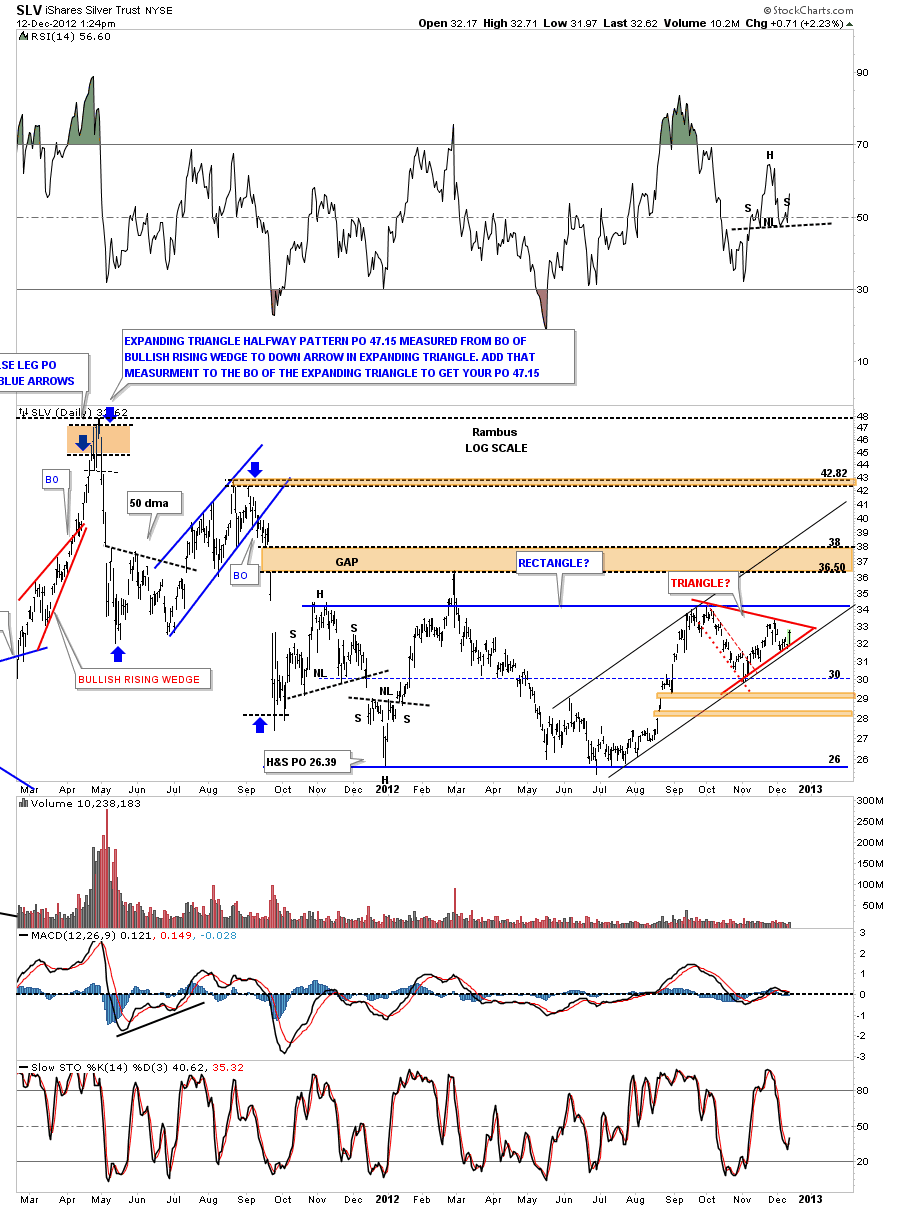
This next chart shows what everybody is watching right now. Its the uptrend channel with the possible red triangle forming. The top of the red triangle comes in at 33.15. The question is will it be a 4 point consolidation pattern to the upside or will the price reverse at 33.15 for a 5th reversal point making the red triangle a reversal pattern?
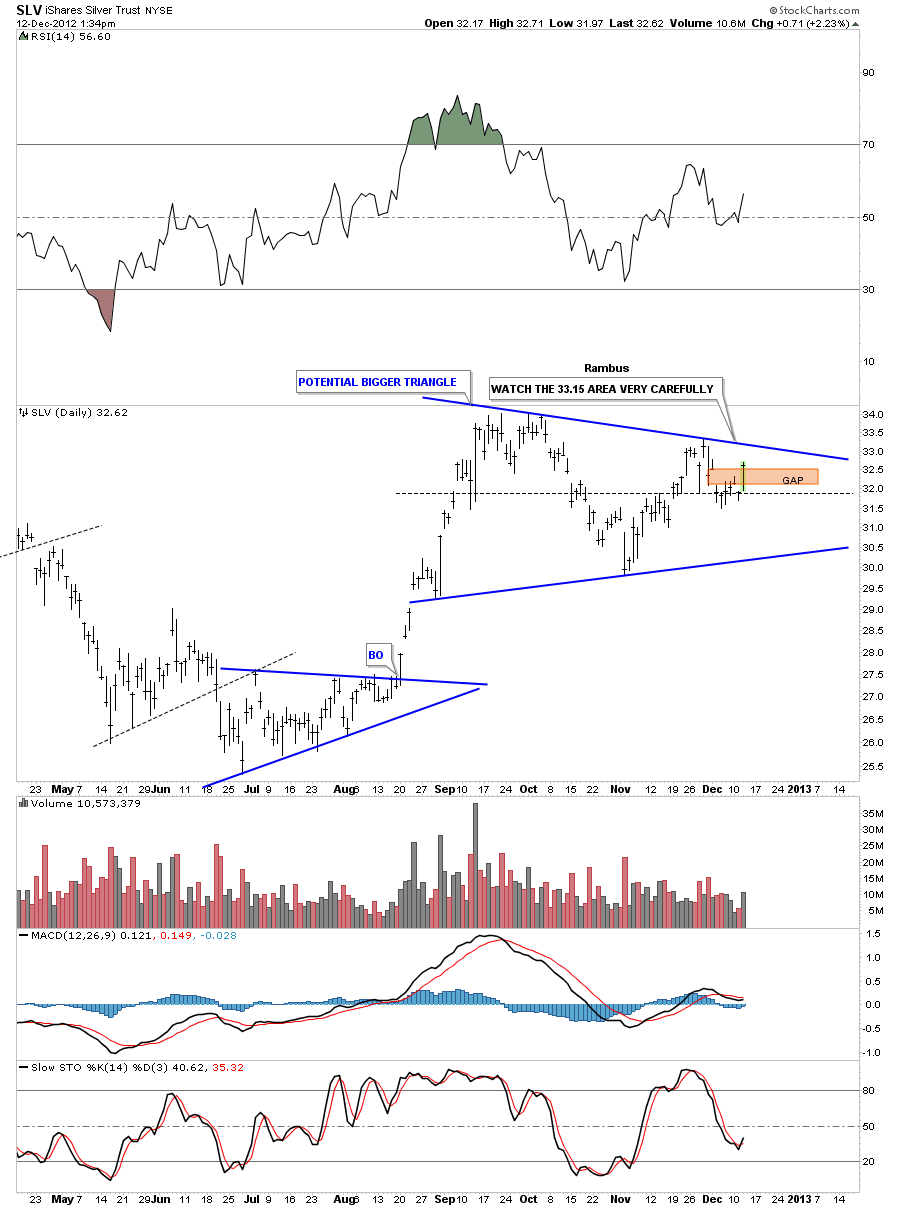
Below is another possible triangle that could be forming that is much bigger than the one above. Its alittle more symmetrical in appearance. Again, the 33.15 area is a critical place to watch on the top blue rail.


