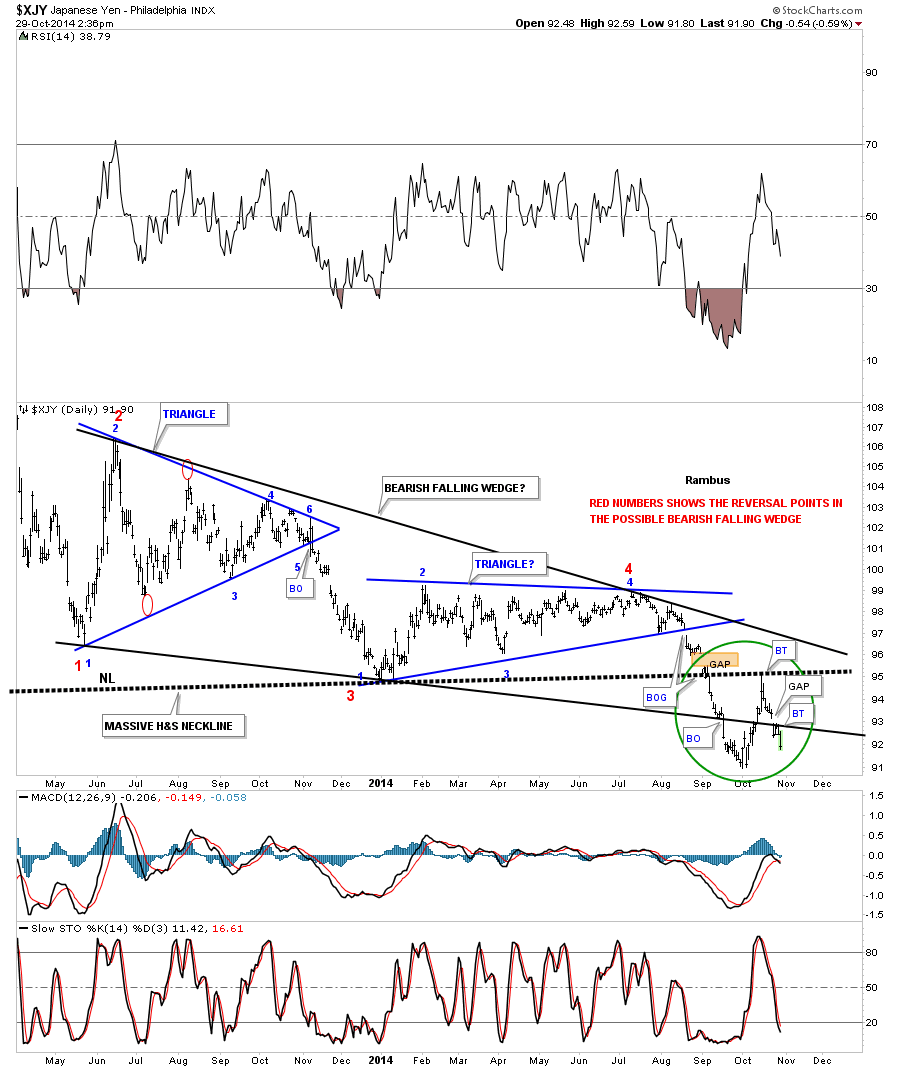
Below is the daily chart for the yen we’ve been following with great interest regarding the movements in the precious metals complex. I want to focus in on the price action within the green circle. After breaking down from the massive H&S neckline the yen found about 3 days of support on the bottom rail of the black bearish falling wedge before it fell to the October low. From the October low the yen started its counter trend rally that would backtest either the bottom rail of the bearish falling wedge or the much bigger and stronger neckline of the massive H&S top. As it turned out the backtest to place at the neckline and then reversed back down just as you would expect. Note how the price action gapped below the bottom rail of the black falling wedge and has been backtesting it for the last three days or so. It now looks like the backtest is completing and the real move down maybe just getting started. Confirmation will be when we see the yen take out the October lows.
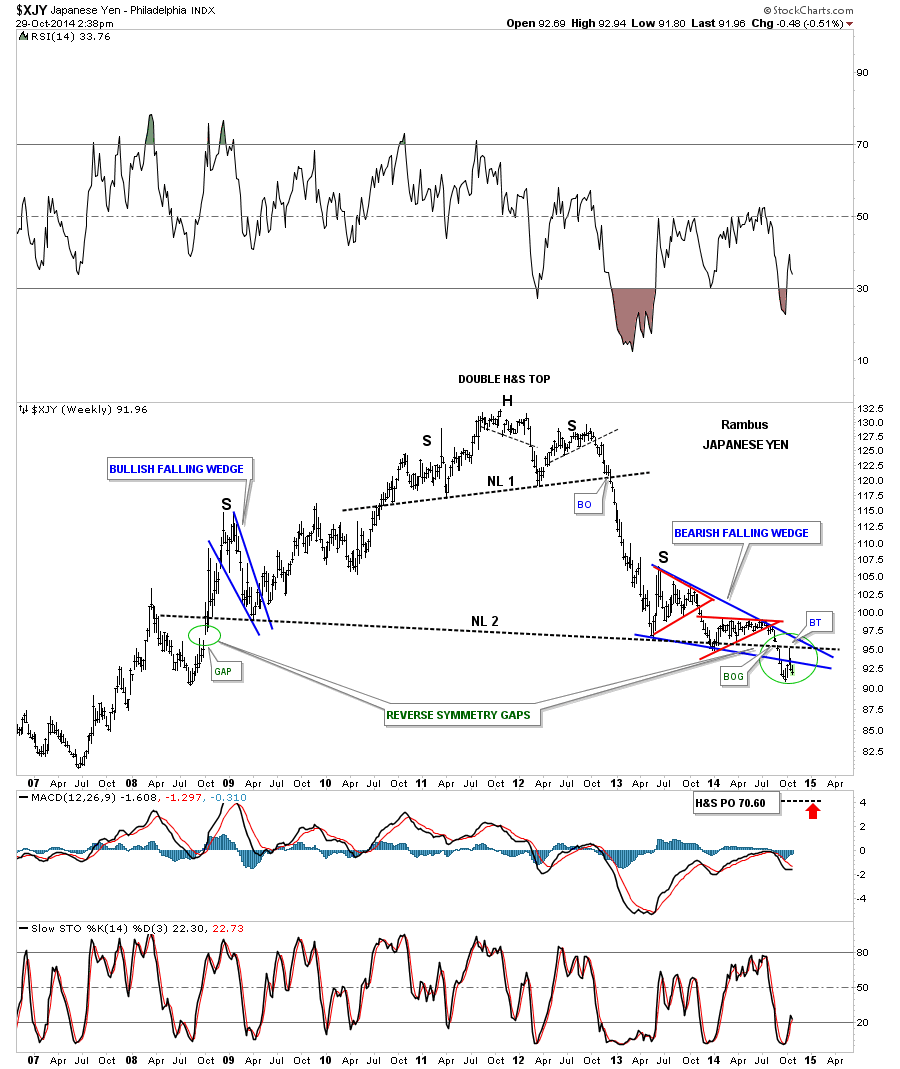
The yen’s massive H&S top.
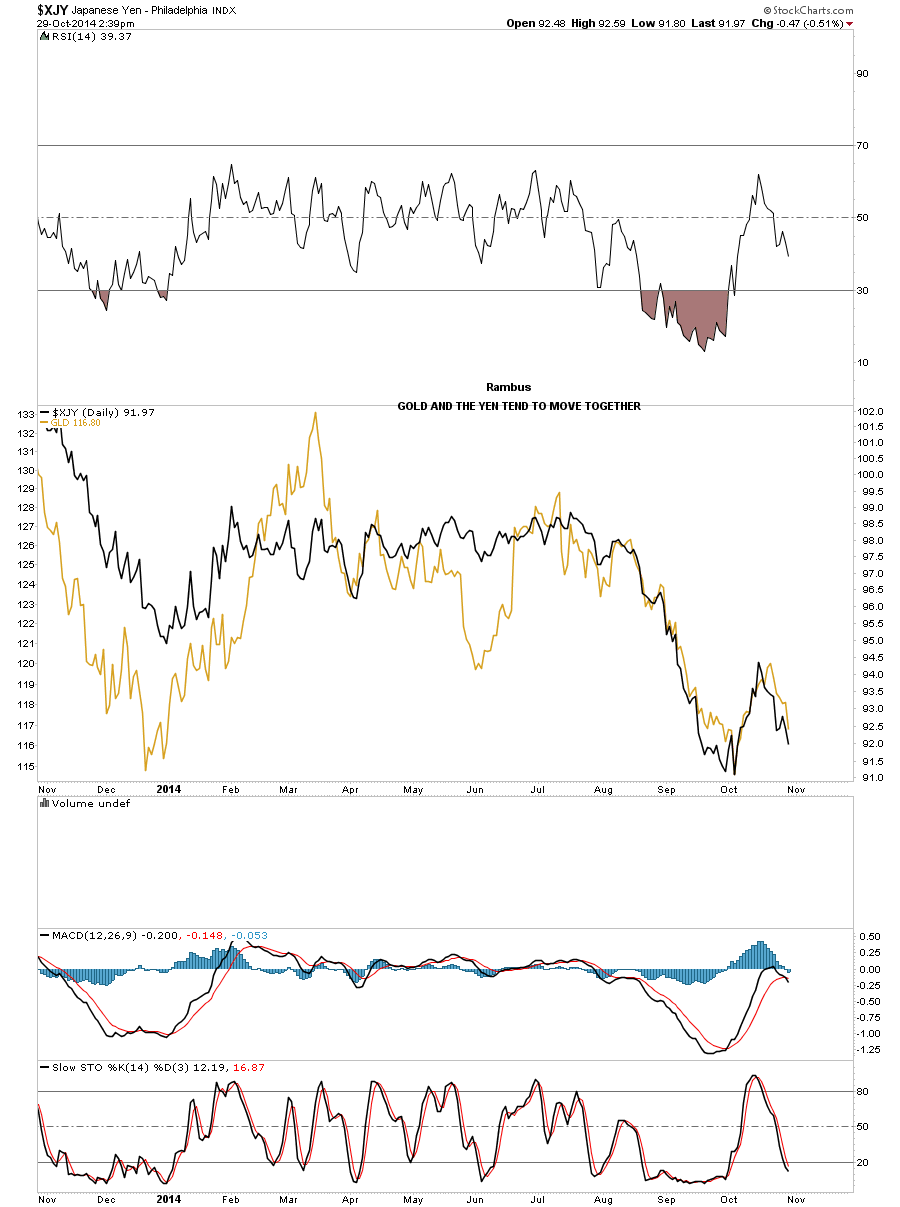
When I overlay gold on top of the yen you can see why the yen is so important to our short precious metals positions.
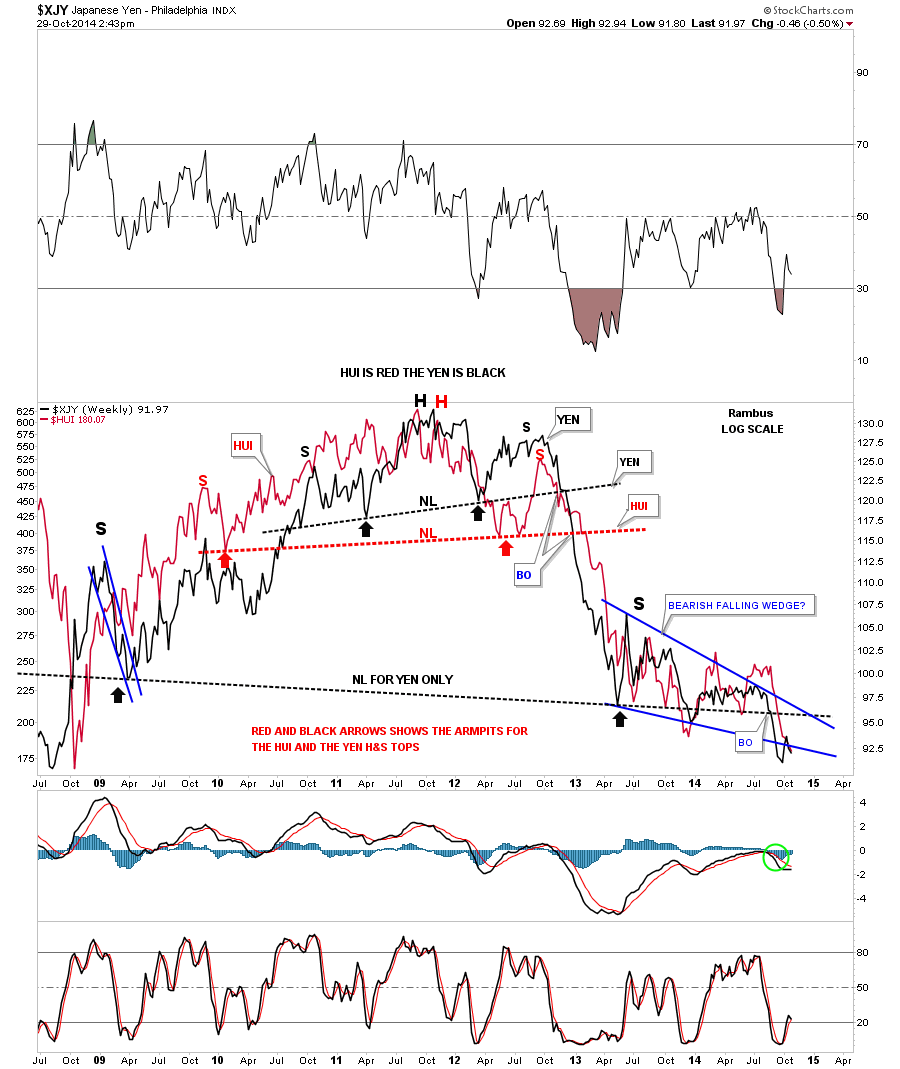
The HUI overlaid on top of the yen.


