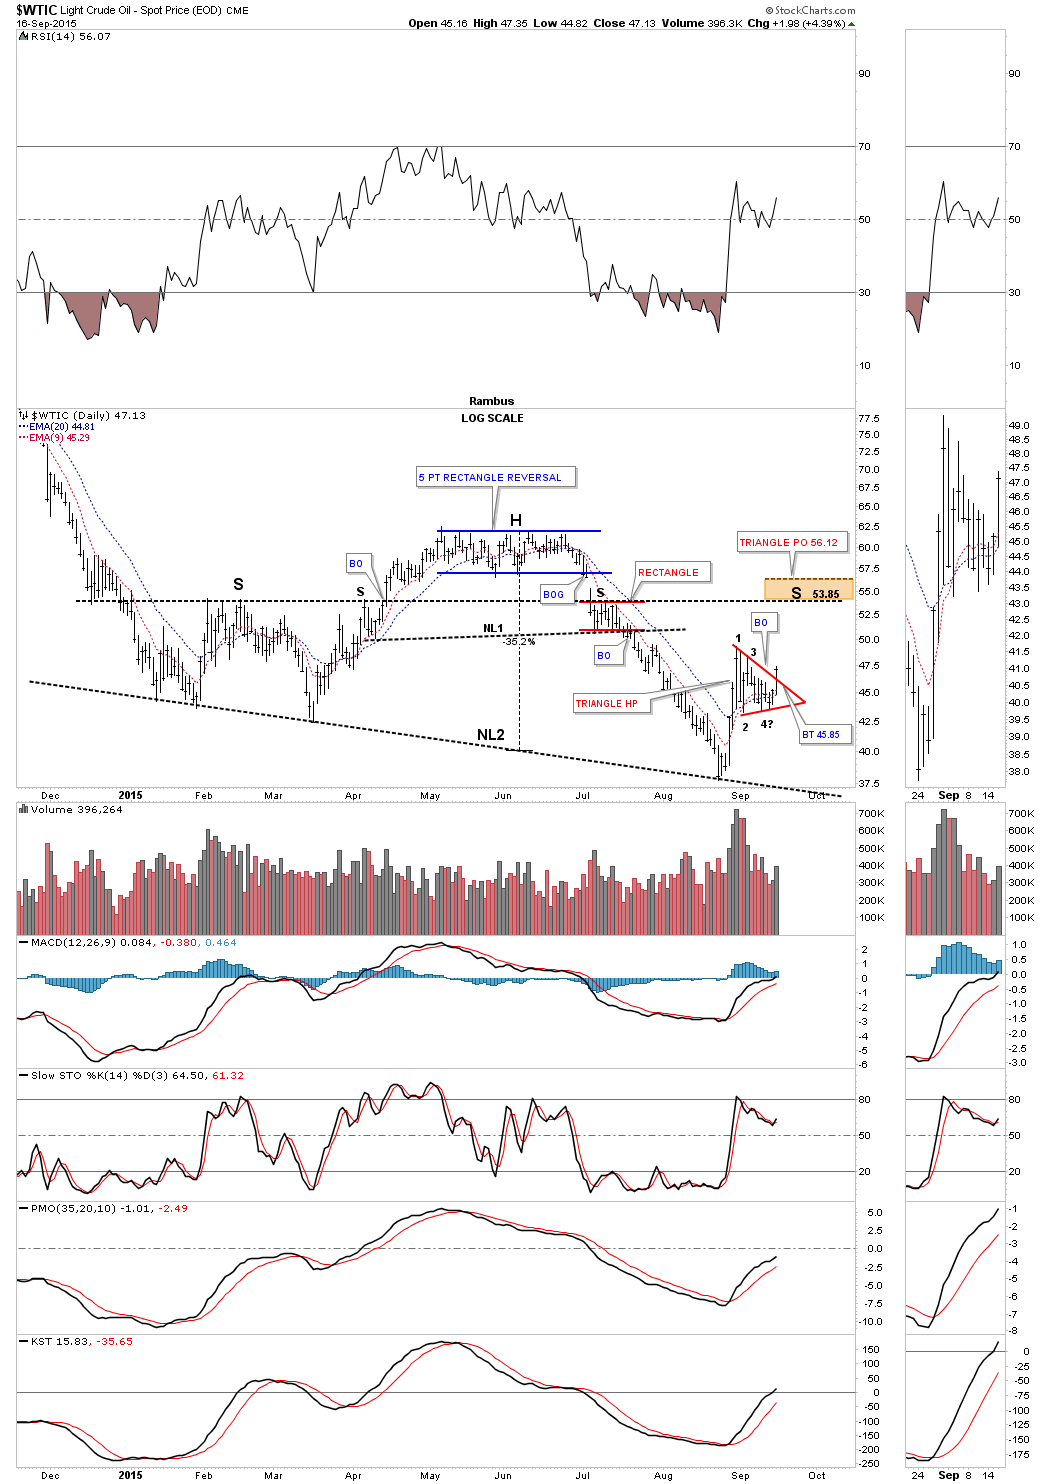
Lets get right to the charts tonight as there is so much happening right now in the markets. The first chart we’ll look at is $WTIC, oil. Today oil finally completed the triangle consolidation pattern I’ve been waiting for. Below is a daily chart for the game plan I laid out several weeks ago in which I was looking for a halfway pattern to form in this general area. This red triangle should give oil enough gas to move up to the brown shaded price objectives between 54 and 56. That’s where the bigger picture comes in. Many times the right shoulder will be of an equal height as the left shoulder as shown by the horizontal black dashed trendline at 53.85. That is what I’m shooting for. The 54 area will also be the place where I will reverse positions, selling UWTI and buying DWTI which is a 3 X short oil etf. As you can see if oil does put in a right shoulder around the 54 area we’ll have a very large H&S consolidation pattern. So far so good.
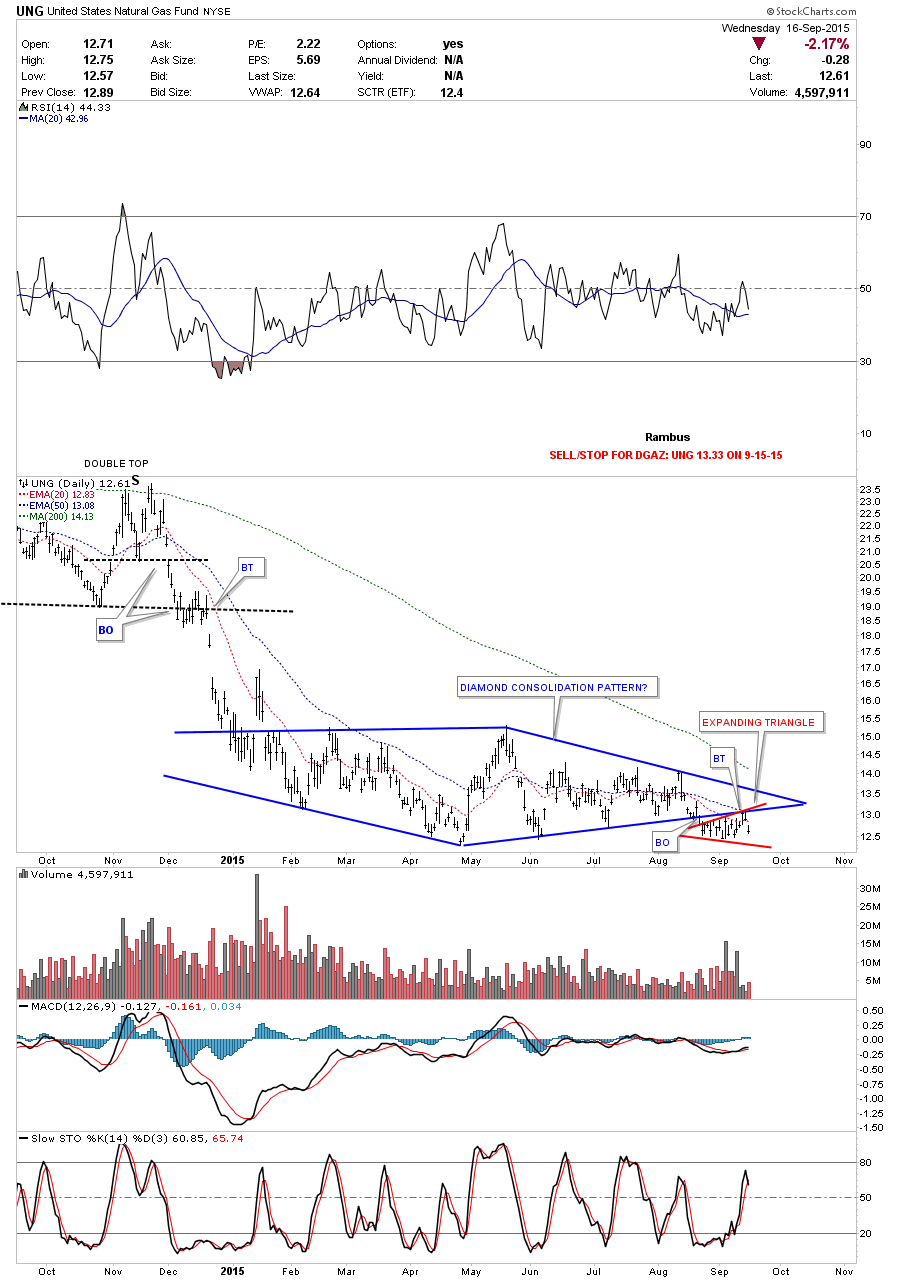
Natural Gas is another 3 X etf we have that backtested the bottom rail of the blue Diamond yesterday where we took our third position in DGAZ. I’m using UNG as the proxy for Natural Gas. UNG does have a bearish setup with the red expanding triangle forming just below the bottom rail of the blue Diamond. I plan to take a fourth and final position when the bottom rail of the red expanding triangle is broken to the downside. I’m using UNG to set my sell/stop for DGAZ at 13.33.
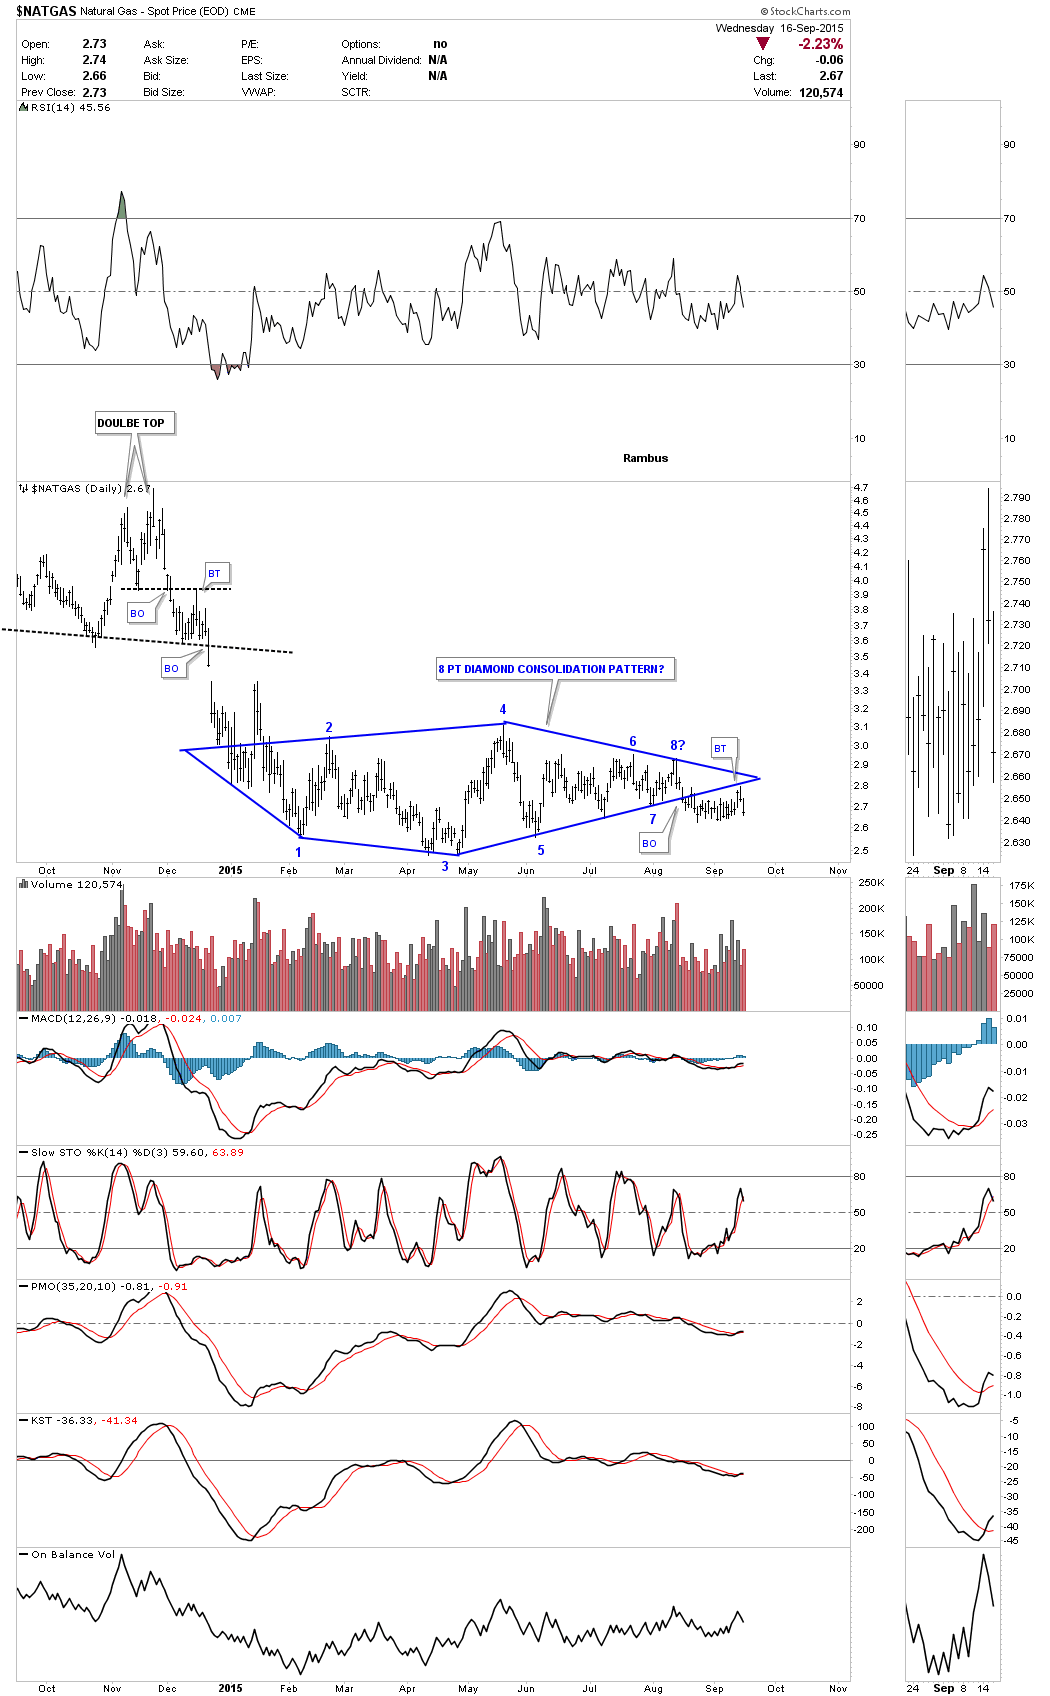
The $NATGAS spot price chart also shows a blue Diamond consolidation pattern with a backtest yesterday to the bottom rail.
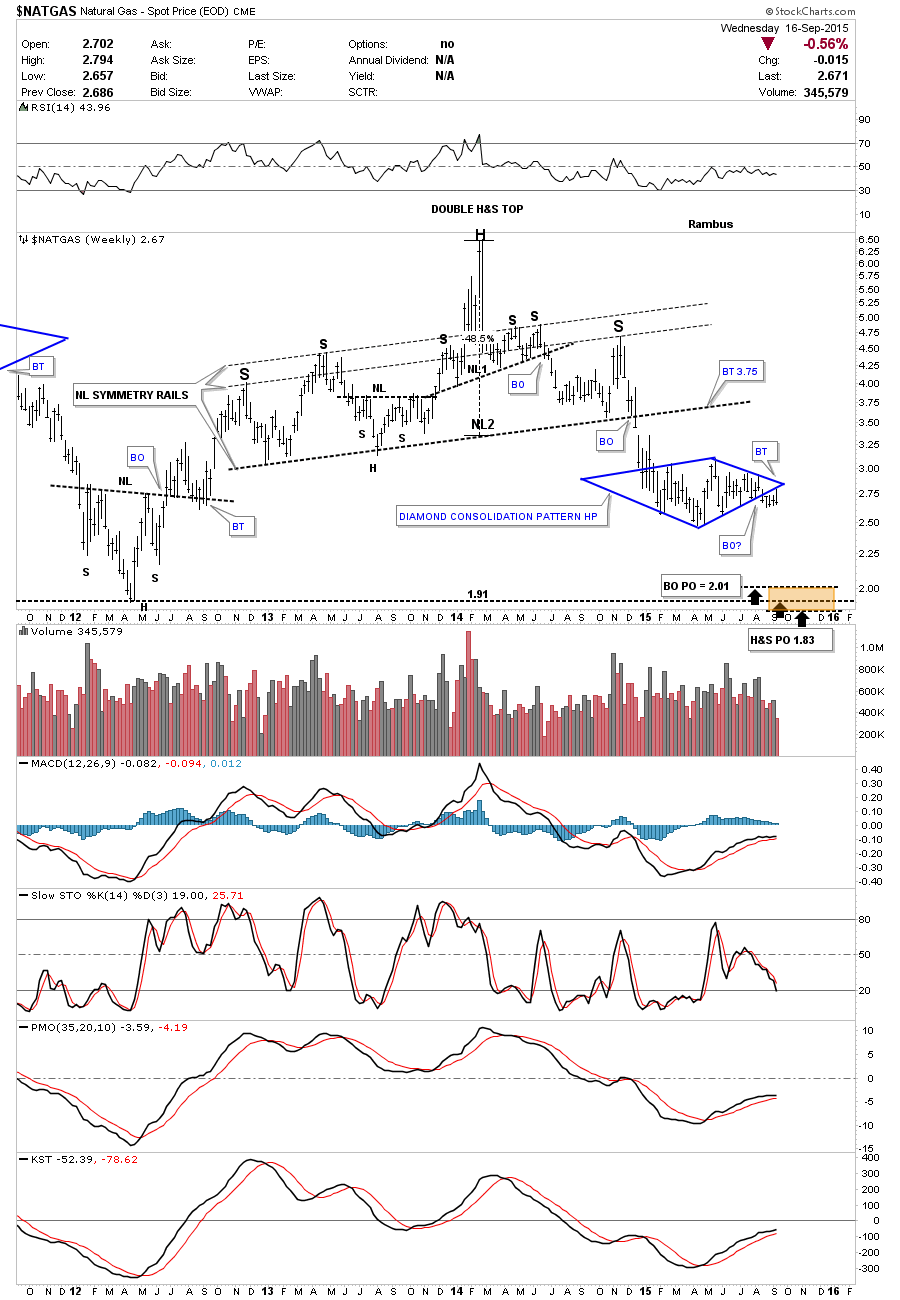
The weekly chart for $NATGAS shows its massive H&S top which is the main reason I’ve been hanging on to our DGAZ trades. You can see how the blue Diamond consolidation pattern is forming right in the middle of the lower price objectives. You never know 100% for sure if the backtesting process is finished but it does look like it on this weekly chart. We need to see a new weekly closing price for more confirmation the pattern is complete.
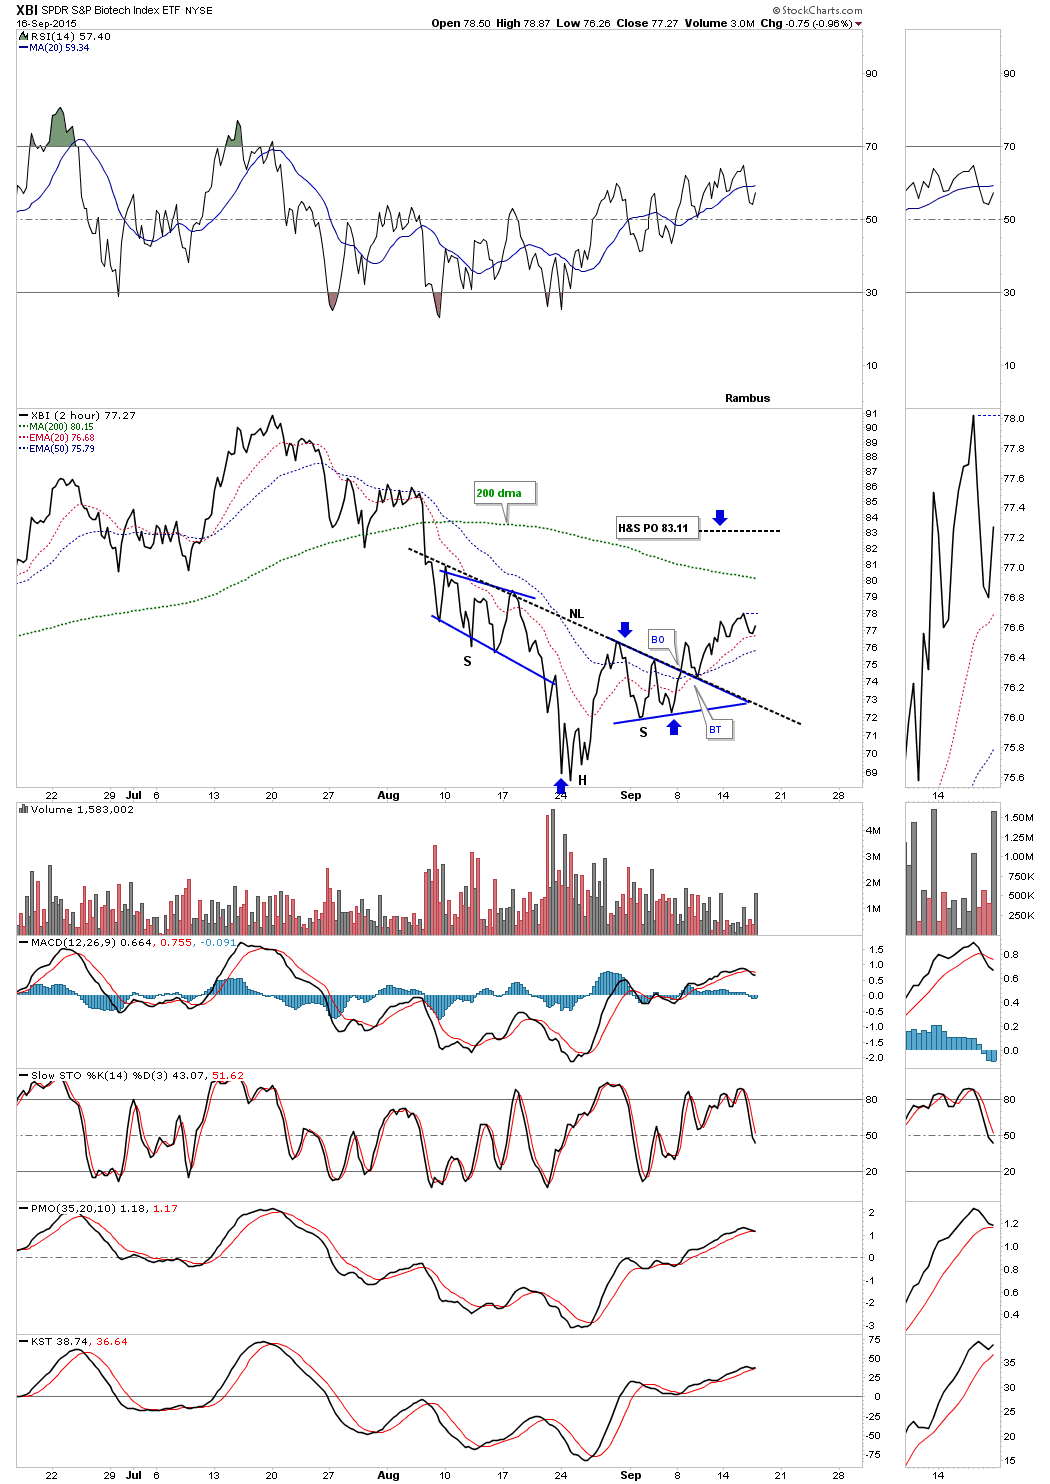
We have several positions, long the biotech sector, using LABU, which is a 3 X long etf. The 2 hour line chart below shows an inverse H&S bottom that has broken out above the neckline.
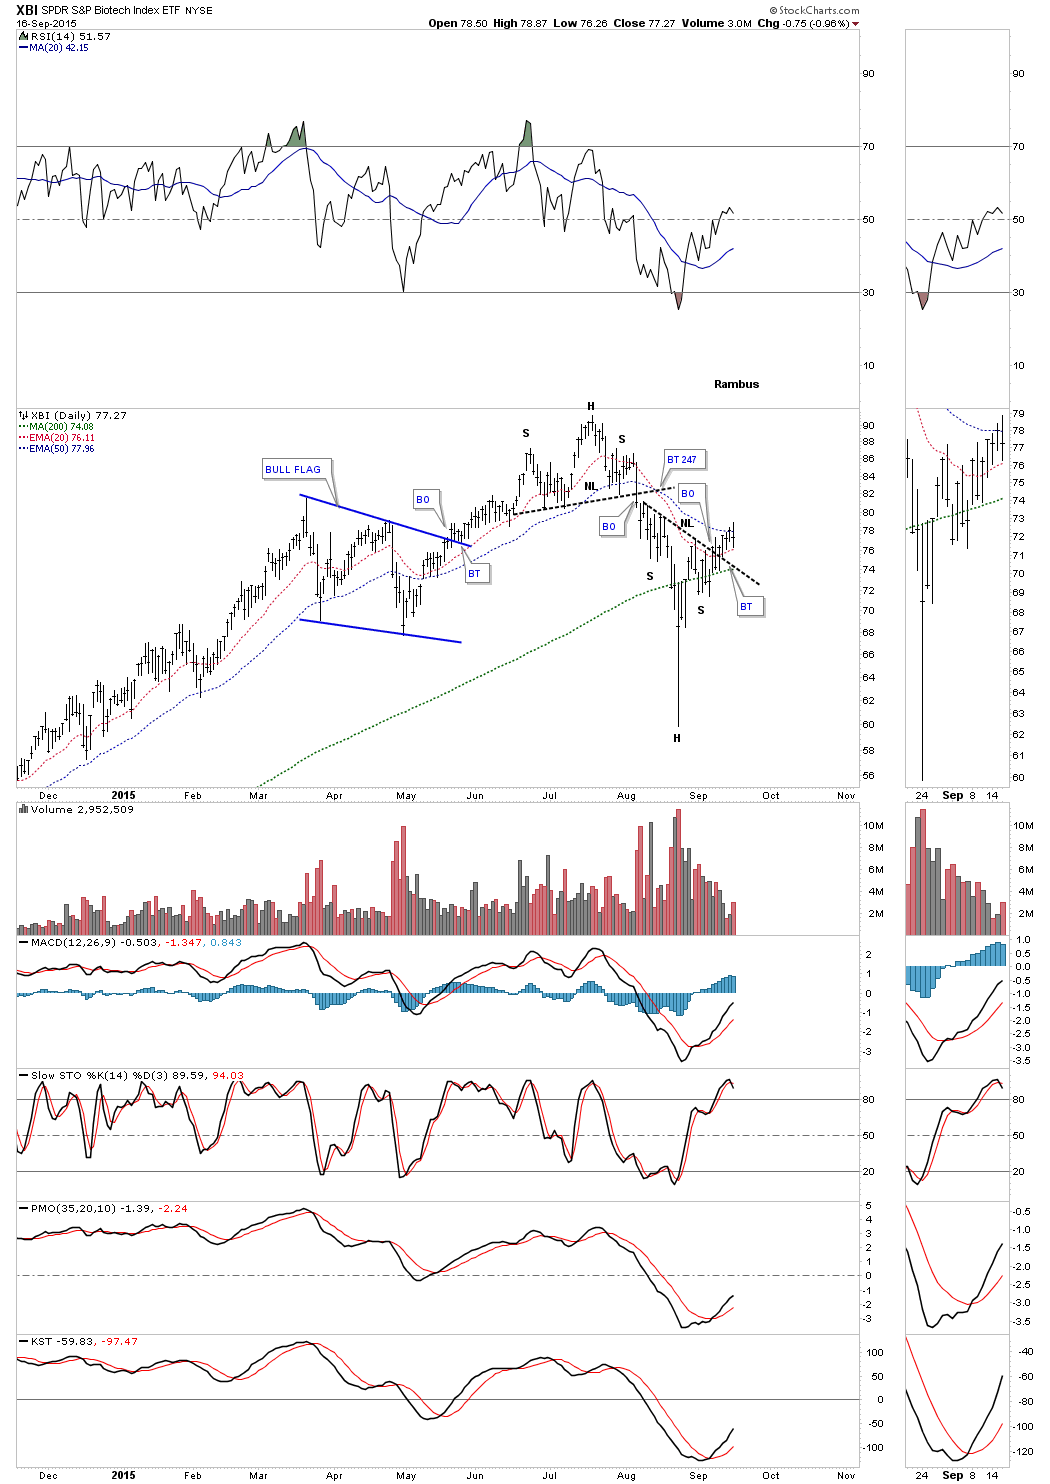
The daily chart for the XBI shows a strongly slanted inverse H&S bottom in place. We could still see a backtest to the neckline and the 200 dma at around the 74.08 area.
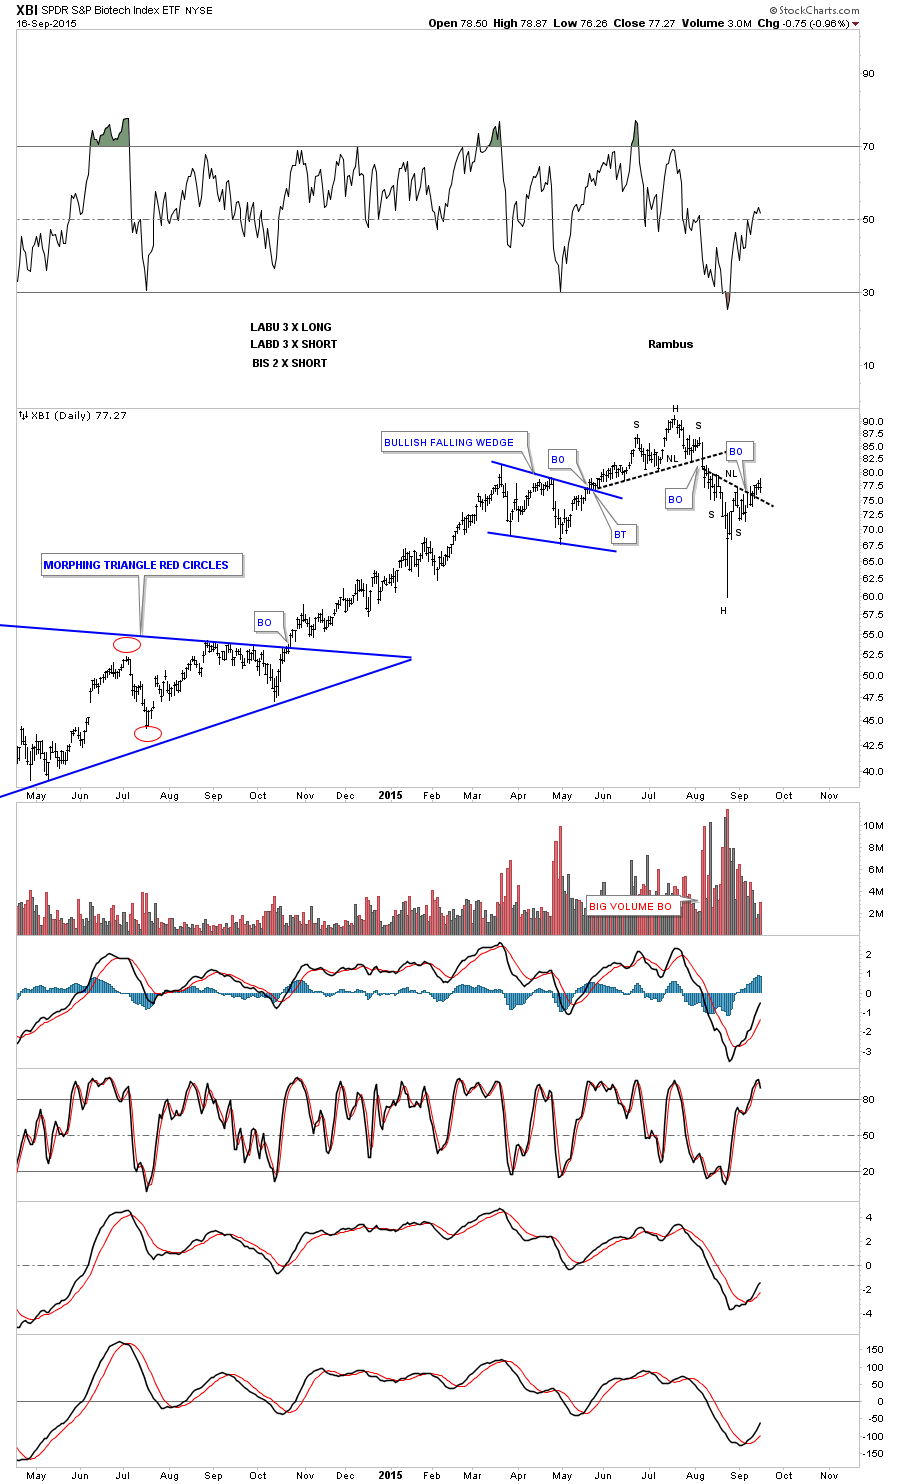
Next is a long term daily chart which shows the H&S top which led to the recent decline. Now we have an inverse H&S bottom which should reverse the short downtrend. The neckline is our line in the sand, above positive and below negative.
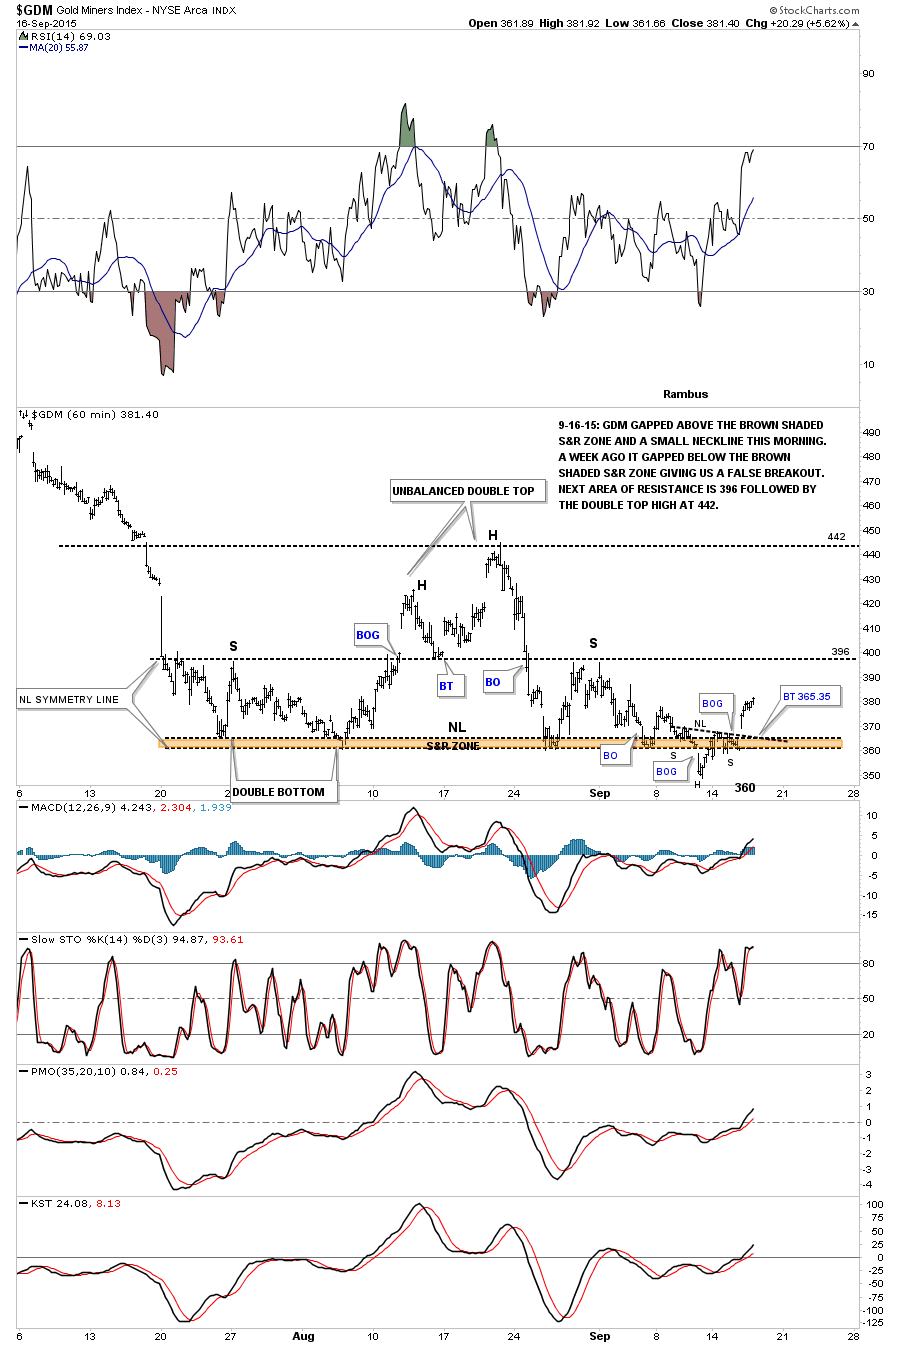
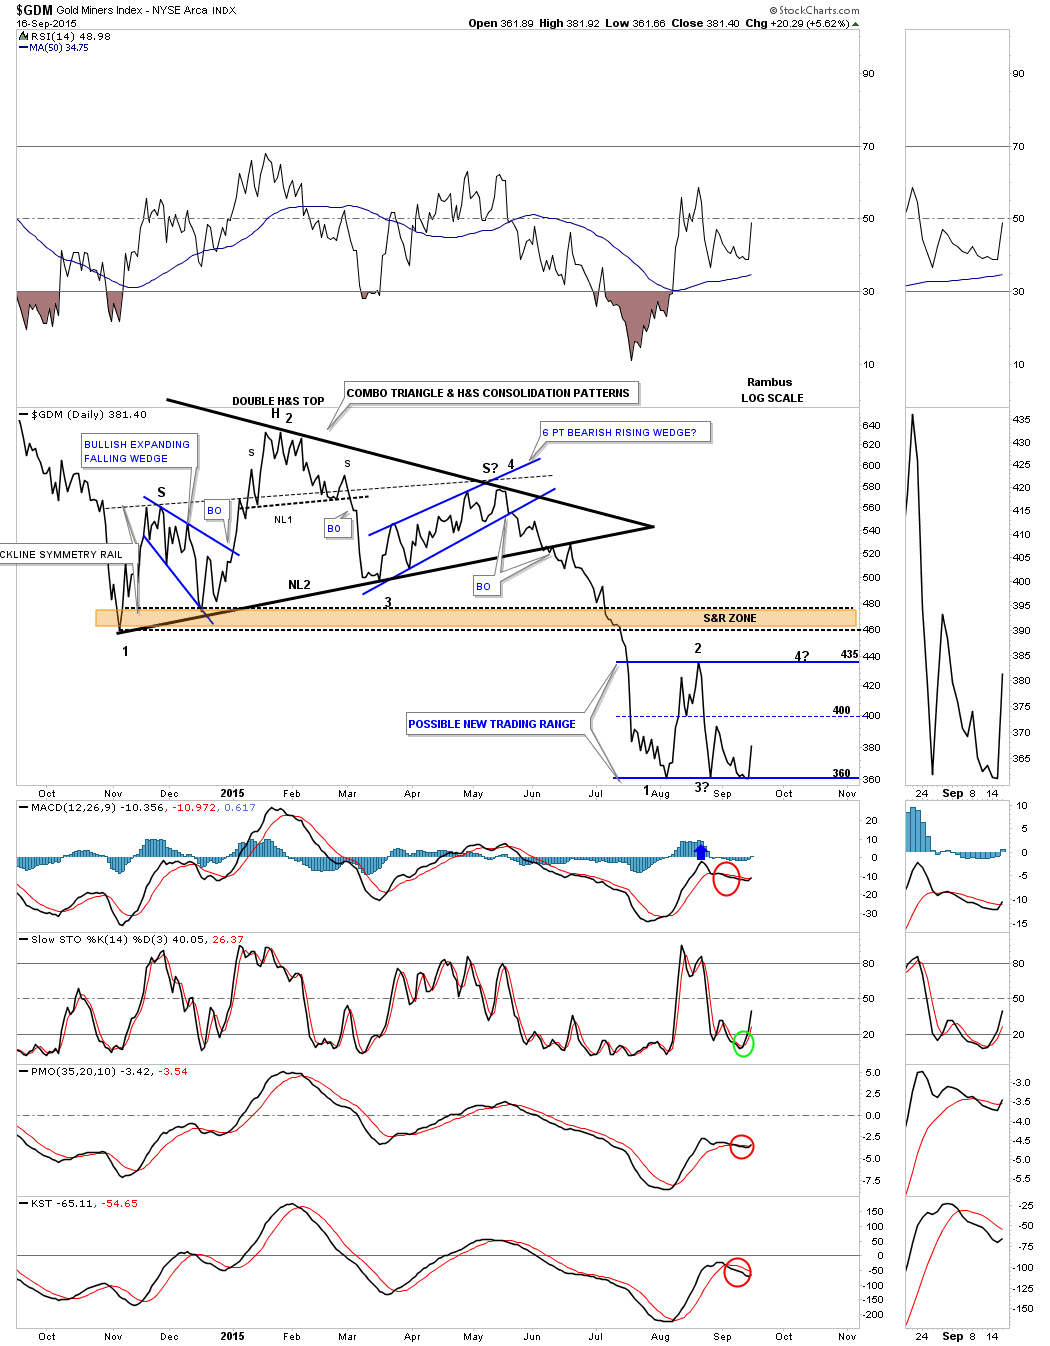
Lets now look at the 60 minute bar chart we’ve been following for the GDM which shows the gap up this morning above the brown shaded S&R zone and now we can see a small H&S bottom neckline was also gapped at the same time. This is the reason I exited our Kamikaze positions this morning. The top of the brown shaded S&R zone was our line in the sand, below positive because we were short and above negative.
With the bounce off of the bottom rail this morning I now have to respect the fact that we maybe forming a sideways trading range with the bottom at 360 and the top at 435. If that is the case then the GDM is starting its 3rd reversal point to the upside which won’t be complete until we find where the possible fourth reversal point begins.
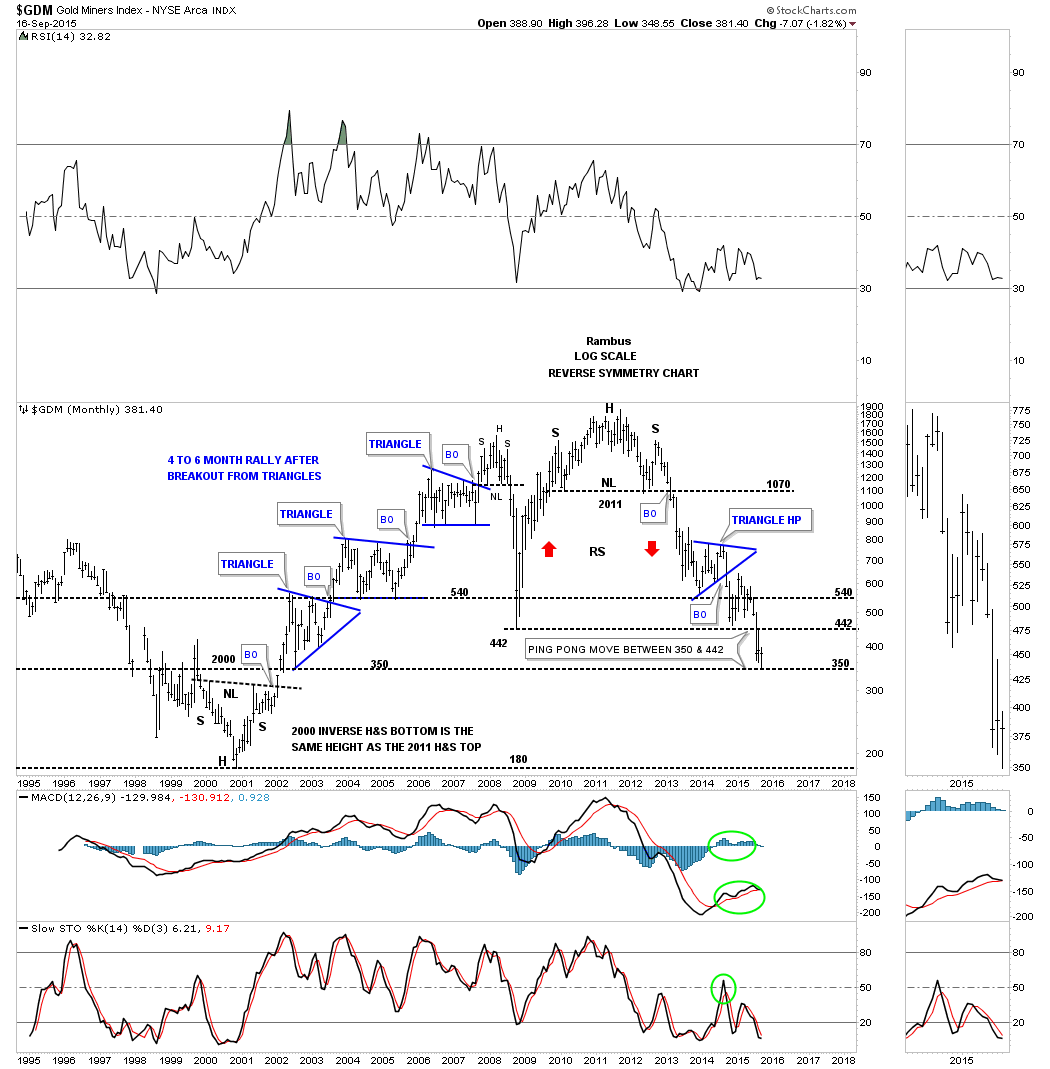
Below is a long term monthly chart which is showing us a possible ping pong move between support at 350 and resistance at the previous low around the 442 area. That would tie into the possible horizontal trading range we looked at earlier.
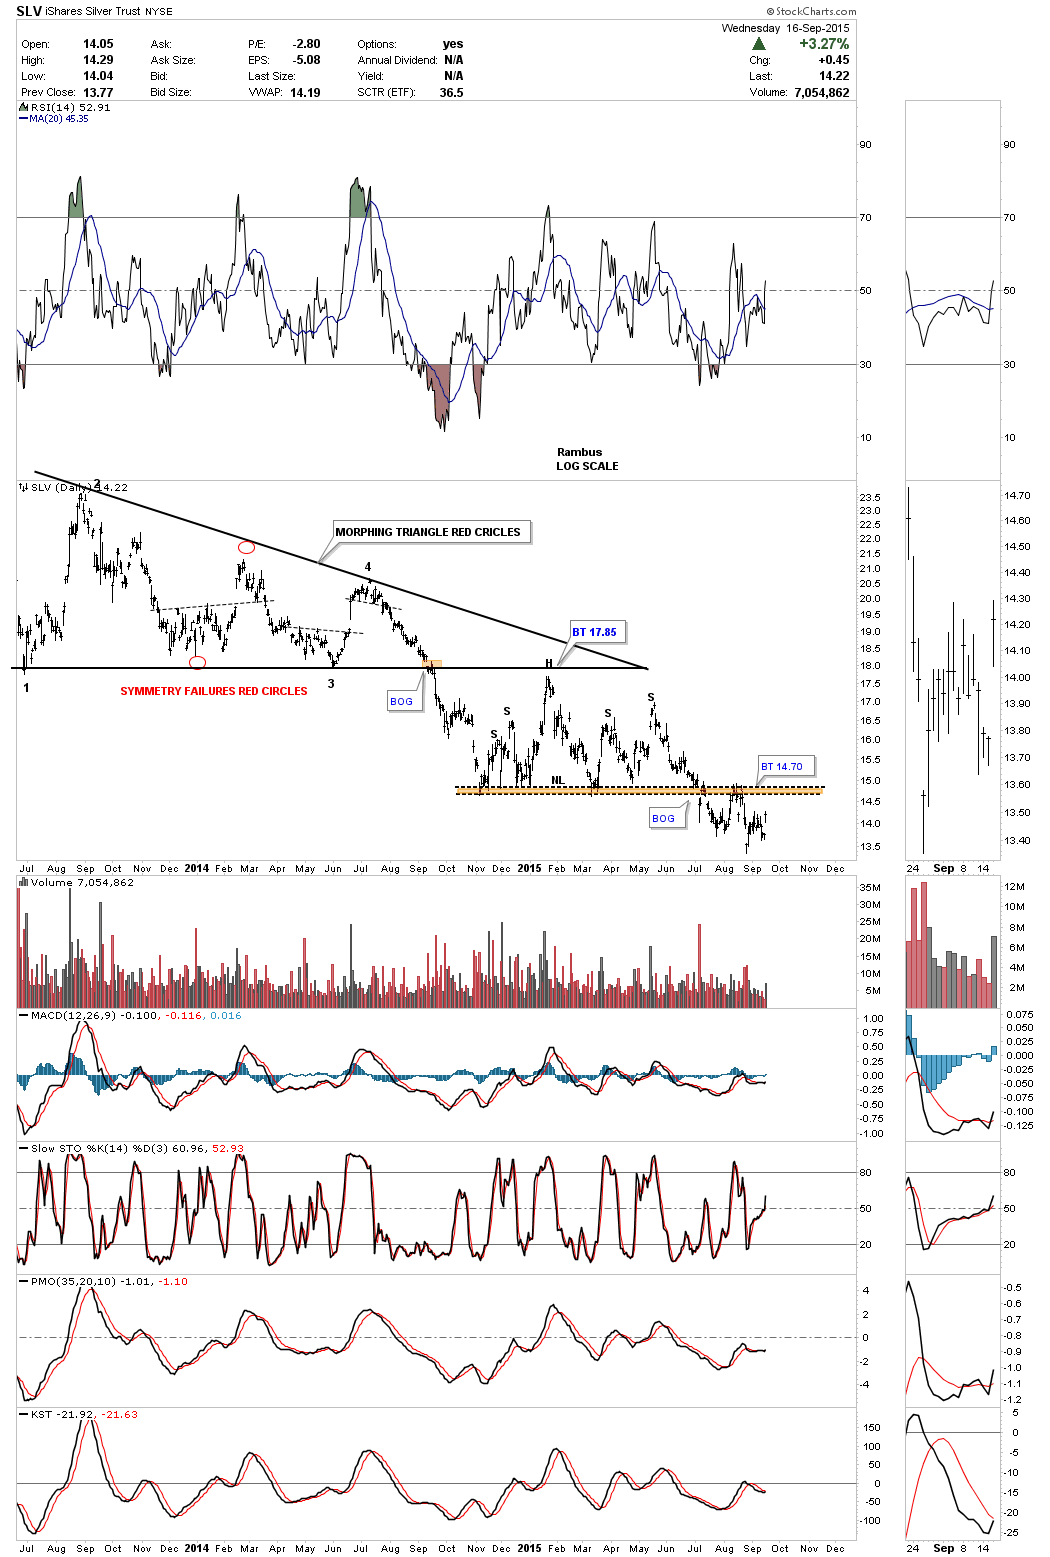
The long term daily chart for SLV shows the brown shaded S&R zone / neckline coming in at 14.70 which has held resistance several times so far.
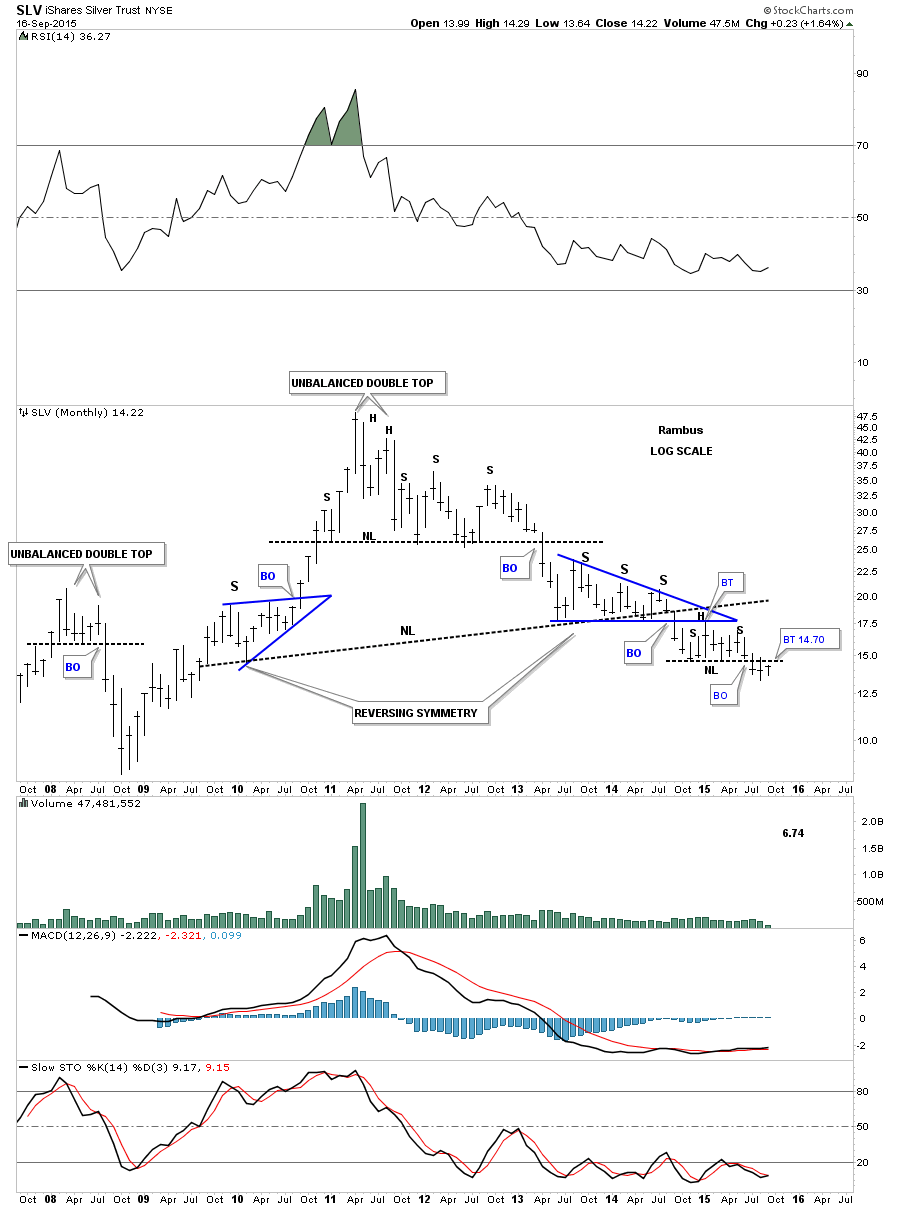
The long term monthly chart for SLV shows you how important the neckline at 14.70 is. We are now in our third month of breaking out and backtesting the neckline at 14.70.
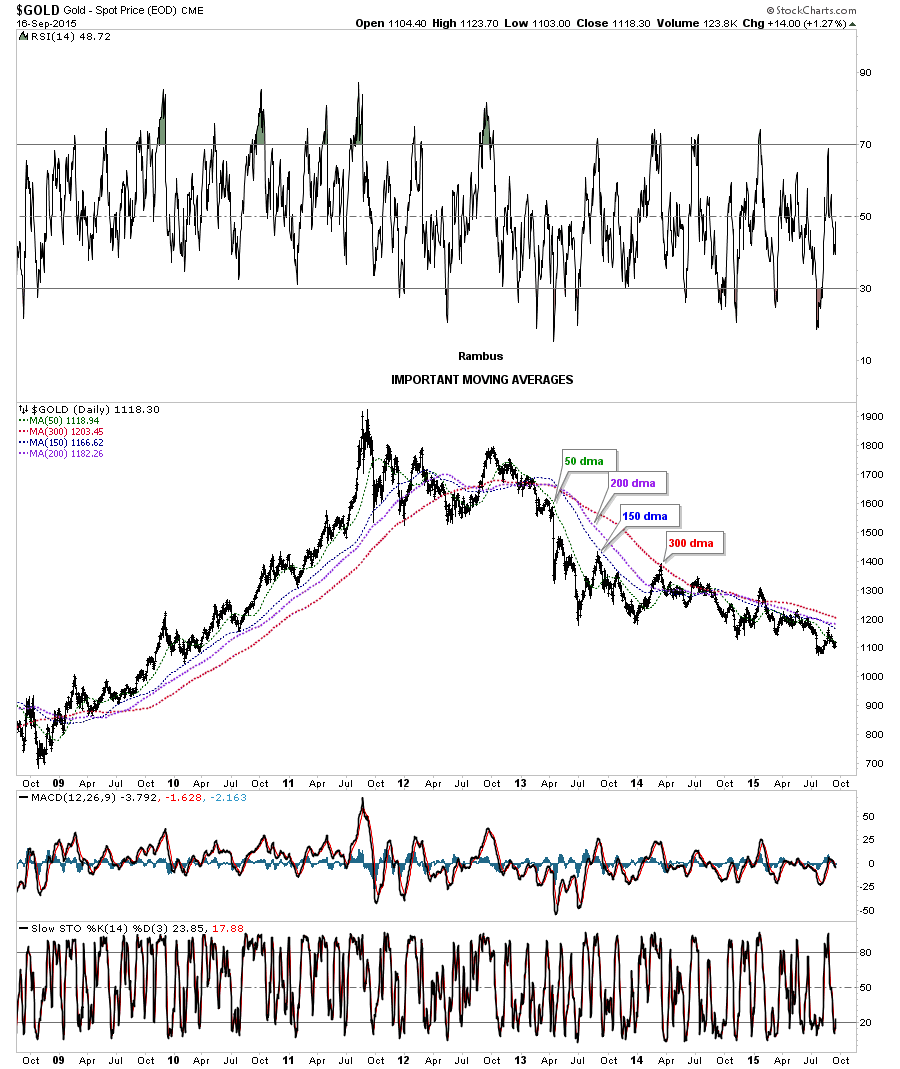
Next we’ll look at daily chart for Gold which shows all the important moving averages. Today Gold tested the 50 dma with the other 3 just overhead.
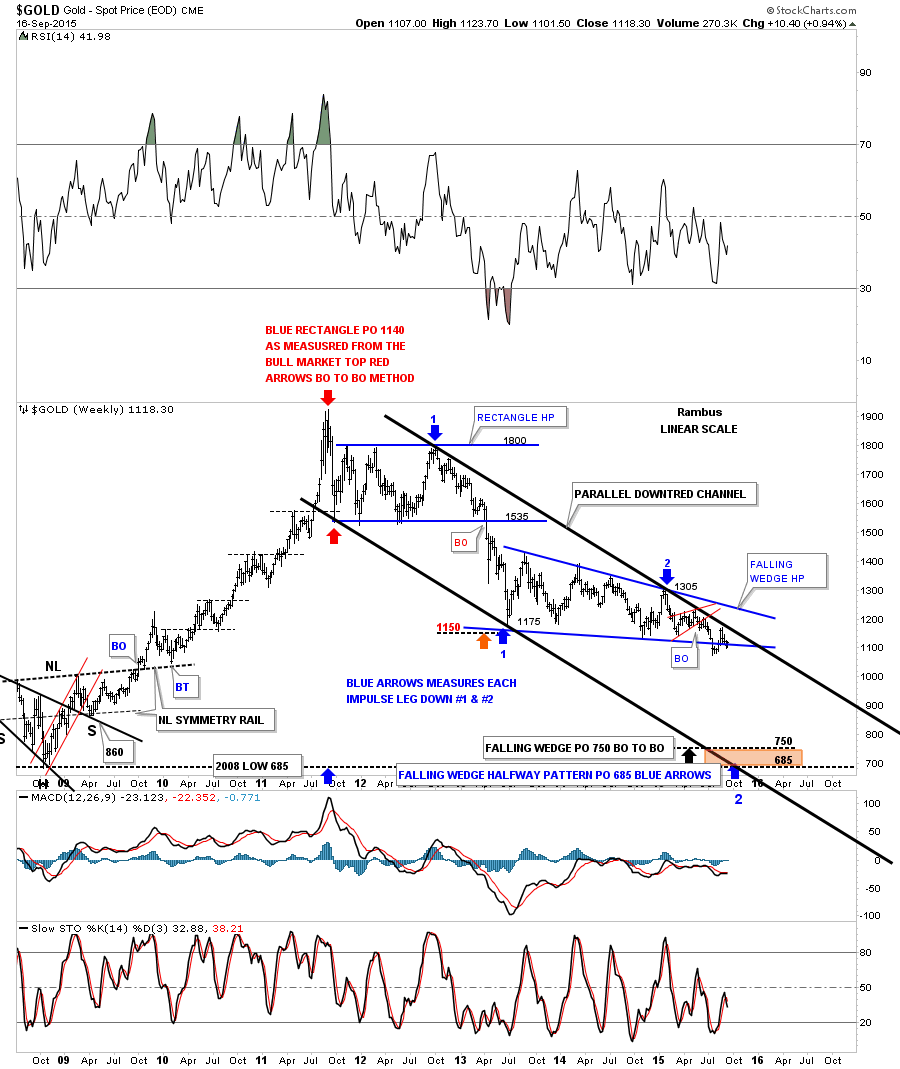
The next chart for Gold is a weekly look that shows the downtrend channel that has been in force since the bull market top. The top rail of the parallel downtrend channel was just recently touched about three weeks ago. The 65 week moving average now comes in at 12.07.
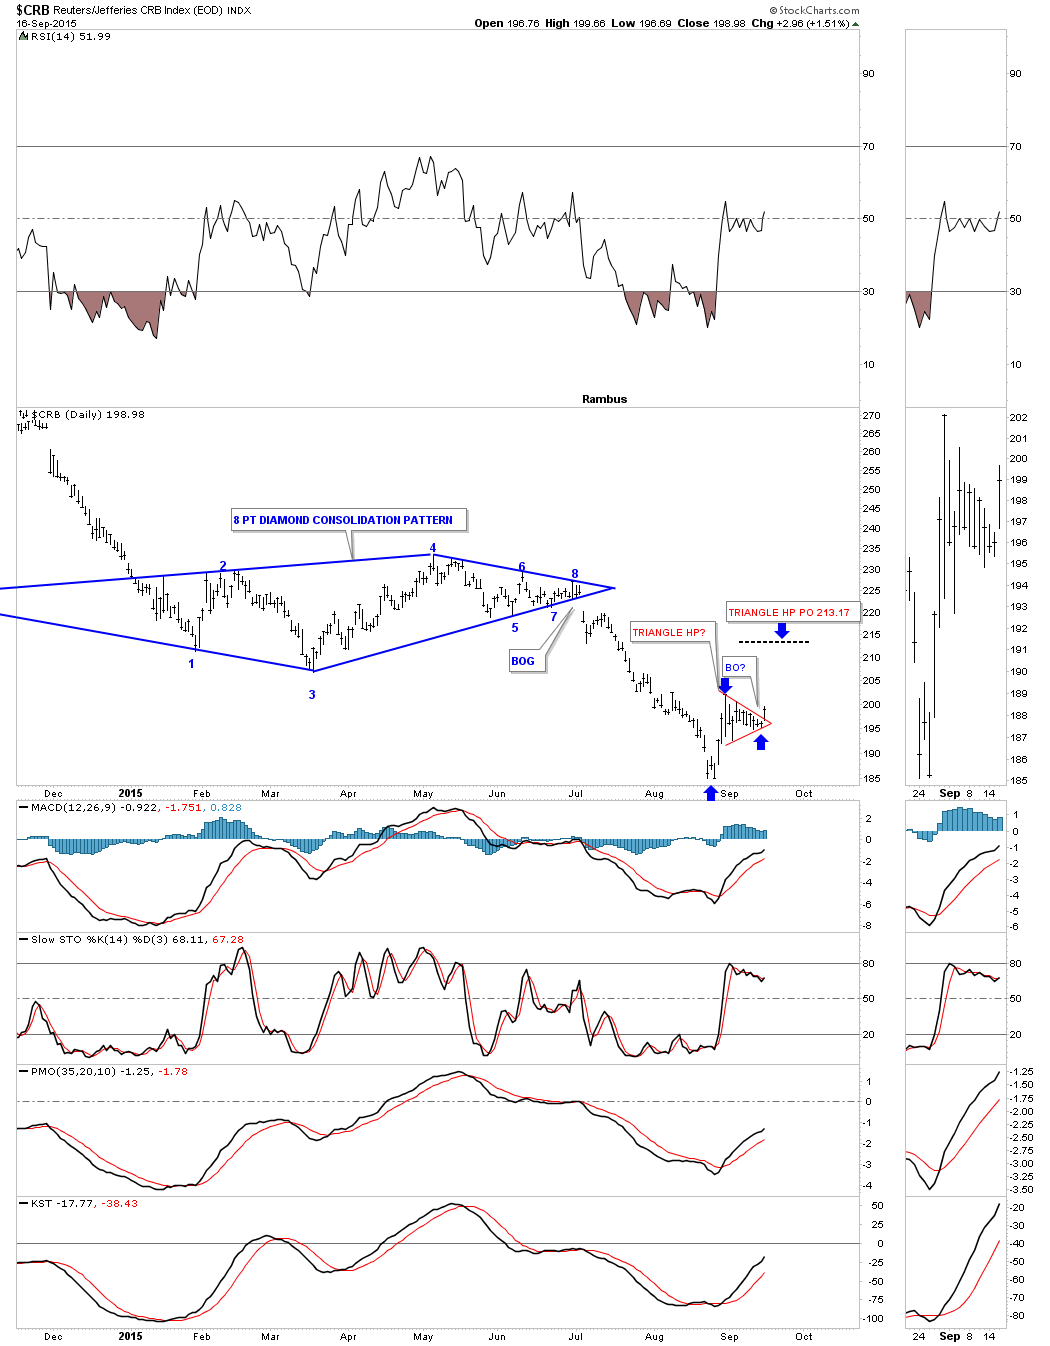
If the CRB index is showing us anything the little red triangle that broke out today maybe showing us a halfway pattern to 213 or so as shown by the blue arrows.
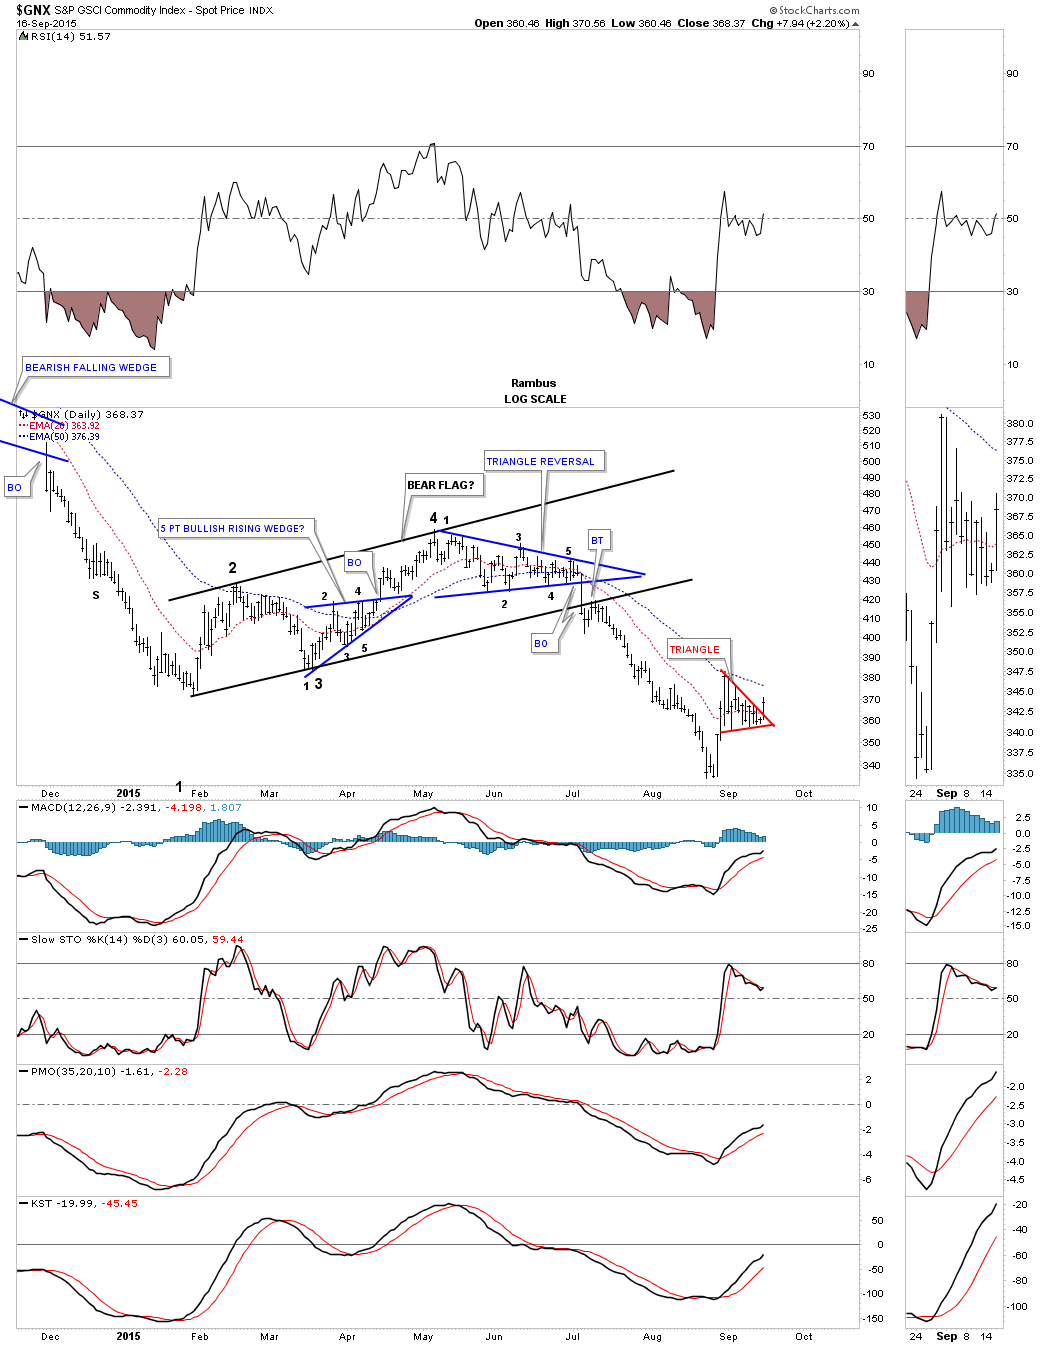
The daily chart for the $GNX, which is another commodities etf, shows the same small red triangle as the CRB.
Lets look at one last commodities index the DBC which trades with alot of volume. It to is showing us a small red triangle that I’m viewing as a halfway pattern to the upside right now.
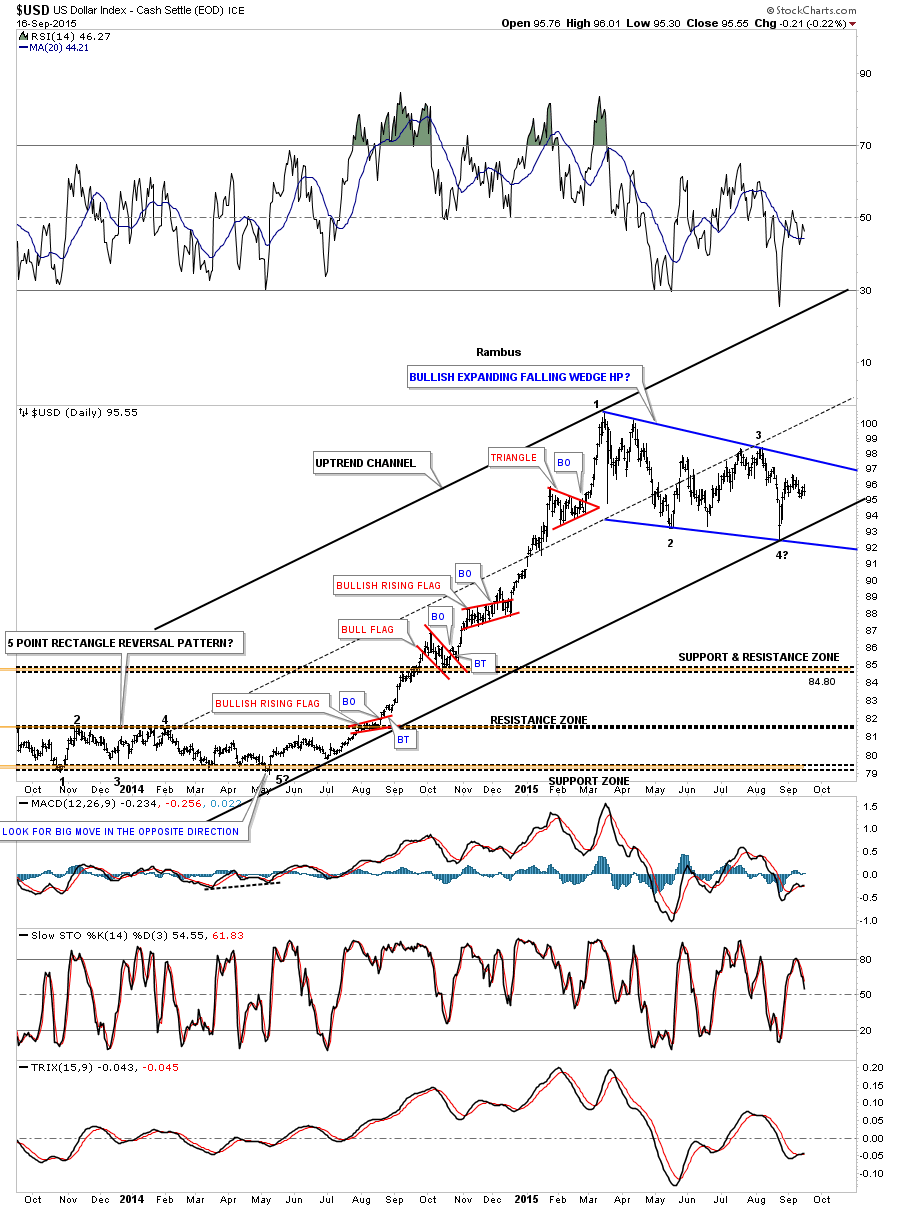
Lets finish up by looking at the US dollar for some clues on what might be happening. This daily chart shows the big impulse move up accompanied by all the small red consolidation patterns. After finally running out of gas earlier this year the US dollar has been chopping out a sideways trading range which looks like a bullish falling wedge at this point in time. As you can see the US dollar has completed 3 reversal points so far with the fourth one in progress.
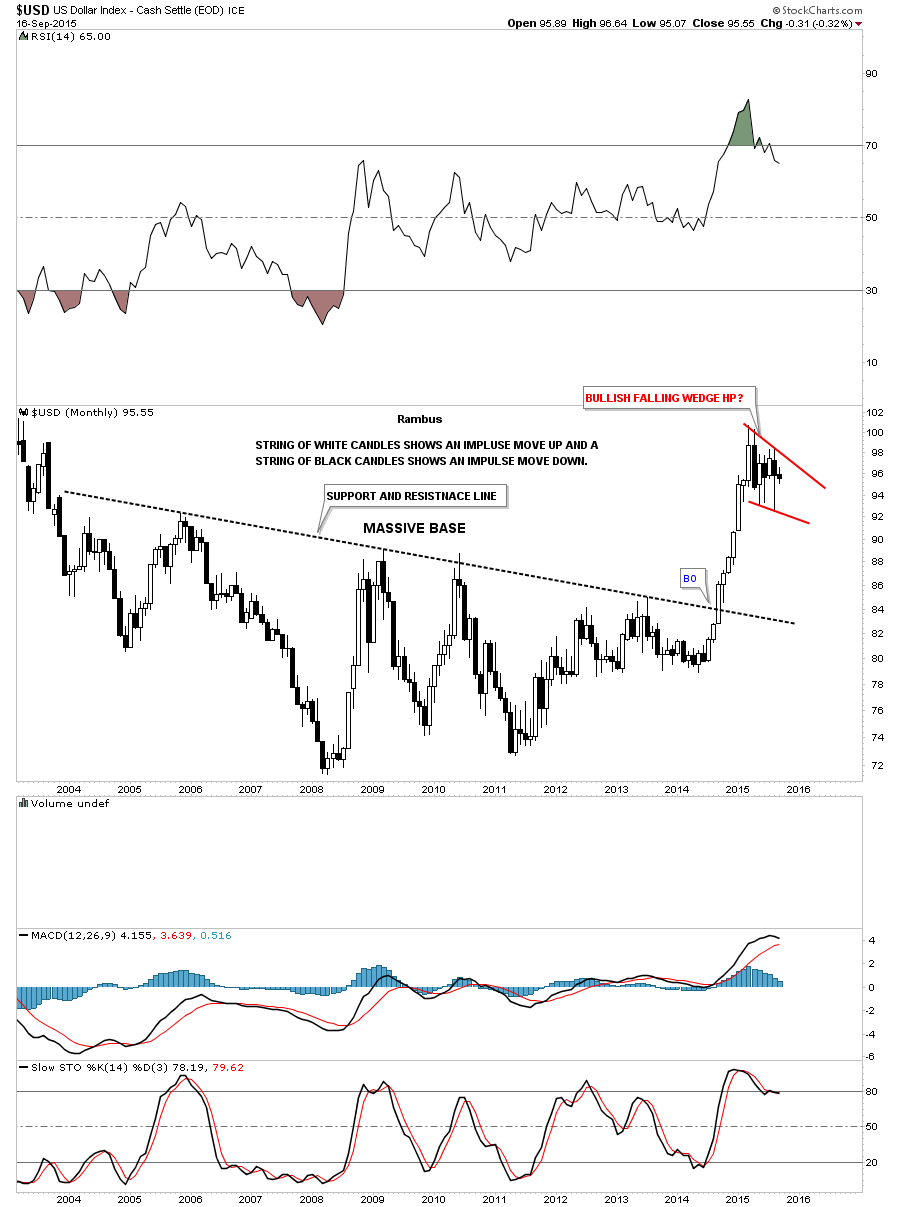
The long term monthly chart for the US dollar shows you some classic Chartology. Note the massive base that formed over 10 years. Note the string of white candles that formed the impulse move up. With such a big base it stands to reason that the US dollar would be forming a halfway pattern in this general area. It’s just consolidating that massive rise out of that big base.
Depending on how tomorrow goes I have many more charts to show you on the stock markets. I’m going to wait until after the fed announcement tomorrow before I take a position in the stock markets. Tomorrow should be interesting as usual on the fed announcement days. I hope this posts. All the best…Rambus

