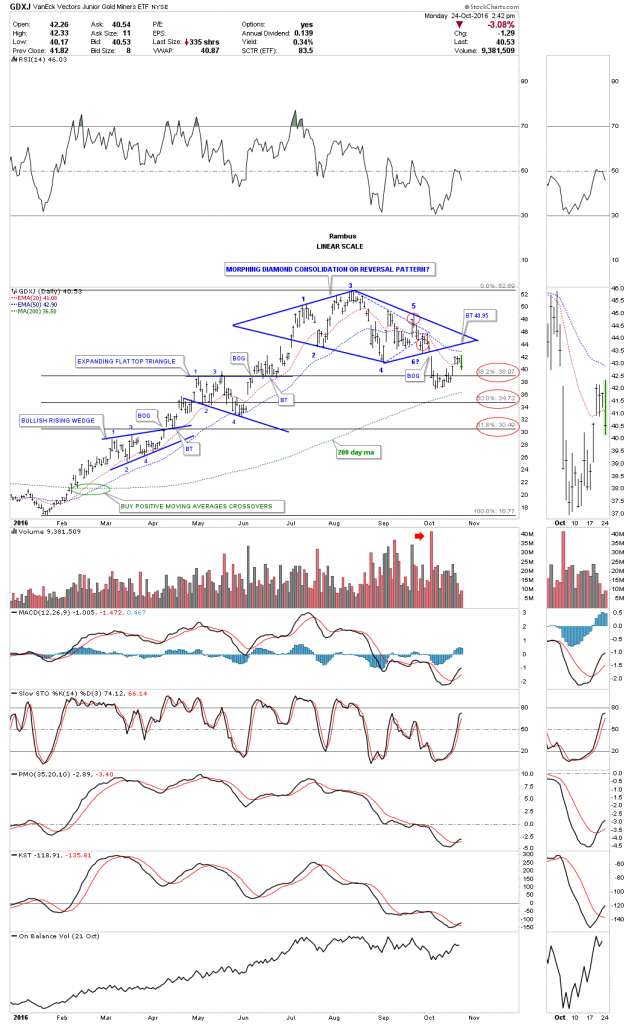
Back in September we looked at a possible morphing Diamond on the GDXJ in which the dashed trendlines were showing the original Diamond. When it started to morph into the bigger Diamond I added the two red circles that showed the false breakouts from the original dashed Diamond. As you can see the last two weeks produced a rally that so far has failed below the apex of the morphing Diamond. From a Chartology perspective the Diamond is a reversal pattern as it has five reversal points.
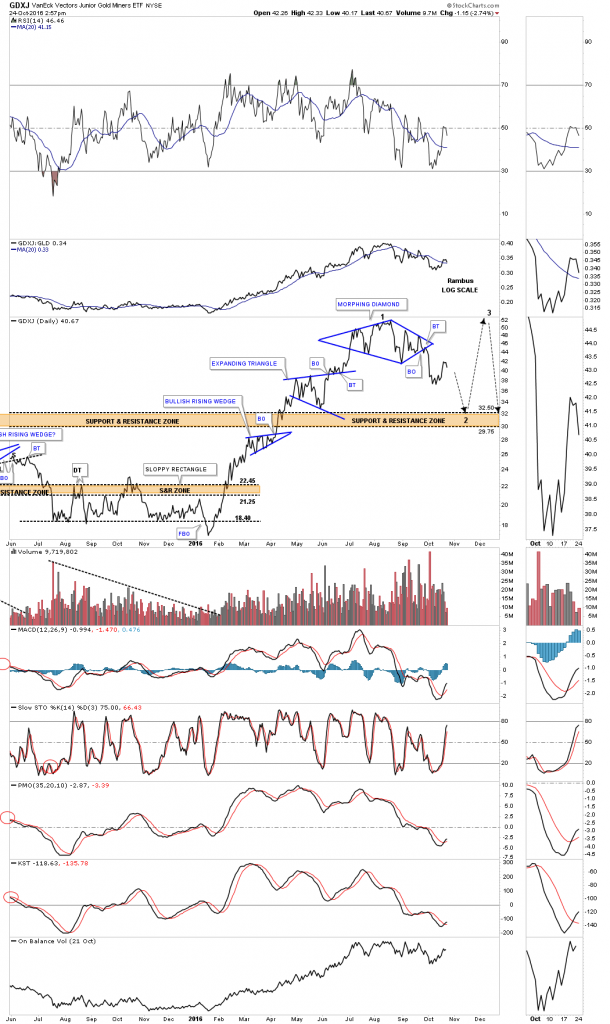
Below is a longer term daily line chart for the GDXJ which shows how it is situated at the top of the big impulse move up out of the January low. The brown shaded support and resistance zone comes in between 29.75 and 32.50. It may be possible that the Diamond could be the reversal pattern at the first reversal point in a much bigger consolidation pattern.
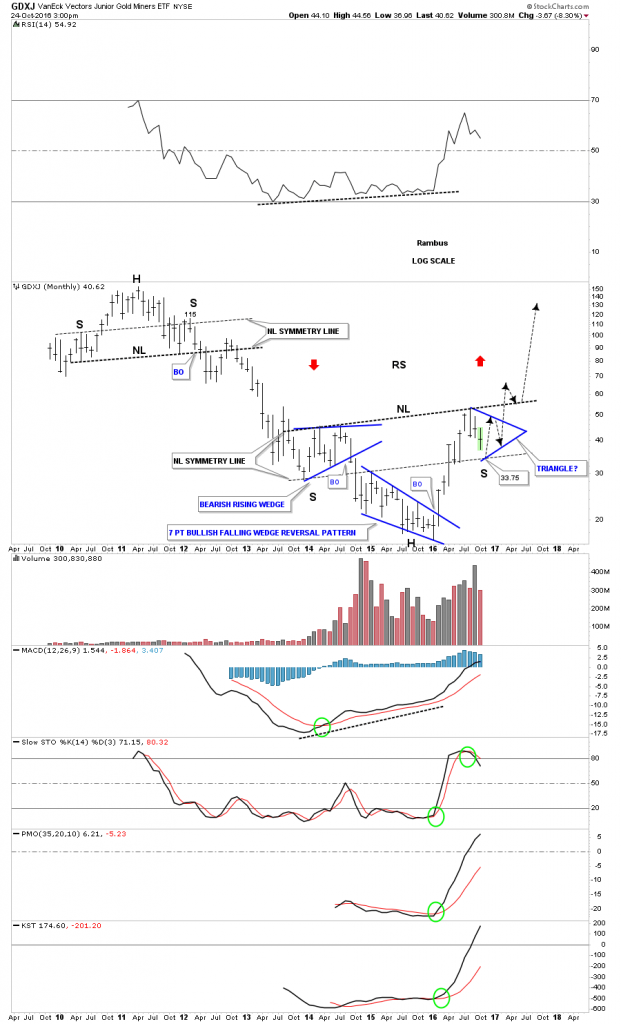
In the very big picture the neckline symmetry line comes in around the 33.75 area on the long term monthly chart, which would be in the ball park of the brown shaded support and resistance zone. Symmetry suggests the right shoulder still needs a lot more work compared to the left shoulder.
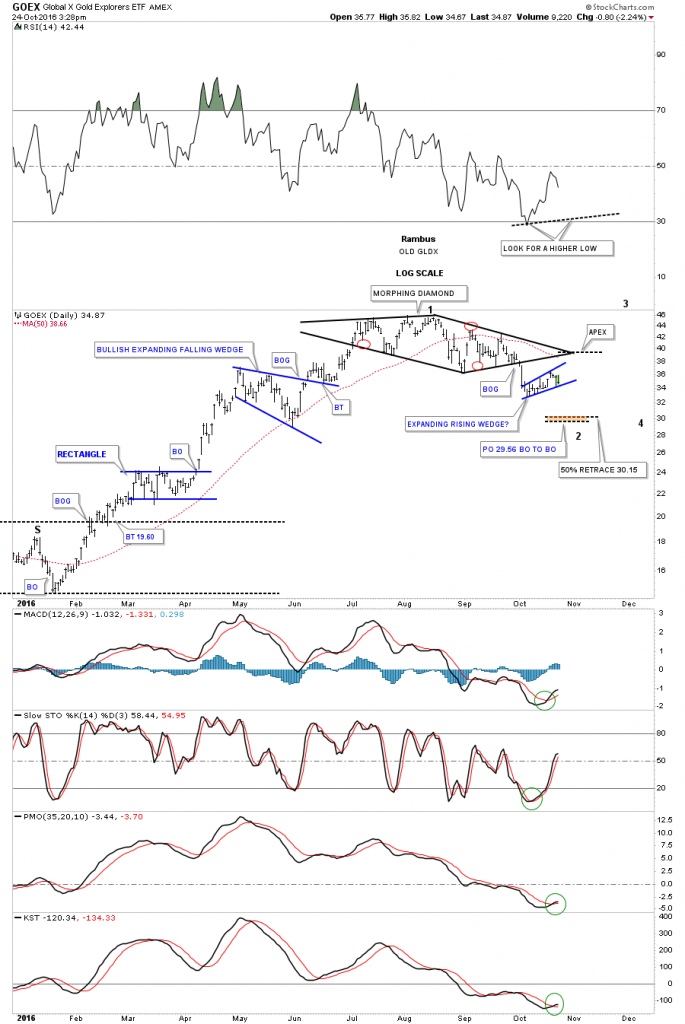
Below is a daily chart for the GOEX, which is the old GLDX gold explores etf, which shows a Diamond reversal pattern in place with a small expanding rising wedge forming as a possible halfway pattern. The price objective for the expanding rising wedge comes in around the 29.56 area. The 50% retrace of the first impulse leg is at 30.15.
As you can see the indicators below the chart all have a positive cross. If the expanding falling wedge plays out to the downside it would be nice to see a positive divergence on the RSI at the top of the chart.
The breakout below the bottom rail of the Diamond consolidation pattern only took about four days or so to reach the low. If we see a similar move down to the price objective, that will shake many PM investors to the core. This looks like a good time to raise a little cash if one is a shorter term trader. For the intermediate to longer term investors sitting tight still looks like the best approach. Once we get the first reversal point in place, at the bottom of the new trading range, that will suggest the low for the rest of the bull market is in place. Surviving this first reaction low will test your mental fortitude if it plays out.


