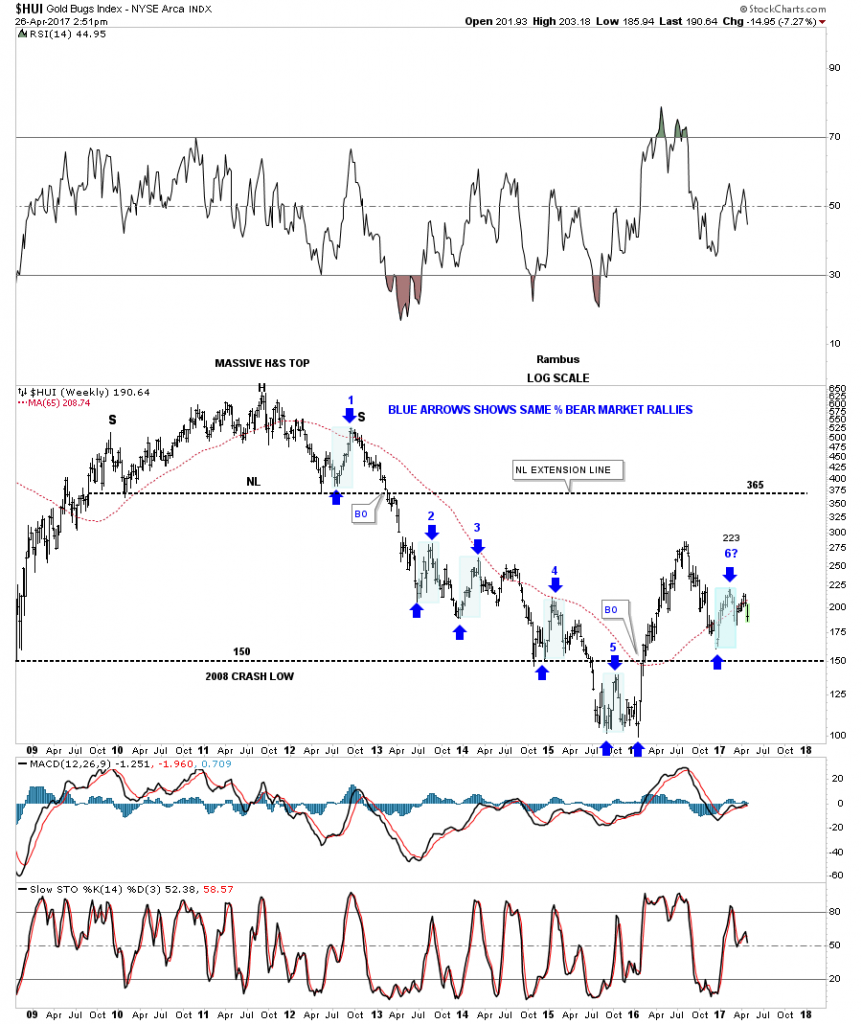
Just a quick update on the weekly chart for the HUI which shows the blue shaded areas are all the same percent bear market rallies. The last time we looked at this chart the HUI had just rallied back up to the top of the blue shaded area at #6. What we needed to see happen is for the HUI to rally no higher than the top, which it came close. If you look at all the other bear market rallies none ever went higher that the preceding one. The only time the price action went higher than the preceding bear market rally high was at the low at #5 which was the biggest rally of the bear market. If this bear market rally plays out similar to all the other ones we should see lower prices ahead.
Rambus Chartology
Moving forward

