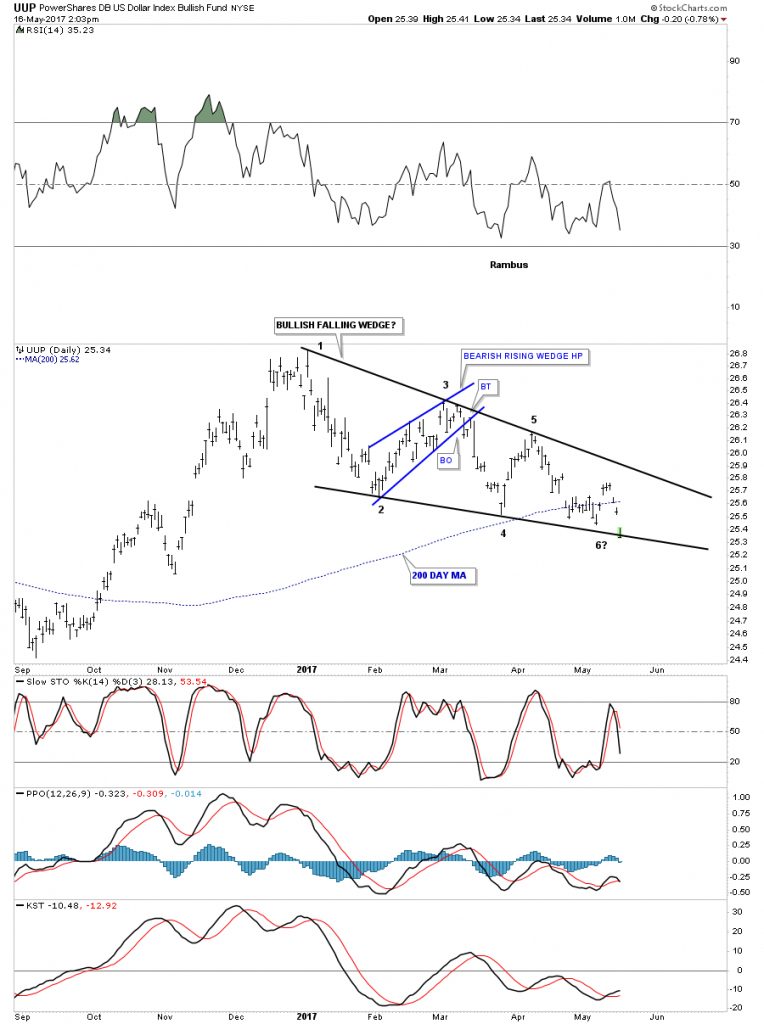
Below is a daily chart for the UUP which shows the price action testing the bottom rail of the falling wedge. There are 5 completed reversal points which technically, at the moment, makes the falling wedge a reversal pattern to the downside if the bottom rail gives way.
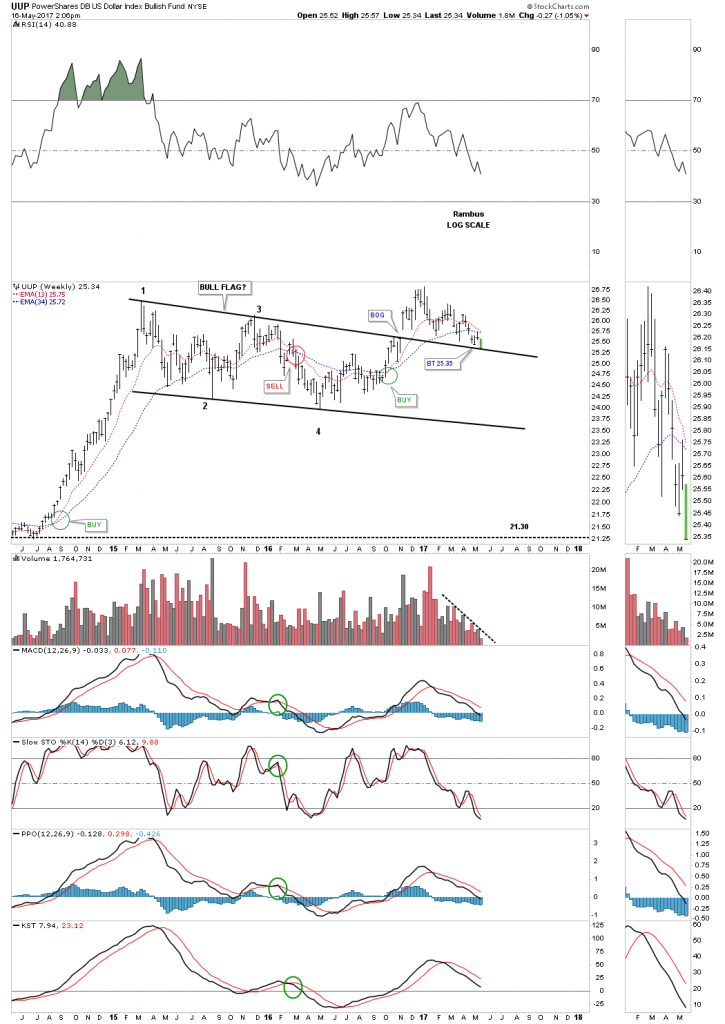
The weekly chart shows the backtest to the top rail of the nearly 2 year trading range which is critical support that needs to hold.
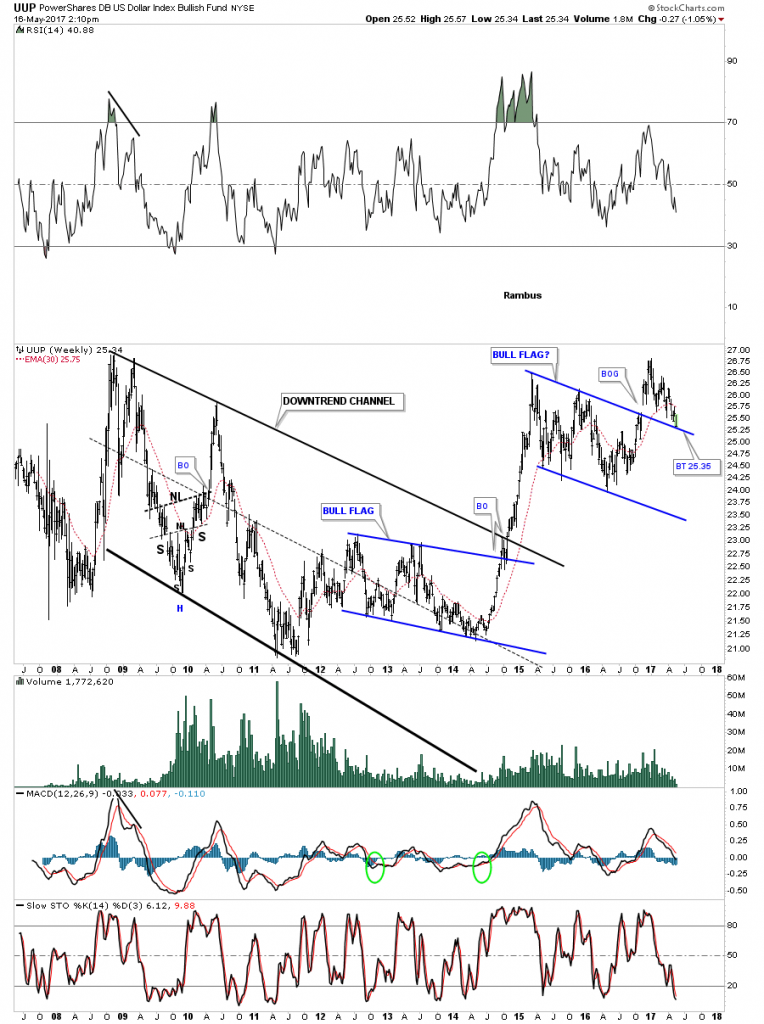
UUP long term weekly chart:


