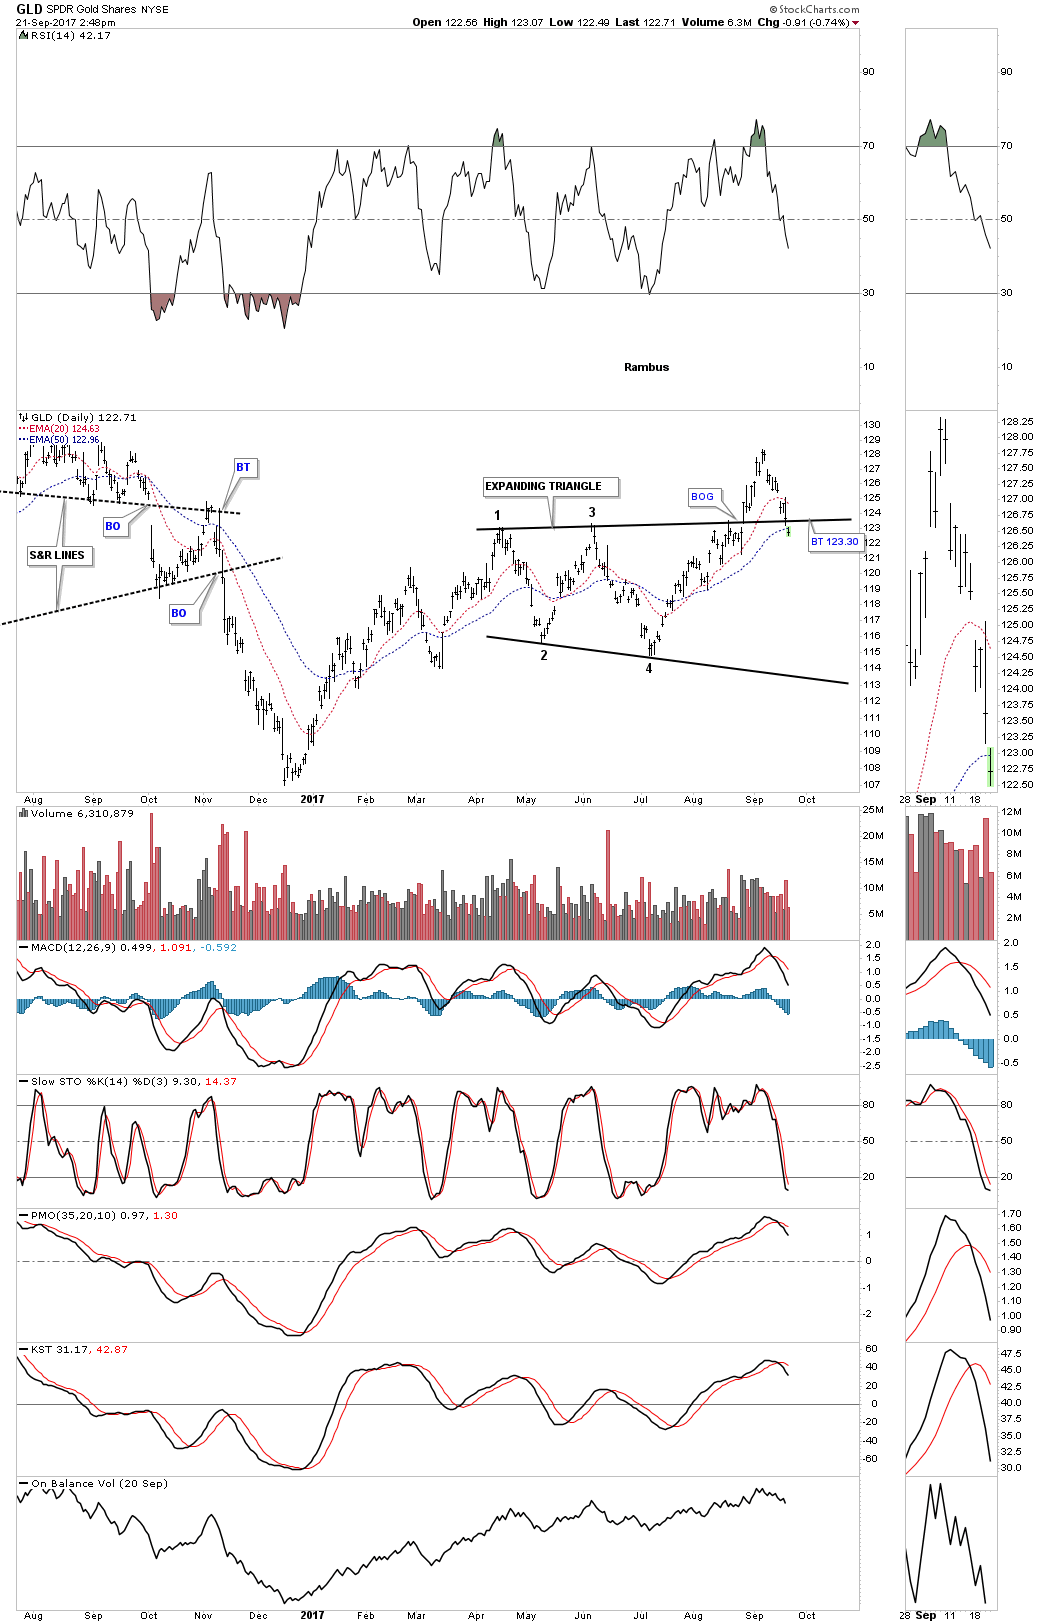
Just a quick update on the daily chart for GLD which shows the price action gapping below the top rail of the expanding triangle this morning. This gap matches the breakout gap on the way up which is now creating an island reversal pattern. Today’s price action also gapped below the 50 day ema. With the price actin now trading back inside the expanding triangle I have label the breakout back in August as a false breakout.
Rambus Chartology
Moving forward

