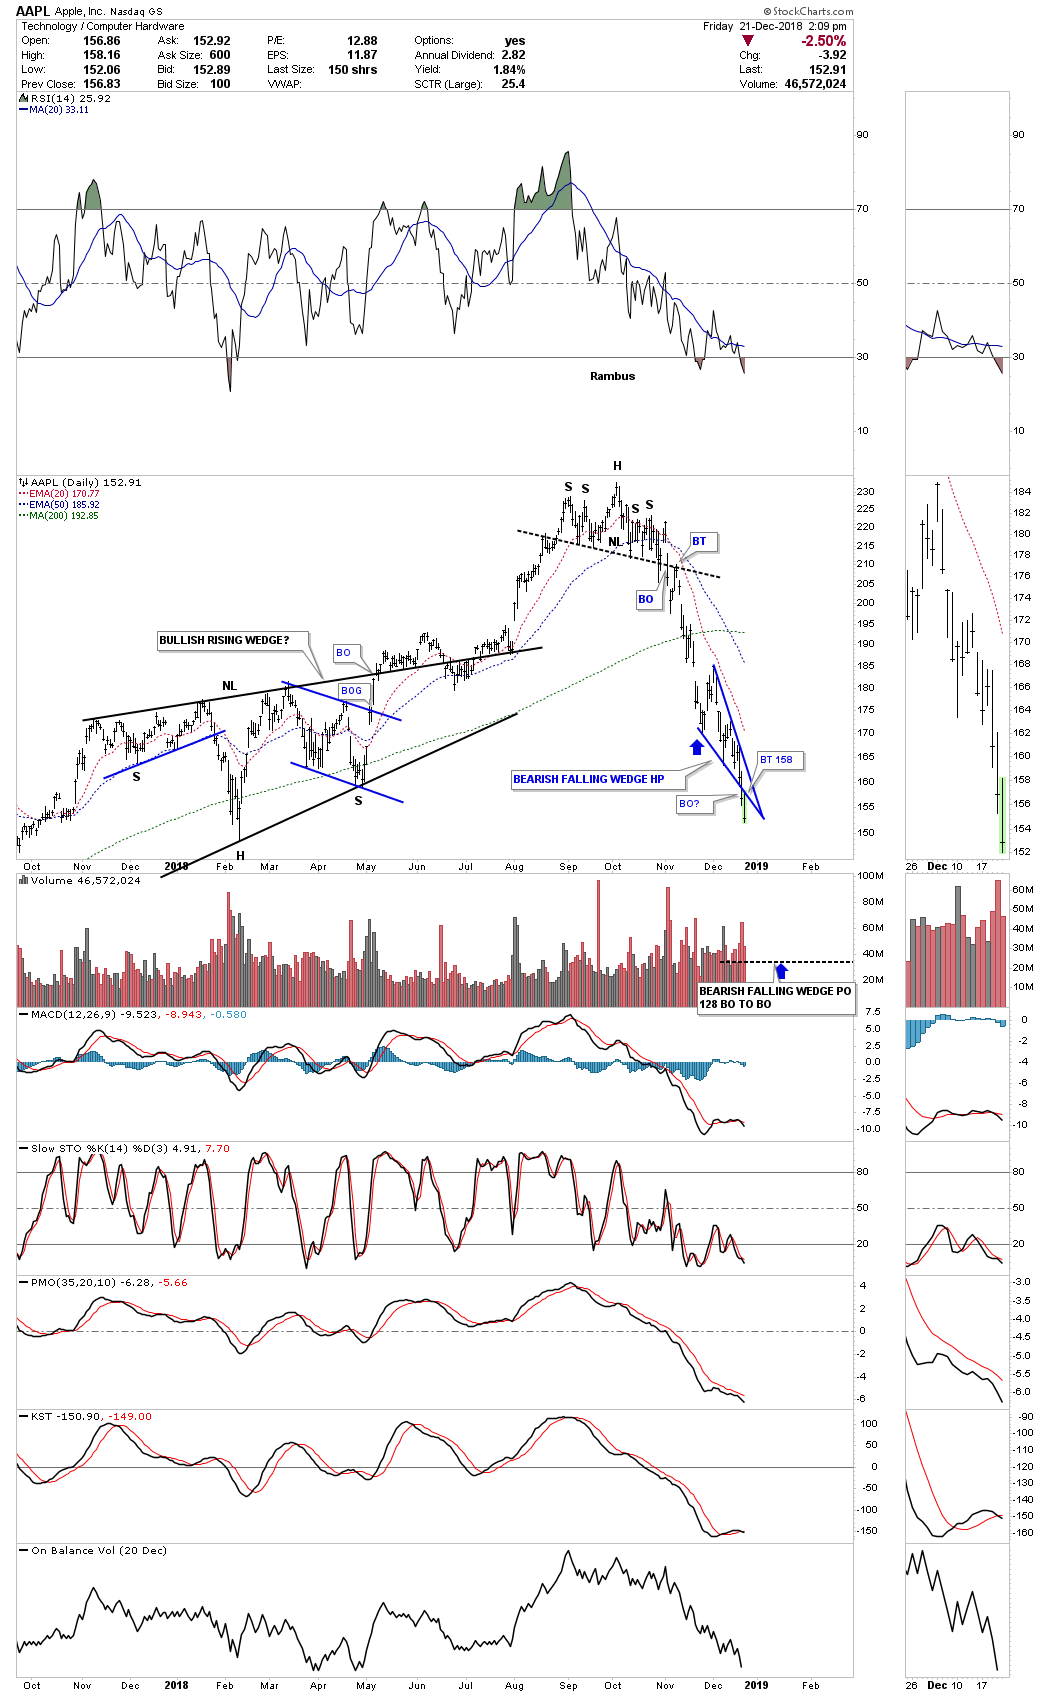
Just a quick update on the daily chart for AAPL one of the largest of the big cap stocks on the planet. After building out a H&S top in September of this year AAPL declined very quickly to the downside where it began to consolidate the recent impulse leg down. The consolidation pattern that AAPL built out is a pattern all of you have seen many times in the past which lets us know that a stock or market is in a hurry to move, in this case down, the pattern is the bearish falling wedge which slopes in the direction of the downtrend.
Today AAPL is breaking out from the bottom rail of the bearish falling wedge. Keep in mind this pattern is like any other consolidation pattern as it shows roughly the halfway point in a bigger impulse move. Note the bigger combo H&S – black bullish rising wedge that built out earlier this year on the left side of the chart. For those that have the ability to short this stock or buy put options you can use the top rail of the bearish falling wedge as your sell/stop.
I used the breakout to breakout method to get a price objective for the bearish falling wedge halfway pattern which would be down to the 128 area shown by the blue arrows. Again, these patterns show up in fast moving markets.
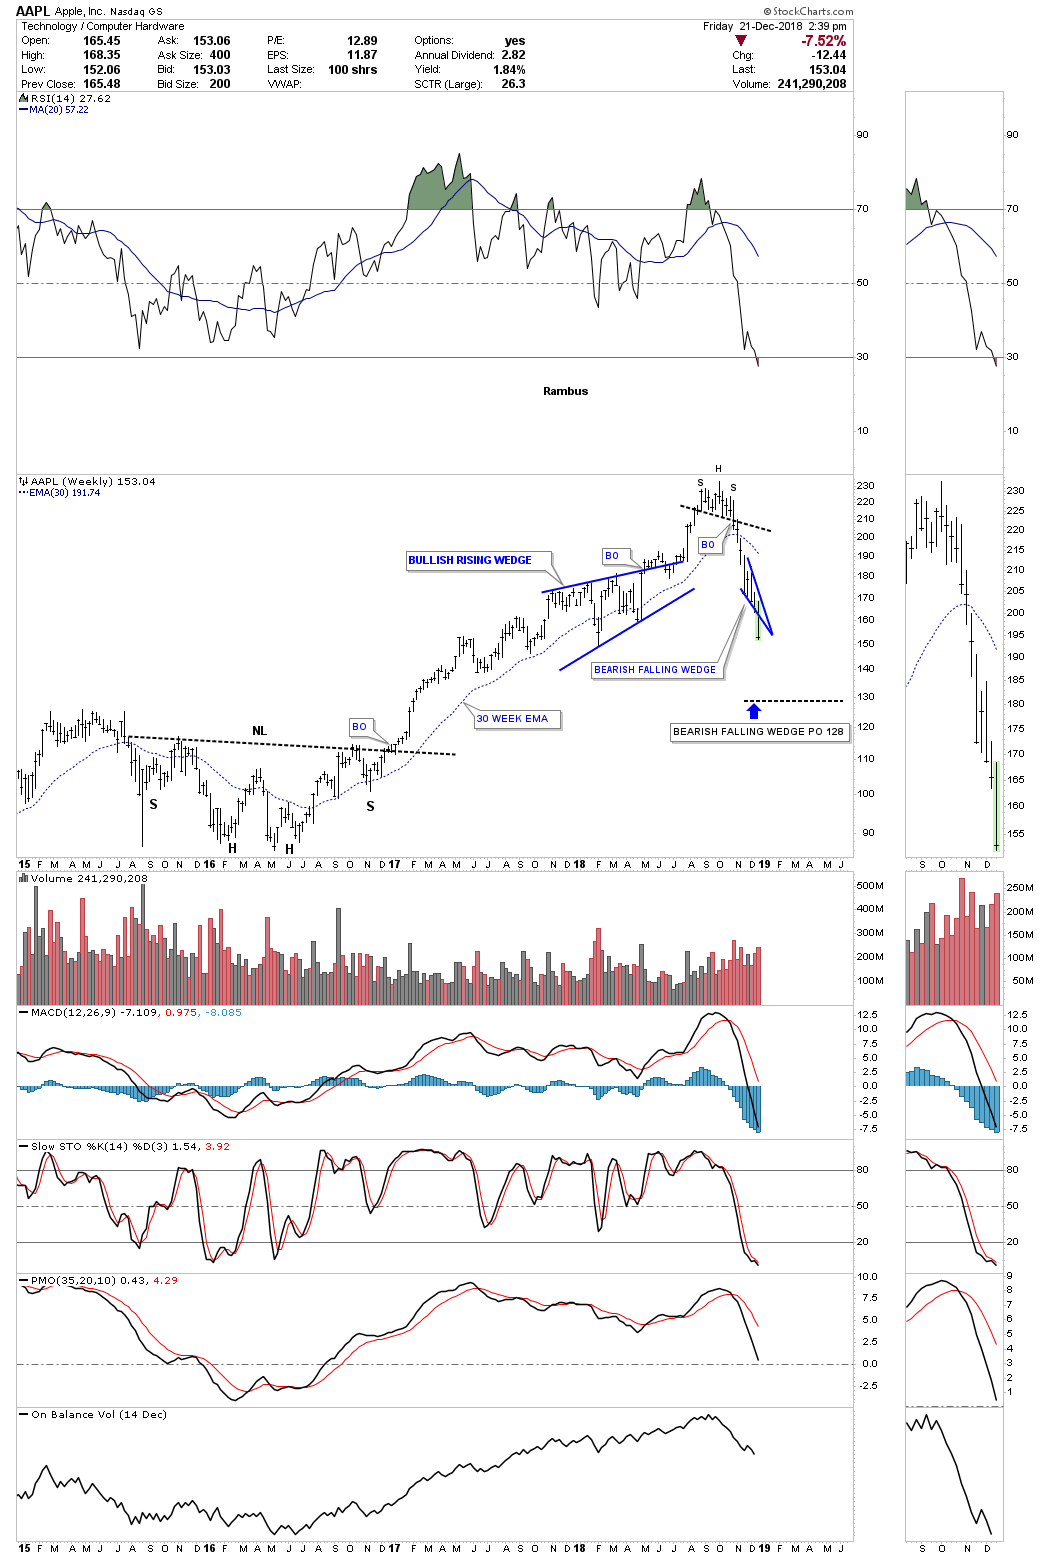
This weekly chart puts everything into perspective. The price action leaving the falling wedge should look similar to the price action leading into the falling wedge so we could see this move lasting another two to three weeks before the falling wedge price objective is reached.


