Having trouble making sense of the market? Do you feel like you are living in some sort of a parallel universe where almost everything happening in the market seems to be the opposite of what you have learned should happen? You are not alone so let’s try to make some sense of it. This weekend I will present two possible outcomes for the stock market and the rational behind them. We will also look at some out of favorite stocks in a bull market.
I see myself more of a market strategist than anything else. What I have learned after actively watching the ebb and flow of markets for almost 40 years is that the simplest approach is typically the best approach for us mere mortals. Sure we may be able to score a few short term trades here and there, but the amount of effort and focus it takes makes it unrealistic to make it ones primary investment approach. It takes an investment professional to consistently make money as a trader. Those of us who work for a living are best served trying to ride a bull market and not get too wrapped up in the day to day motion of the market. But to ride a bull one must know an awful lot of things, because it takes an independent critical thinker to buy a bottom and sell somewhere near the top after a market fully expresses itself to the upside. He must be able to divorce himself from the crowd and believe in himself. He must be able to be comfortable being alone from time to time. To me the most important thing is to understand where the market is in the greater scheme of things. I say this because it is my personal approach to investment to find and be in a bull market and to avoid bear markets at all costs. My observation is that those who listen to Wall Street’s advice to be in the market at all times is suicide. Bear markets destroy investors and they ruin ones ability to ride the next bull market upward due to the psychological damage they incur.
It is my considered view that we are in the final topping phase of this 10 year bull market. It is extremely broad and stretching over a 2-3 year period. The length of this suggests it may be not just the top of the last 10-year cyclical advance, but could even be a secular top of the bull run since 1982. It would usher in a shift out of the favored asset classes of the past replacing them with a whole new class of assets to power the next bull market.
Making Sense of the past 2 years
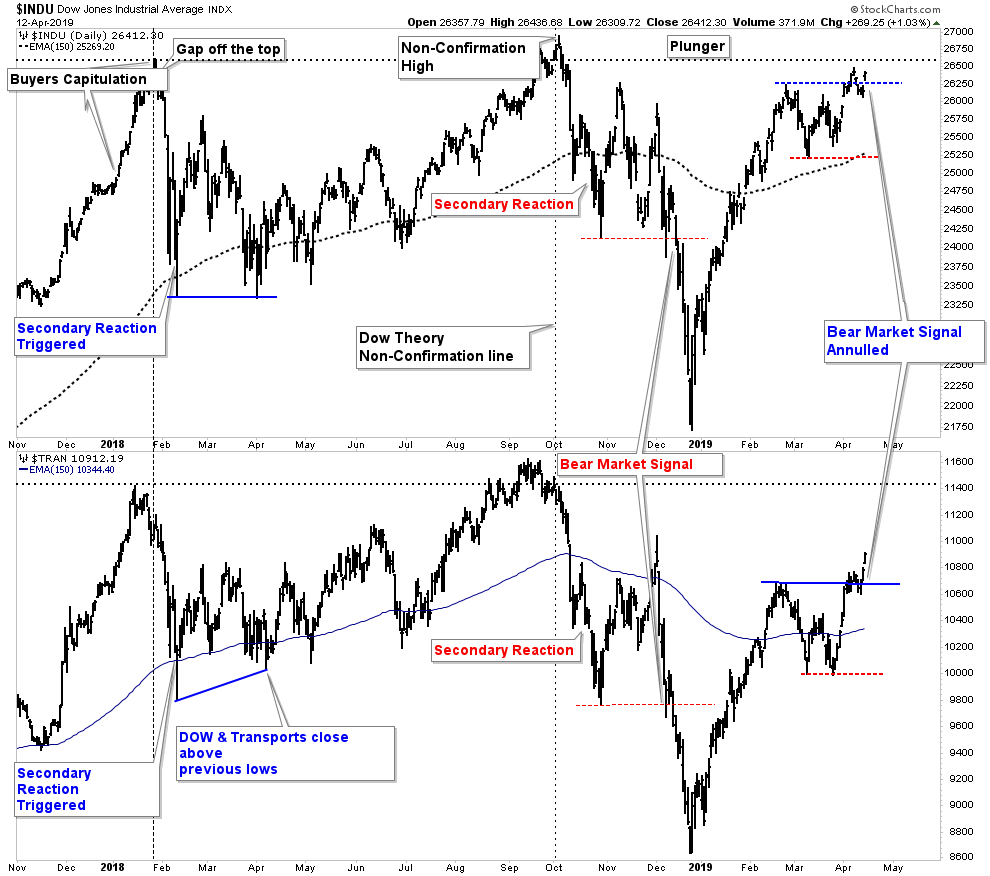
I have chronicled the action in the general stock market over the past two years. It was actually somewhat textbook in the way it unfolded until recently. After the Trump election the market entered a Phase III advance where the public finally entered into the market and embraced the risk. By December 2017 they abandoned all fear jumping all in. This can be seen on the chart below in the 2-month period from Dec 17-Jan 18. This was a case of classic bull market buyers capitulation, throwing all concern for risk aside as fear of missing out took over. After the severe sell off in Feb 18 the market recovered throughout the year into a typical early fall peak. The FED had been raising rates slowly over the past 3 years and finally found the bubble bursting point in late fall. After the sharp 19% decline by December 24th the FED made a total 180 degree reversal. The new stance became to stop raising rates and announced an end to their balance sheet reduction. Since then the market has been celebrating Powell’s successful medical operation of removing his spine. The FED has returned to its roll of the past 25 years of stock market money supplier and cheerleader.
Above we see how the vertical rally since December 24th has now ANNULLED the bear market signal of December 14th. This does not mean we are in a bull market, just that the previous bear signal is no longer in effect. So we are in neutral territory as far as Bull/Bear market classification.
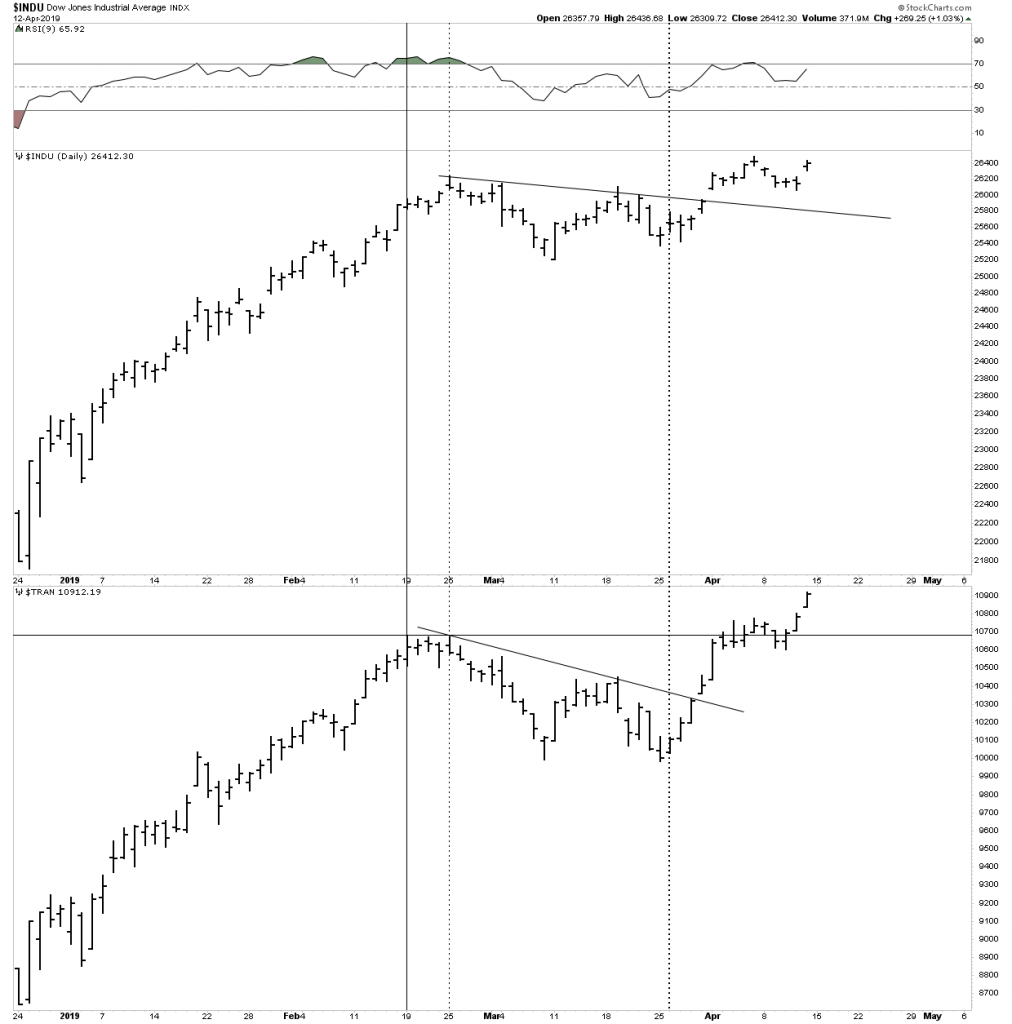
DOW vs Transports:
Here is our Dow vs Trans close-up of the post Dec 24th rally. It teased us for a while that a top was being put in, but now it shows it is getting back in gear to the upside.
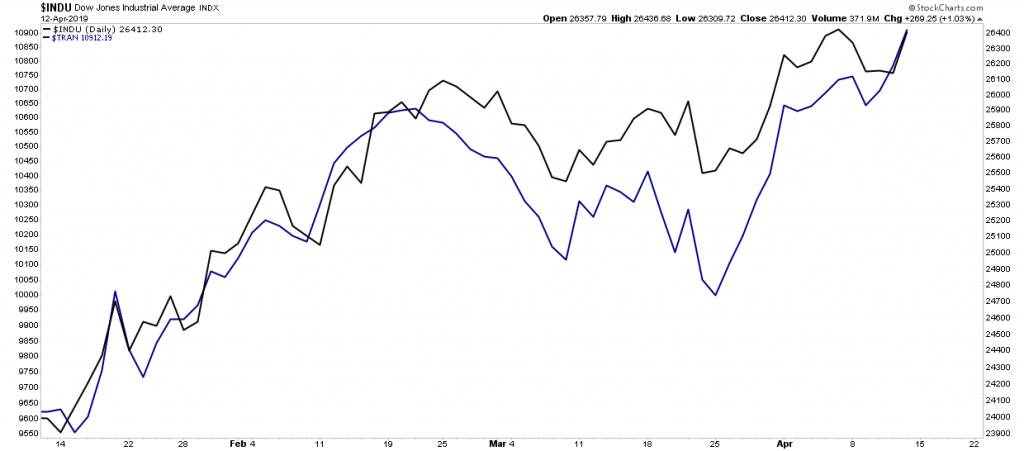
Dow and Transports now back in line confirming each other:
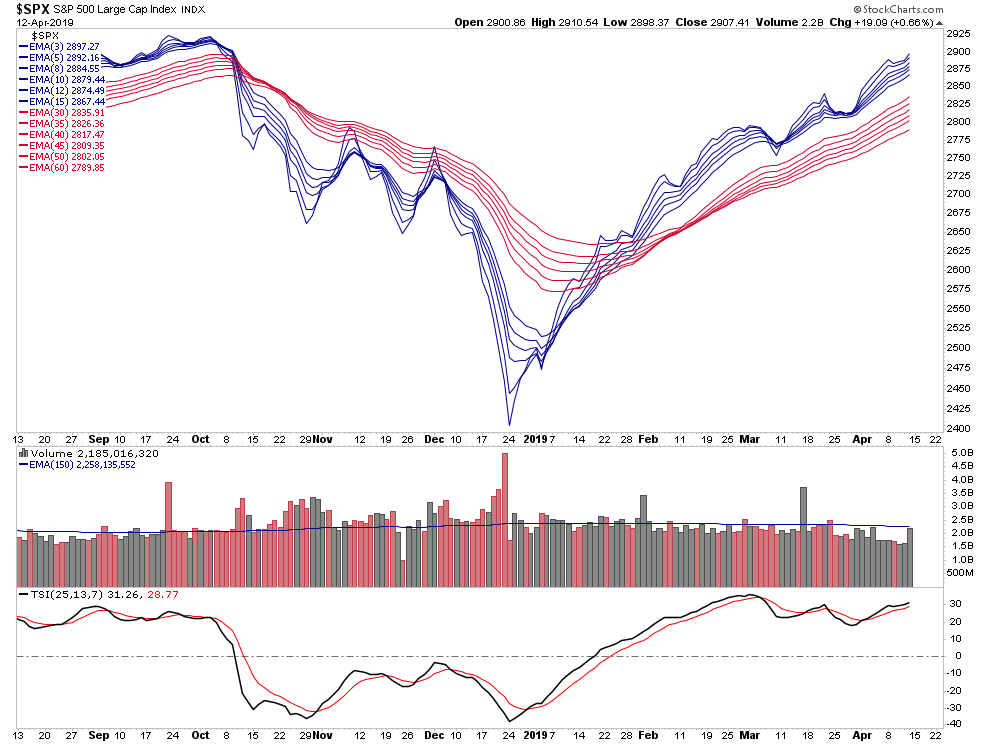
Moving Averages showing upside momentum:
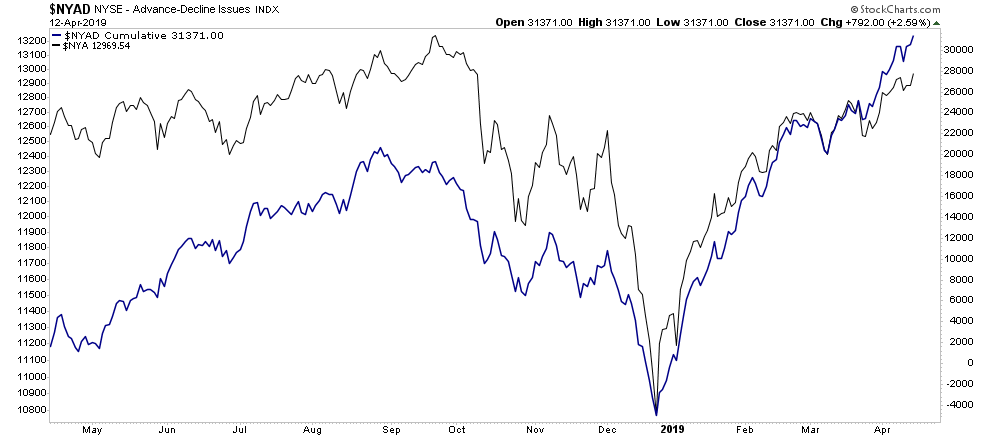
NY Composite Adv/Decline line- Saying all along that the trend up was intact:
In past market tops the Adv/Decline fell off in advance of the top. It’s accelerating upward now!
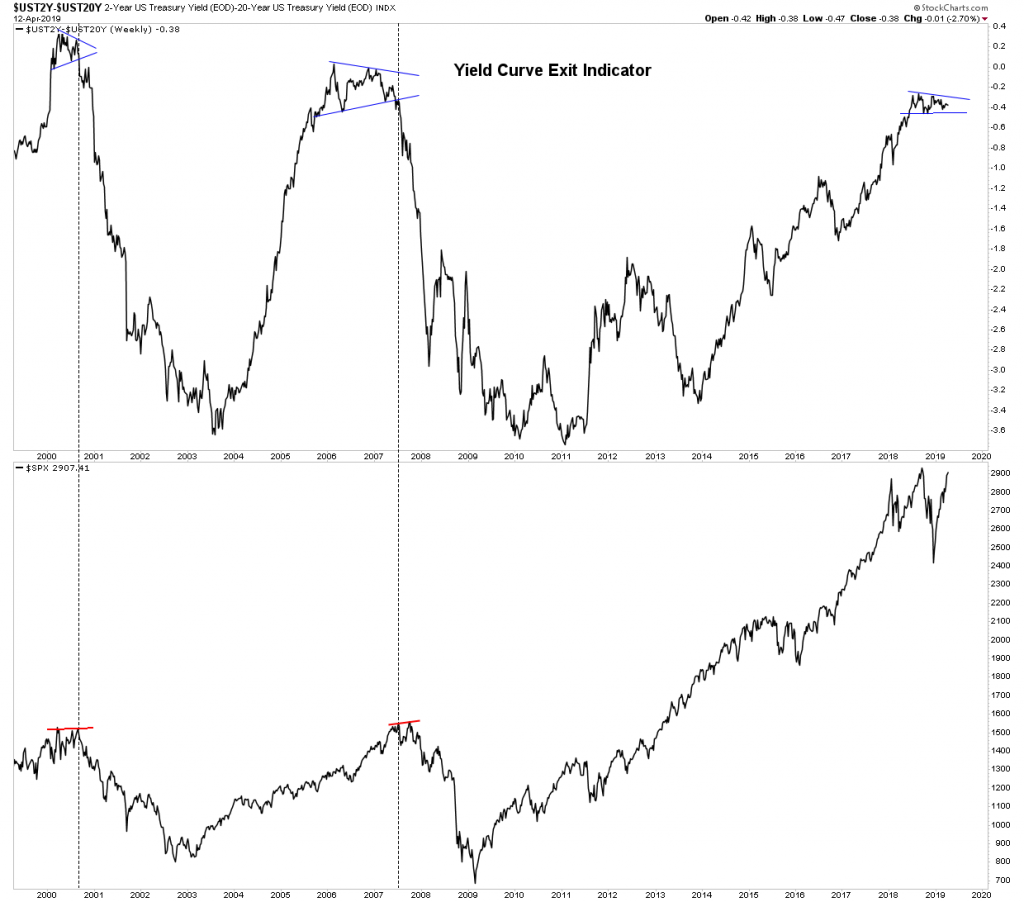
Plunger’s Yield Curve exit indicator says stay in the market still.
So the above group of charts hints that the market is not done yet. It’s likely going higher maybe even to new highs.
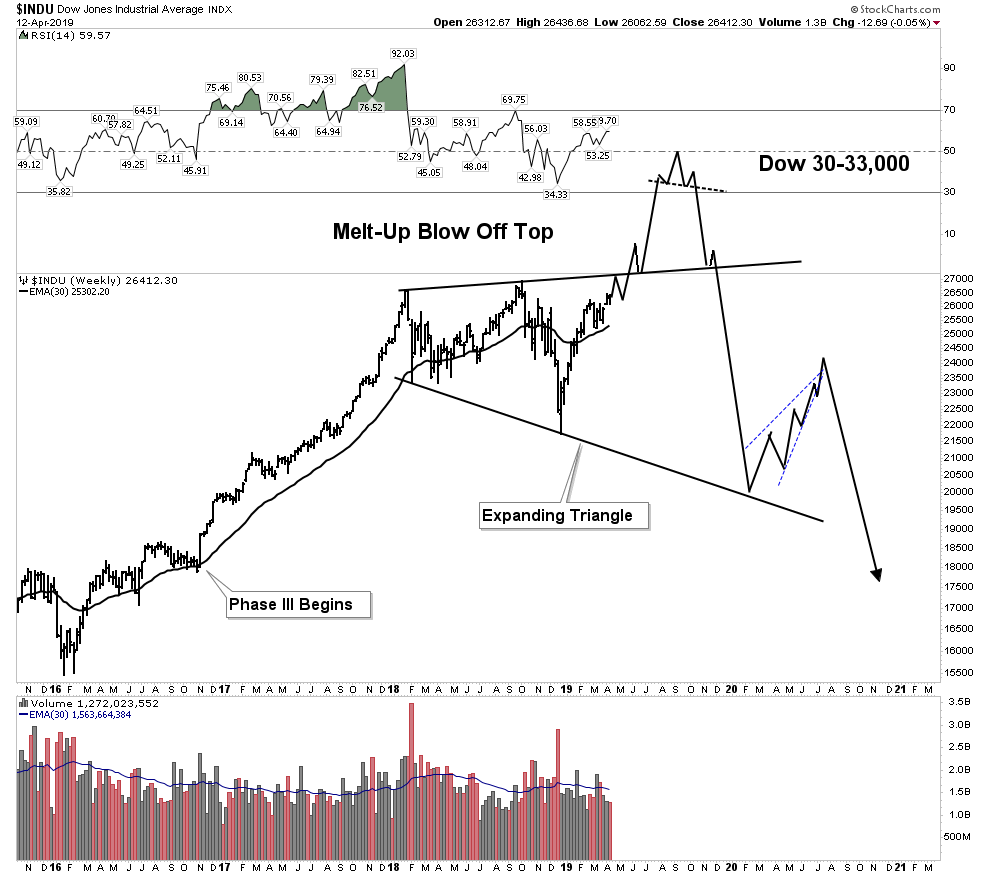
All interesting stuff, but here is the shocker. I hope you are sitting down for this as my forecast has changed. I believe the most likely outcome is the market is setting up for a melt-up topping scenario. That’s right Mr. Bear himself, Plunger thinks the most likely top to this market comes in the form of a melt-up top! I understand if you are surprised by this as I had chronicled the steps to the top throughout all of last year and it seemed the top actually played out according to script, but things have now changed. Up until the Powell spinal operation things were performing to the same script for all bubble tops over the past 100 years:
The playbook has been the FED stokes the bubble for years and when things get out of control they begin raising rates to cool things off. Eventually the higher rates pop the bubble and the FED is slow to recognize the puncture until it is too late and the bubble deflates into a hard bear market or devastating depression.
This is what happened in 1921 when the FED tried to cool off the commodity speculation from WWI. They popped the bubble and we suffered a hard fast 2 year depression. The big one of course was the 1929 bust. The FED pumped all through the 1920’s in various programs resulting in the Florida land boom and ultimately the wild speculation on Wall Street. In Feb 1928 they began tightening rates trying to cool things down and eventually popped the bubble in the fall of 1929. We all know what followed. Same thing in the year 2000 rising rates popped that decade old wild dot-com speculative spree. The Dow fell 47% and NASDAQ 80% over the next 2 years. Most recently in 2007 the FED raised rates to cap the wild housing boom. Bernanke stated it was all contained and kept raising rates well into the rollover.
I hope you see the pattern here. FED stokes a boom, raises rates attempting to cool it off, but is slow to recognize the bursting of the bubble and disaster ensues. That has been the pattern for 100 years. But this is where it is different this time (for now at least). The FED knows this sorry history and for the first time ever they have done a complete reversal before the bubble bursts. Ultimately the bubble will burst and things will come tumbling down, but for now they are going to lower rates, and pump money, before the bubble bursts in an attempt to prolong the cycle (election 2020).. This hasn’t ever happened before and could lead to a wild upward blow off top.
When investors are in a speculative mood and rates then get lowered to almost zero it’s more than gasoline on a fire it’s nitroglycerin!
It is my view that the FED is playing with fire and they could launch the market uncontrollably higher over the next year. That’s not a forecast, it’s just a potential outcome. Before we take a look at what that could look like let’s go back to 1929 and look at that blowoff top.
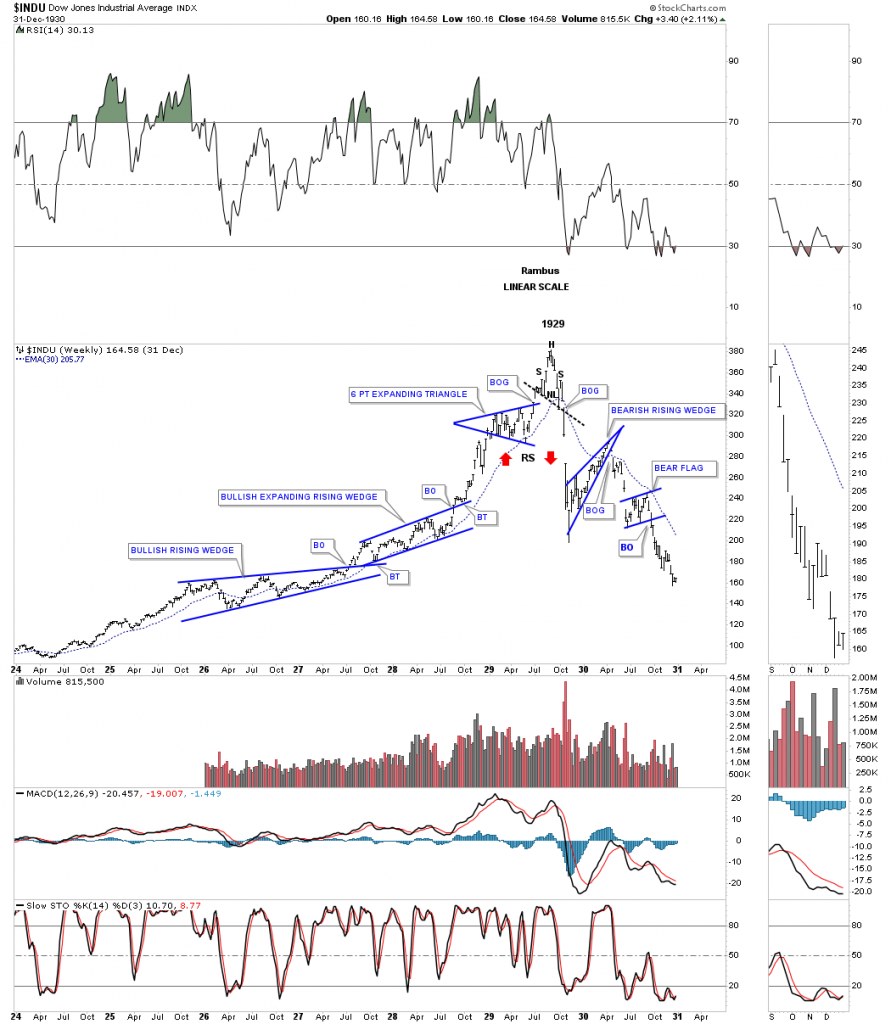
Rambus has been generous to give me a preview of the below chart which shows the bubble blow off top which occurred in 1929. Notice how the final phase III vertical ascent began just after the FED began to raise rates in Feb 1928. Just prior to the final blow off from early to mid 1929 the market traced out an expanding triangle while forming a left shoulder. Later you will see today’s market is presently forming a similar expanding triangle.
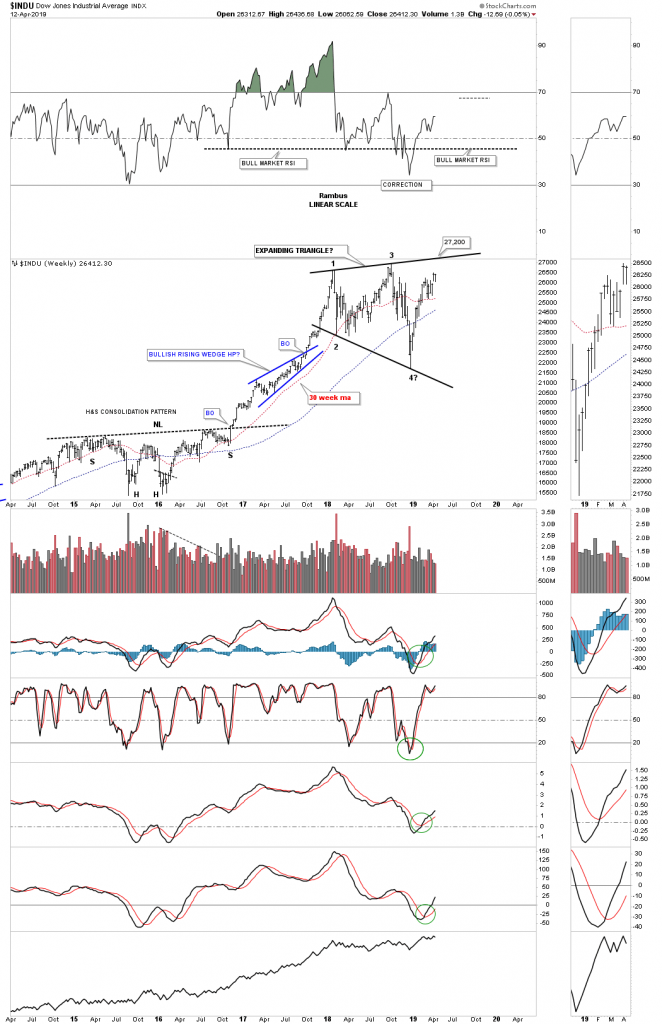
Below is Rambus’ depiction of an expanding triangle in today’s market:
Could the above expanding triangle be part of a similar 1929 blow off top in the DOW? If it is it could look something like this below:
Again the juice for all of this happening is the early U-Turn the FED has made in rates. They have not lowered rates yet, but with Trump beginning to pack the FED with easy money men (Moore & Cain) clearly that’s where we are headed.
Ultimately, this spike high would flame out just as it did in 1929 and could spell the end of an era.
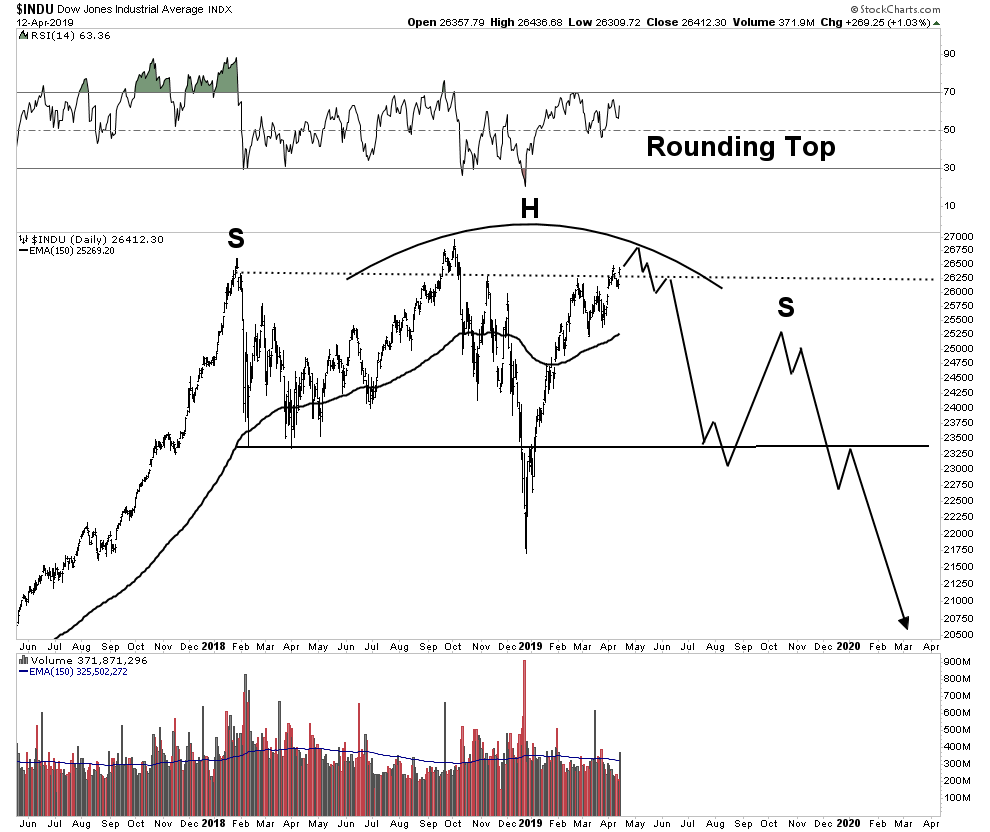
Rounding Top- A Second Scenario
Another possible outcome is the Sell in May and Go Away rounding top scenario. This is more of a conventional outcome to the end of a powerful bear market rally which we have just experienced. As shown above market internals don’t fully support this, but remains as a definite possibility.
Short Sale Update
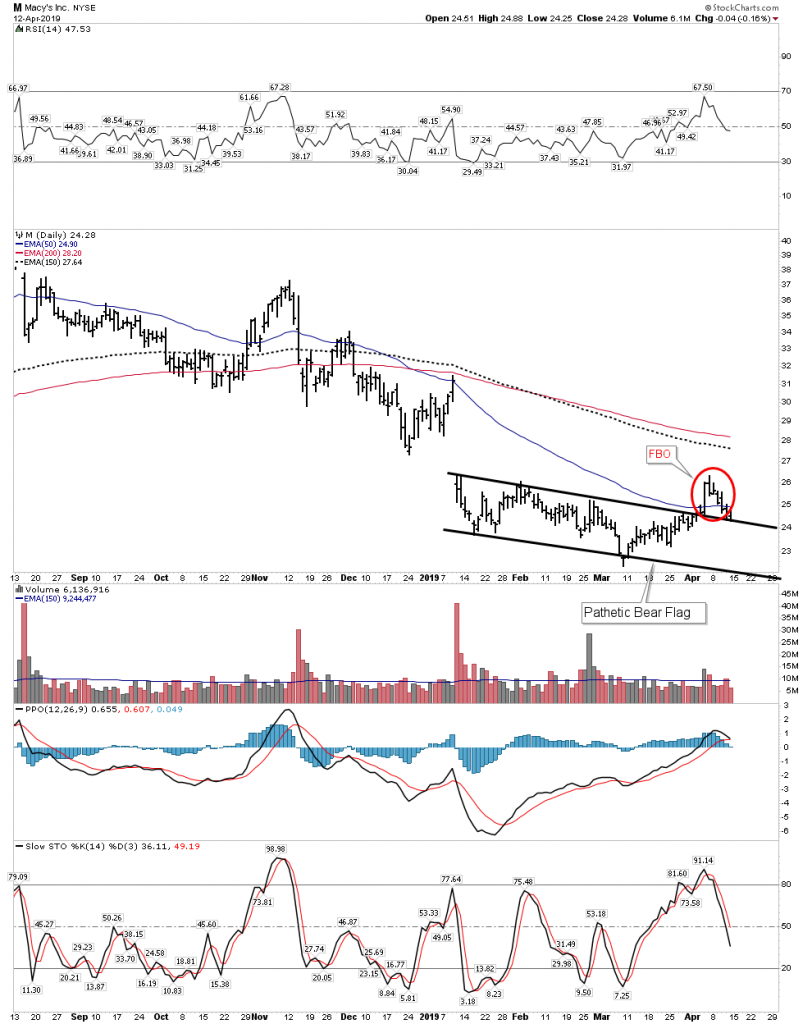
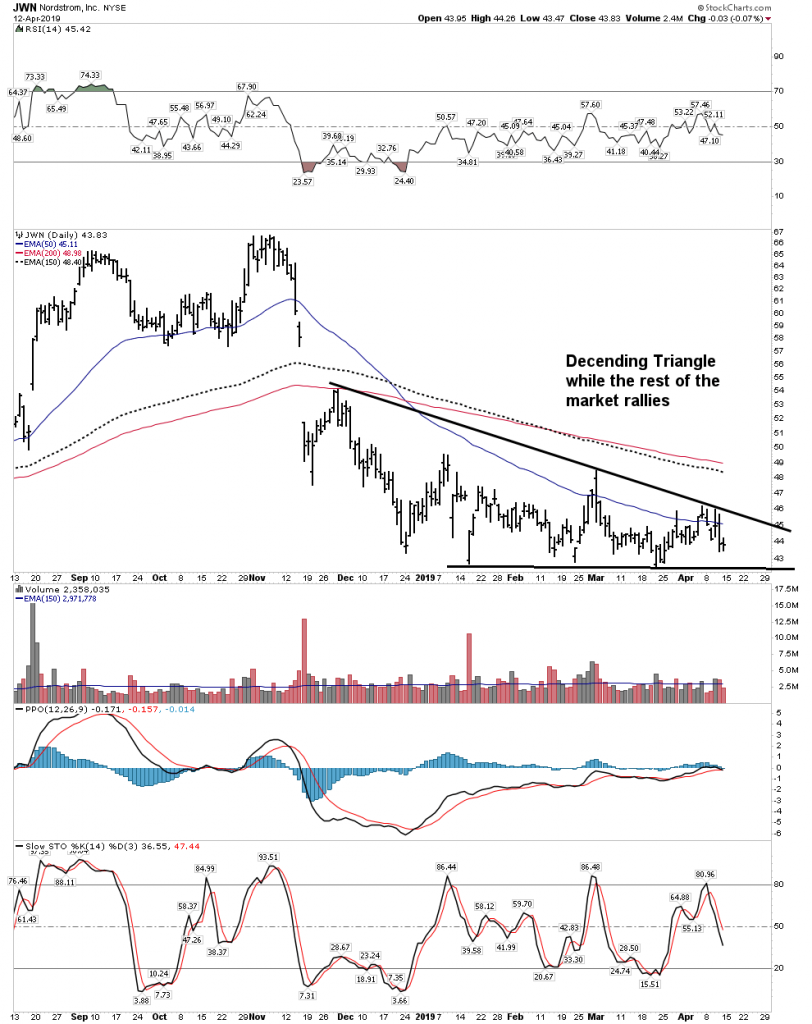
Until the market wants to go down, shorting stocks is not worth the effort it takes. But let’s look at a few sickly potential short sales. You’ve heard of the retail apocalypse, well it continues to progress. Take a look at these two industry dominant retailers, they are sickly and begging to be shorted. Macy’s and Nordstroms stock have not been able to get out of there own way. Compare the action of the past 4 months with the rest of the market. Most stocks have bounced nicely in the post December BMR, but these two are wallowing. Whenever the market as a whole finds a top these two will be prime short candidates:
Sick Sick
Tesla
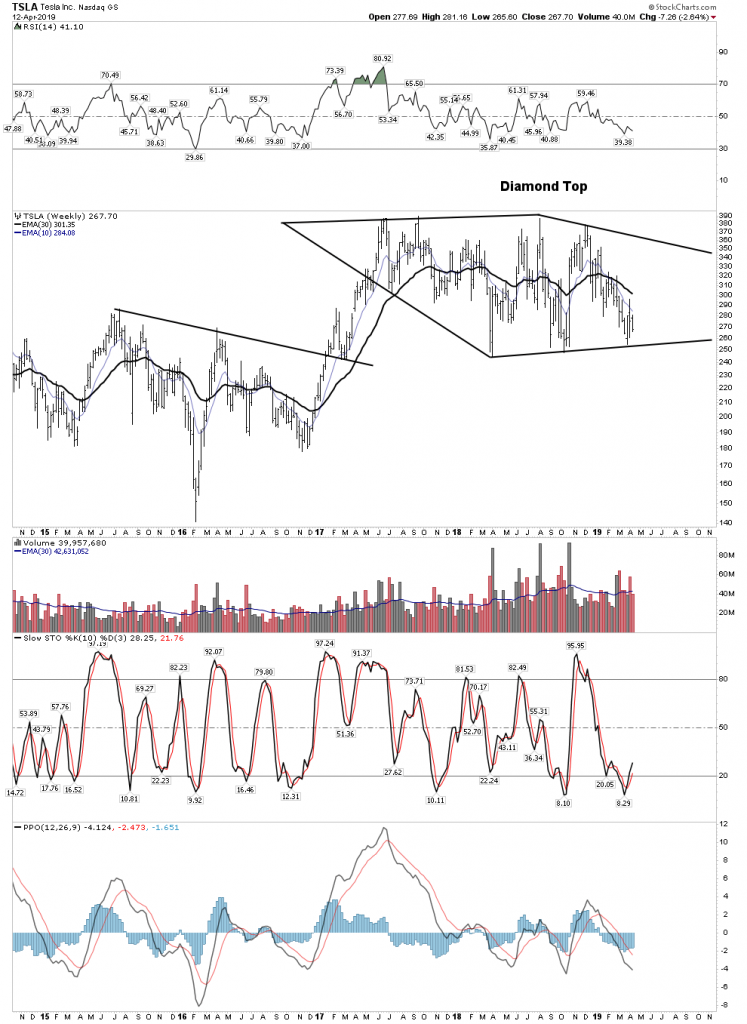
Tesla should turn out to be a great short eventually. Plenty of traders have broken their ax on this trade, but I think it’s just a question of timing. So I am waiting on the sidelines patiently stalking my entry point. If the market melt-up-top scenario plays out that should provide the entry point:
If we get that market melt-up Tesla could run up somewhere near the top of the diamond top and offer us one last short entry point.
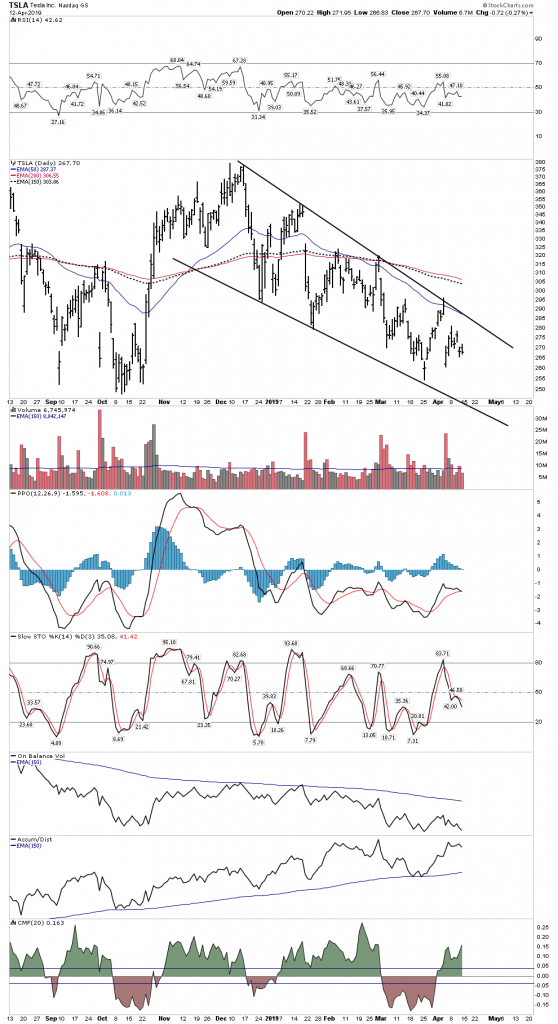
Below one can see that if it did rally it would break out above its falling wedge likely leading to another Tesla short squeeze. This would clean out the shorts before the collapse. That’s how Mr. Market likes to do it.
Keep refining your short sale list as you will want it well vetted and at the ready when the time comes… just not now.
Commodities
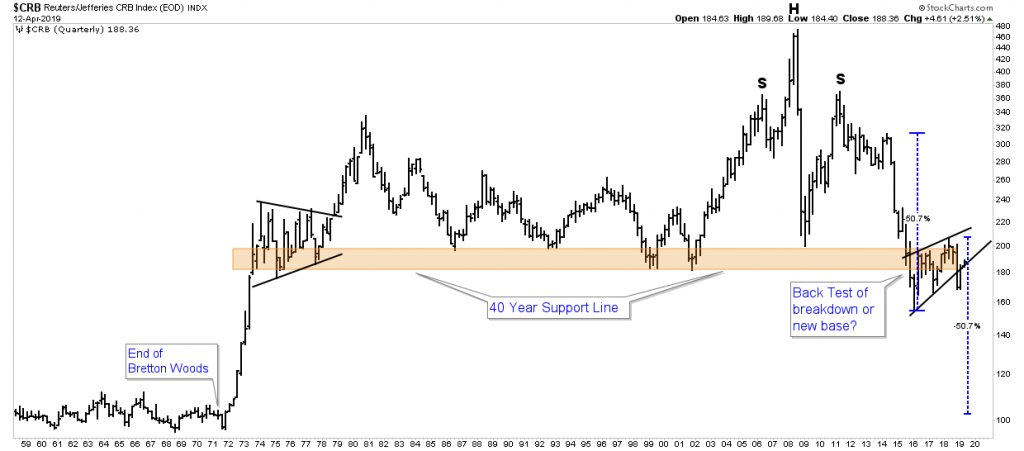
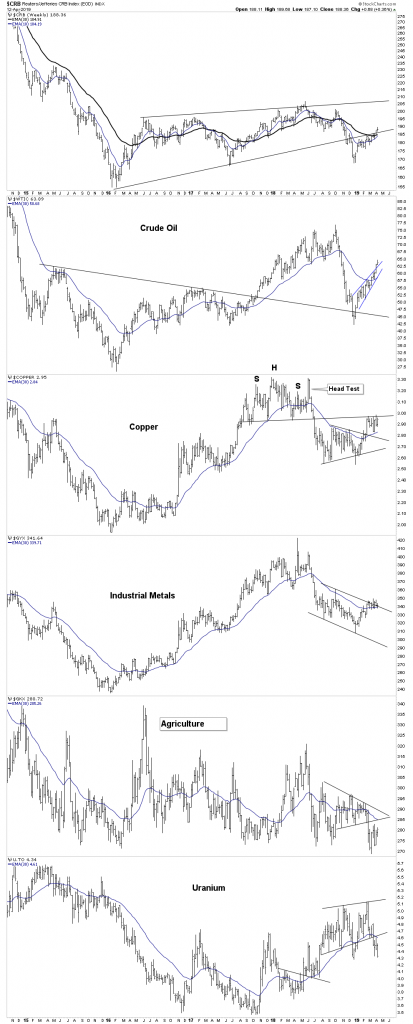
The PBC thesis calls for the prices of commodities to fall. However until the economy and stock market begin to decline commodity prices should stay levitated. I don’t expect them to decline until then. With this in mind let’s review the big picture:
I still think we are just in BT mode before the break down which comes with a recession
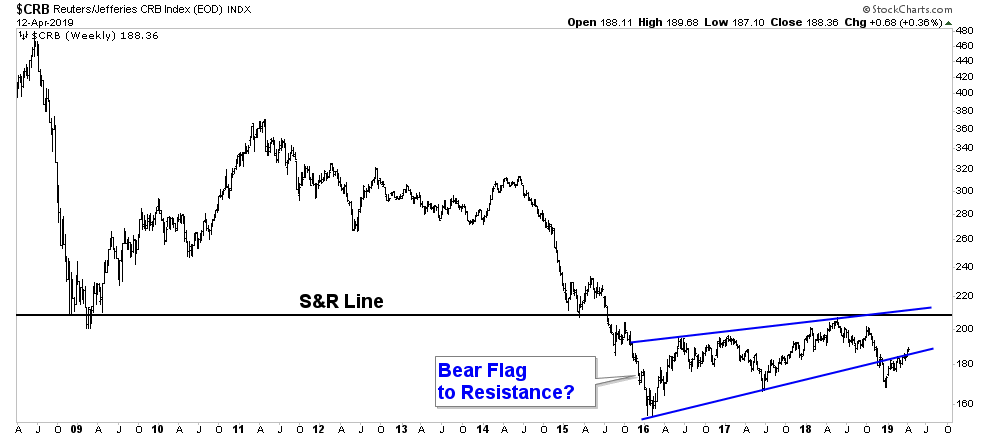
Below we zoom in on the sickly bounce of the past few years which has been regarded as a bull market by most investors
Major commodity sectors:
Crude Oil
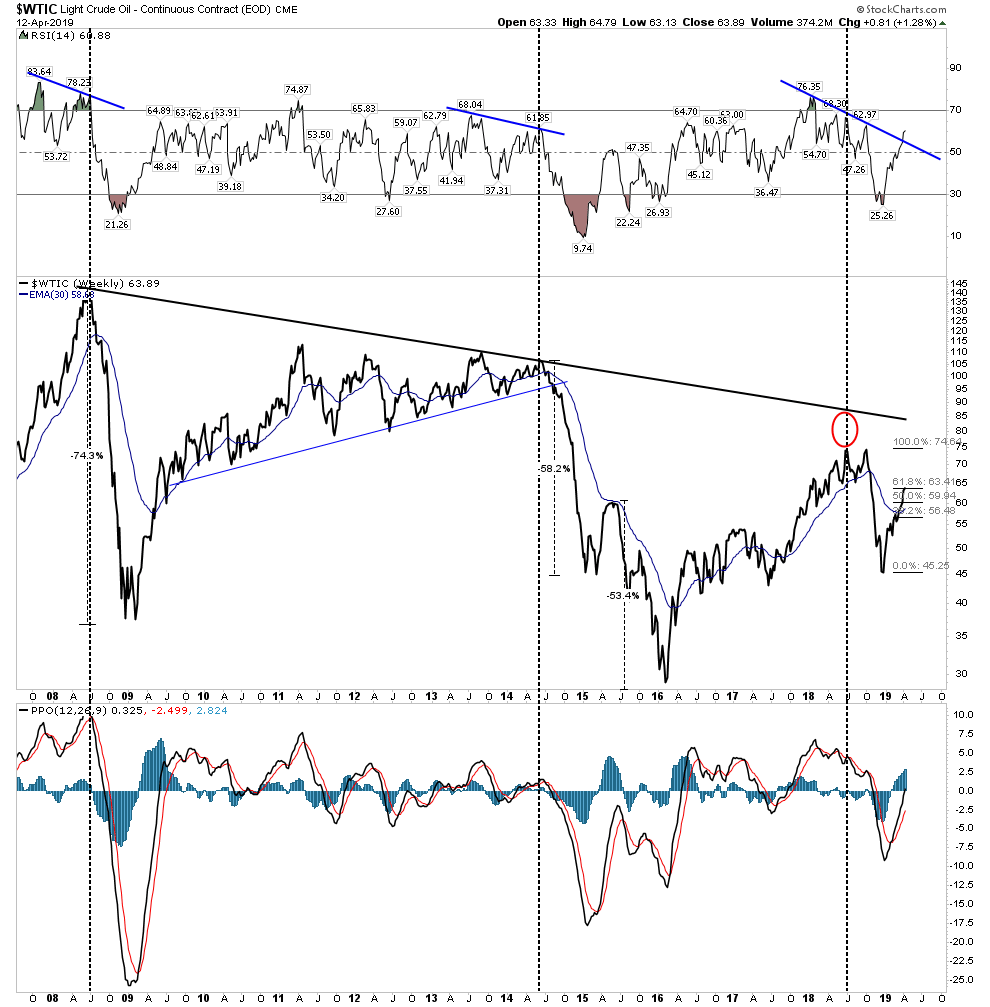
My view is that oil continues to be in a secular bear market now into its 11th year. Within this secular bear we have seen 2 completed cyclical bear markets 2 completed cyclic bull markets and are likely in a new early stage 3rd cyclical bear market. It is my speculation that the end of this bear market will offer lifetime opportunities to invest in the oil sector at generational attractive value levels. Deep water off shore and quality service companies will be my hunting grounds… but that comes in a few years.
Long Term Crude Oil
Past 11 years 2 Bears, 2 Bulls and a new bear
We have now retraced a Fib 61% of the decline
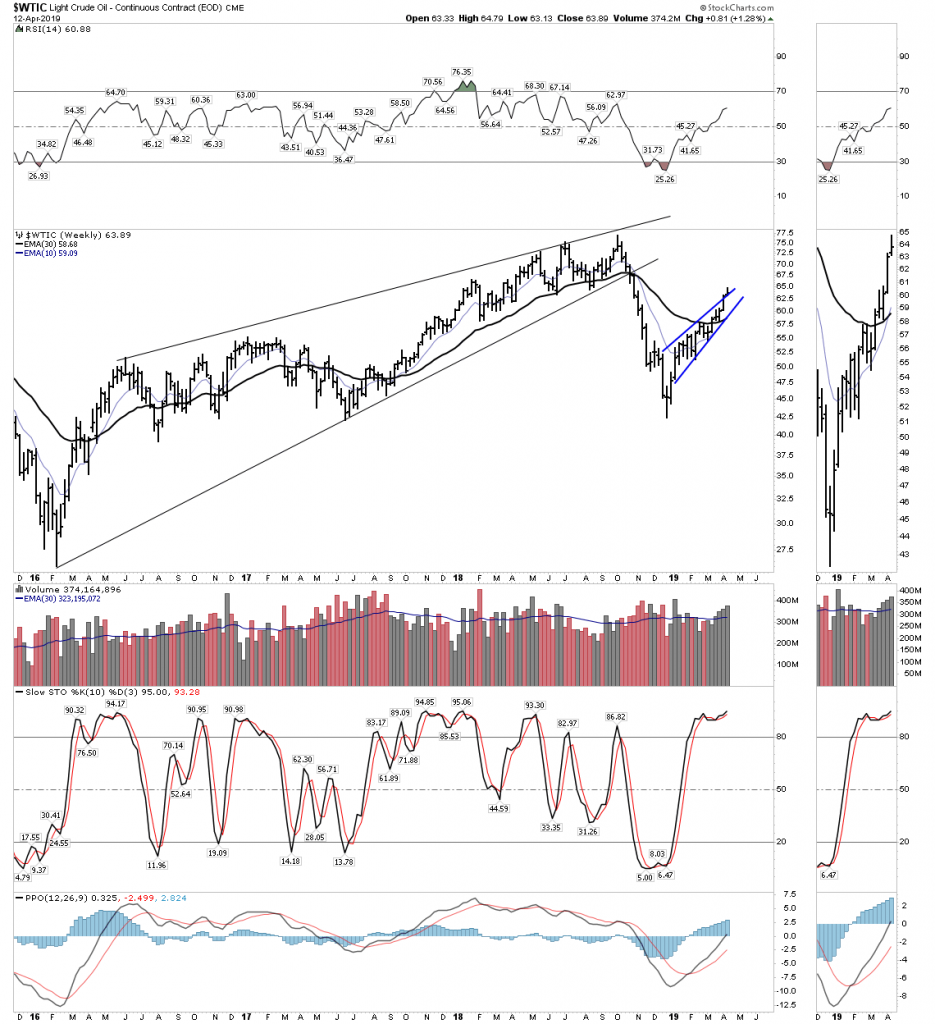
Below the rally since December looks like a classic rising wedge with a blow through of the upper boundary. Typical oil market behavior.
Gold Market
I have made it clear I see the gold market in the late stage of Phase I of a massive bull market in gold. The bull began in Jan 2016 and after a 7 month moonshot advance it spent the next 25 months sorting out the winners and the losers in a somewhat painful consolidation of the first leg-up move. But here is the thing about phase I action, it is slow and lethargic and the public could care less because they do not look for value they look for action. It does not necessarily feel like a bull market, but it is here that the ultimate big money is made for those bold enough to recognize and buy. Once it enters into Phase II when the public slowly wakes up and starts to get interested things will begin to move along at a faster clip. I suspect Phase II begins when gold clears the $1400 Hadrian Wall.
Gold Bull Market Strategy
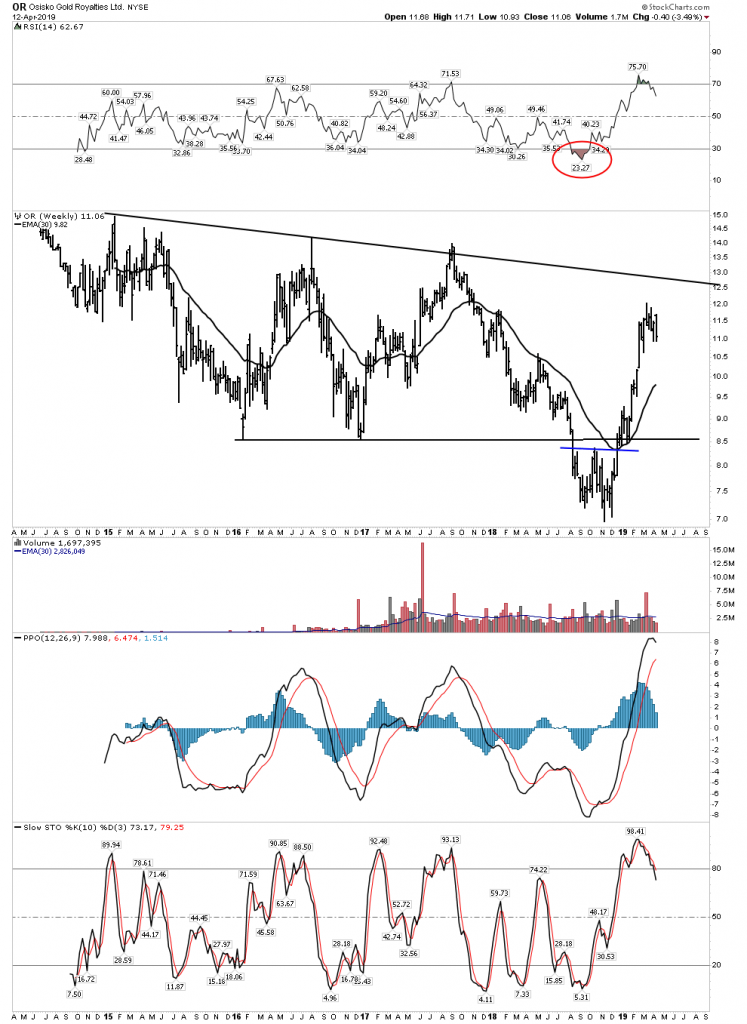
I have focused 50% of my investable funds in the royalty and streaming stocks. That’s a big chunk, but this is what the market is valuing higher right now. Later will come an emphasis on the major producers followed by the mid-tier. Later on when the bull market is fully recognized the juniors will be popping and on fire. Of course throughout the bull market there will be select juniors who have actual discoveries and experience moonshots.
Immediate Risks
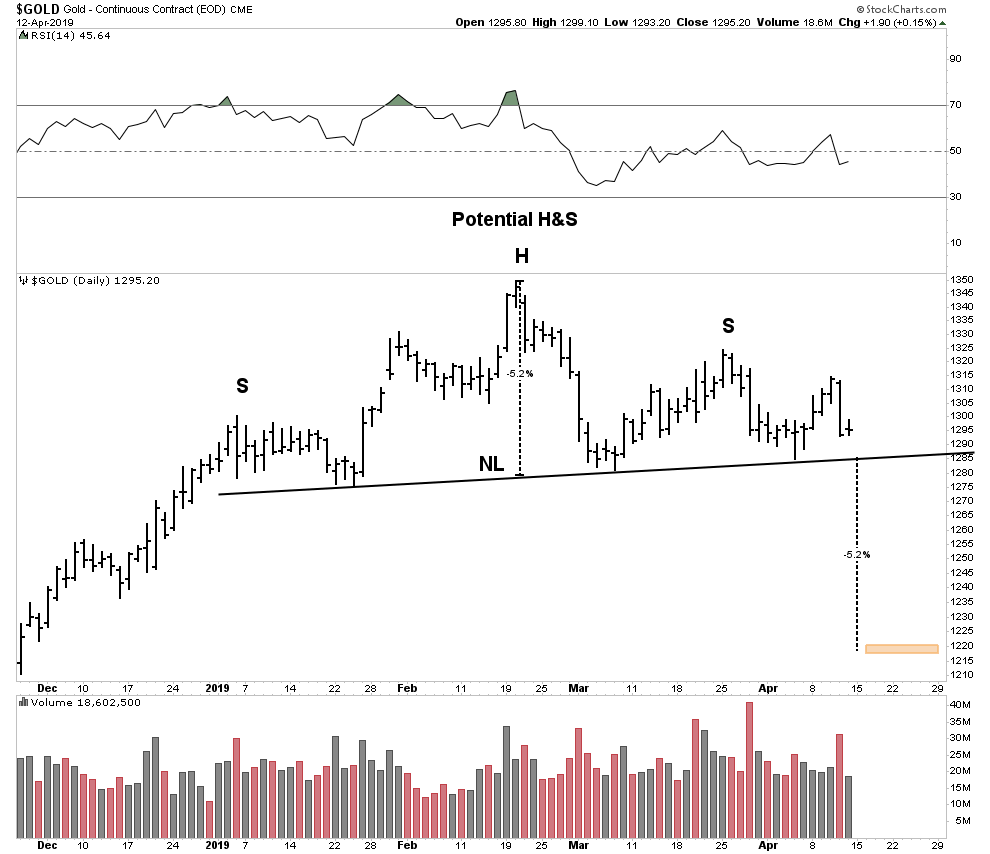
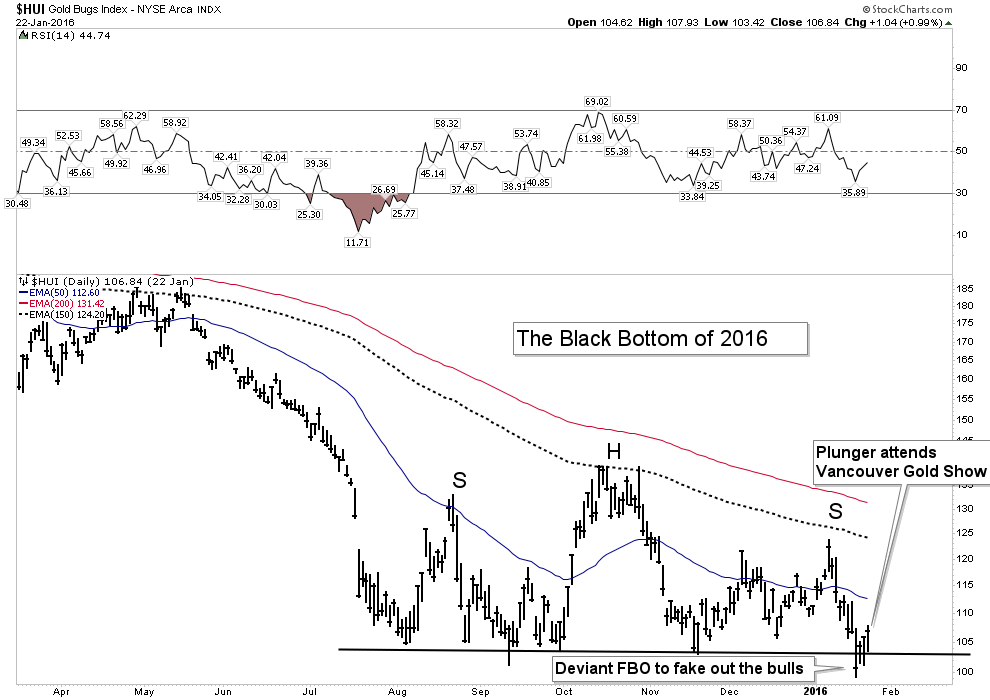
I have thinned down some of my positions slightly in case the market suffers a deeper drawdown than it has already. Previously I stated that I maintain a steady core position that I will not trade. I will not be caught on the sidelines in this bull market, but I can mitigate my risk by shaving off a bit when risk increases. Now is such a time. The below chart of gold shows a present danger of it breaking the potential H&S pattern. Recall it had the same set-up at the start of this bull market in January 2016. It did a marginal break to flush out the bulls then launched a vertical upward move.
FYI- Here is what the start of the bull market looked like in 2016. Sure looked like it was going lower instead. It was one of the markets greatest fakeouts:
Select Charts
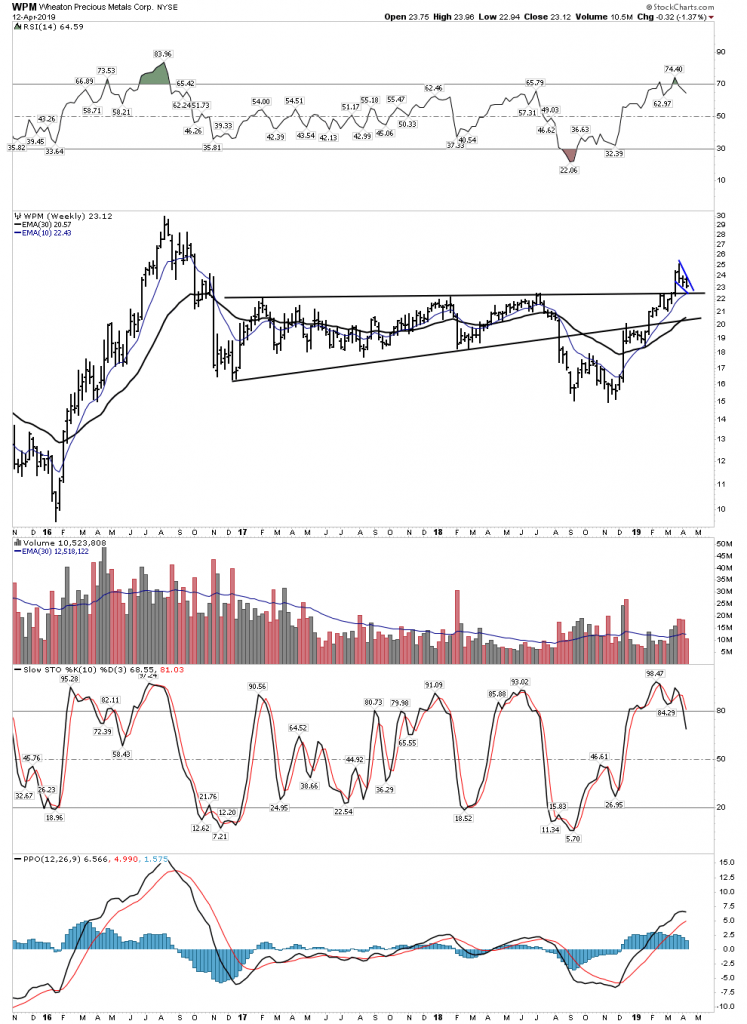
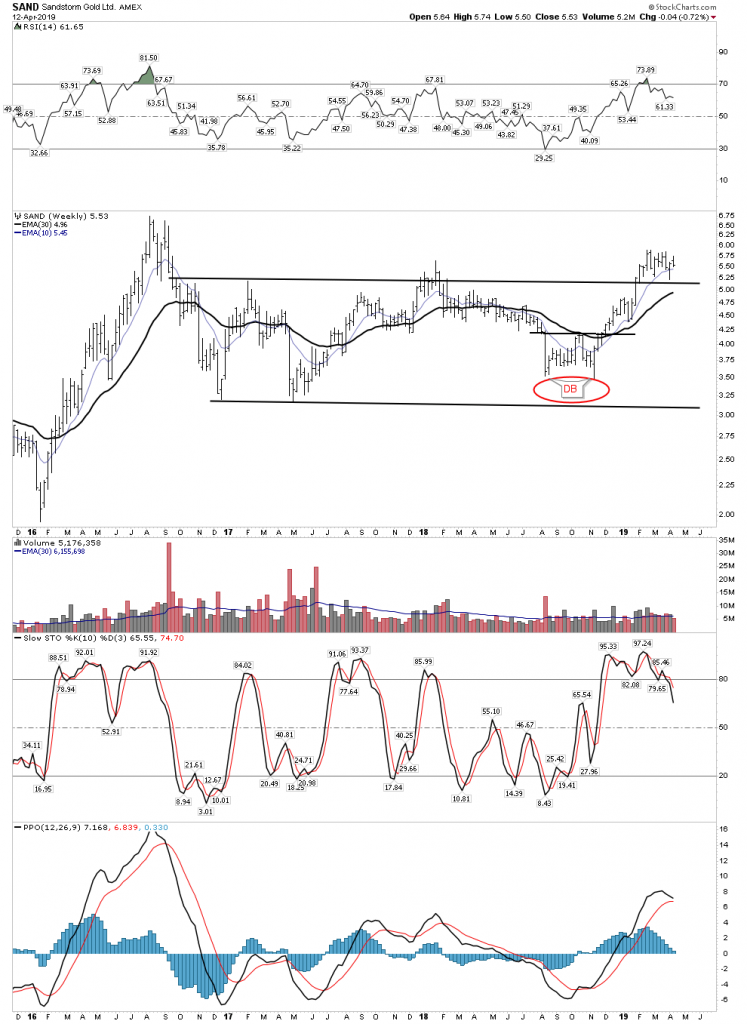
When viewing these charts think of the grand big picture. Most of these show mouth watering early stage advances coming off of large bases. A few years from now you will likely look back at this period as an unbelievable opportunity to buy in cheap. It is why I just can’t get enough of some of these stocks. I have seen this movie before and I have experienced the regret of not buying these kind of set-ups.
Above: we are right at the classic buy point. It just broke out and is now back testing support.
Below: Another case of churning right at the buy point.
Osisko-New Kid on the block. Deep Deep Value
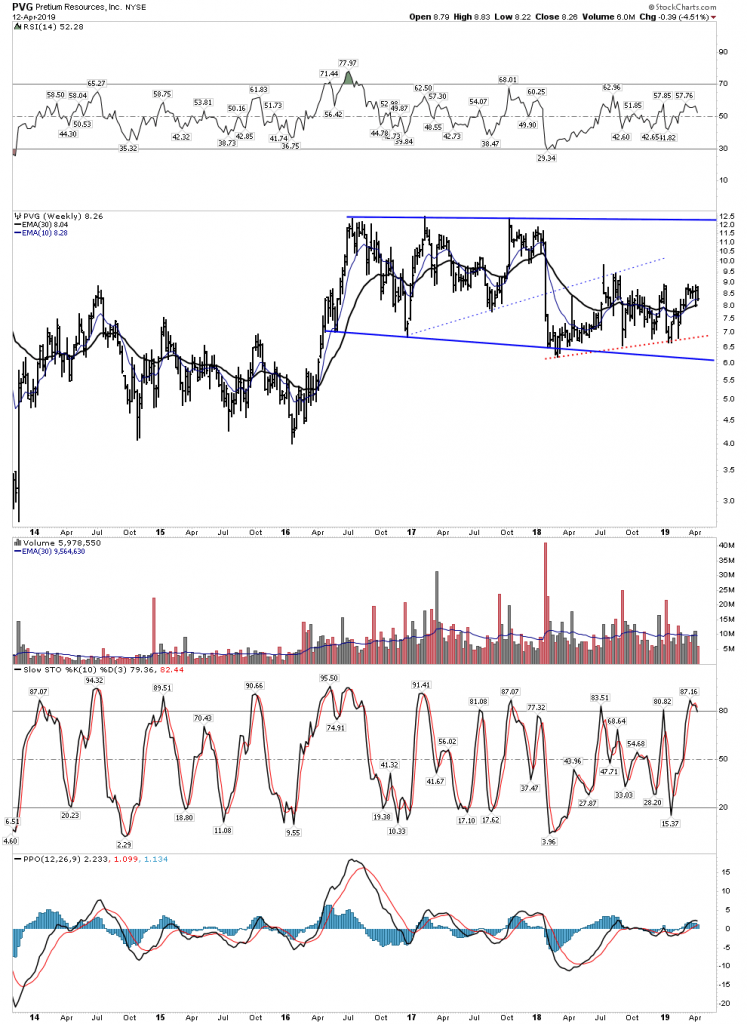
PVG- Just too sexy of a story not to forgive management for past failures
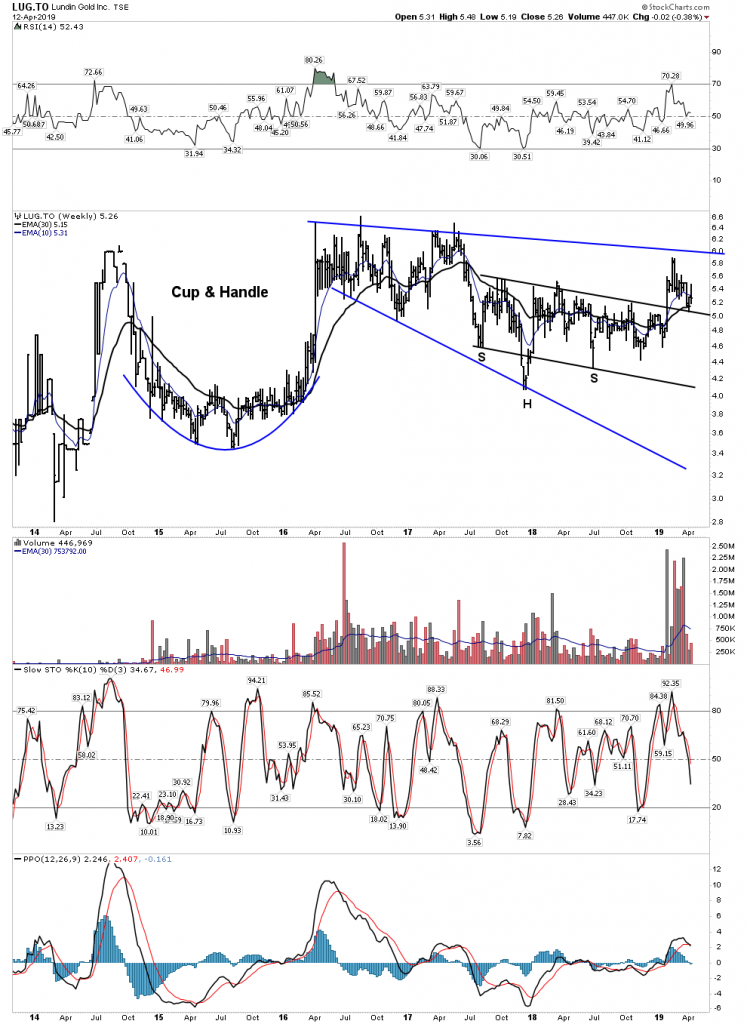
LUG- Consider this a mouth watering pattern because of what comes next.
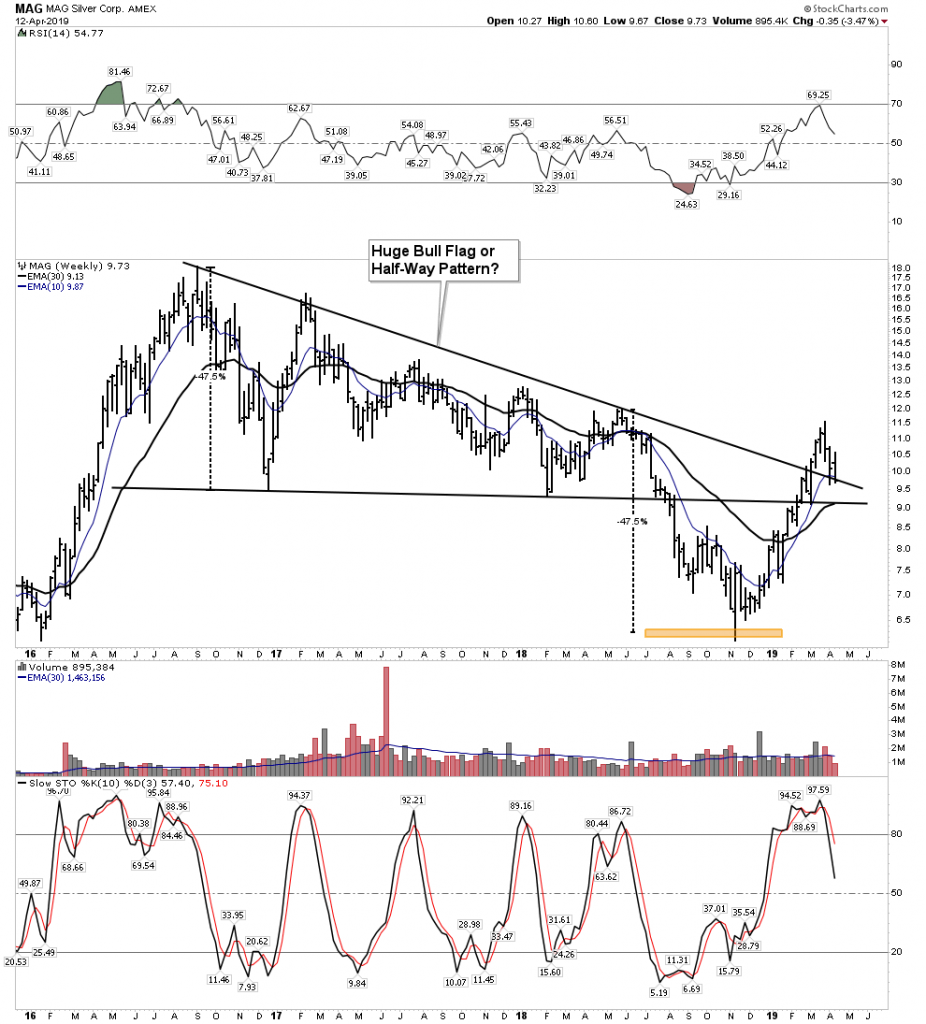
MAG– Tier 1 asset
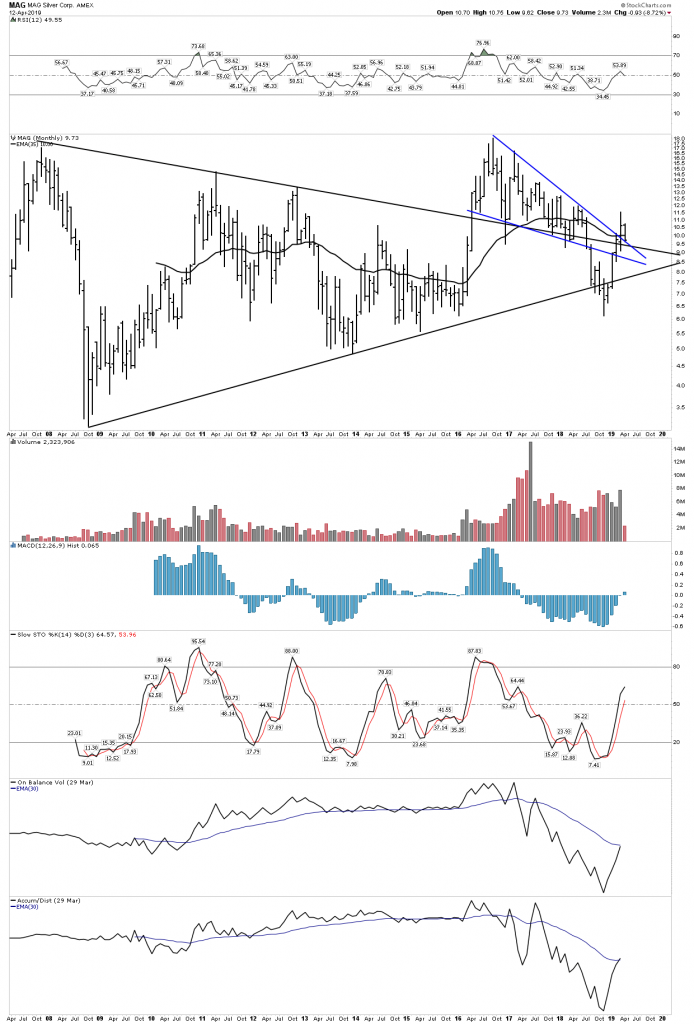
MAG Monthly– Again the buy point presenting itself on a platter.
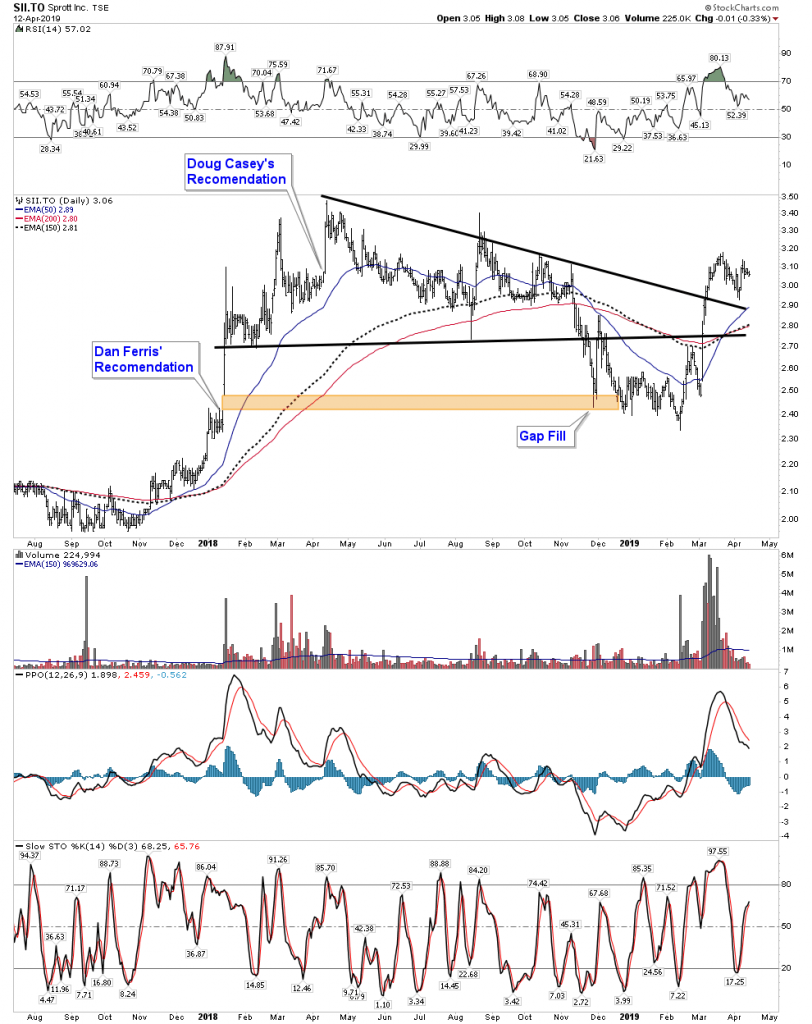
Sprott- My expectation is a10 bagger plus by the peak of the cycle 5-8 years.
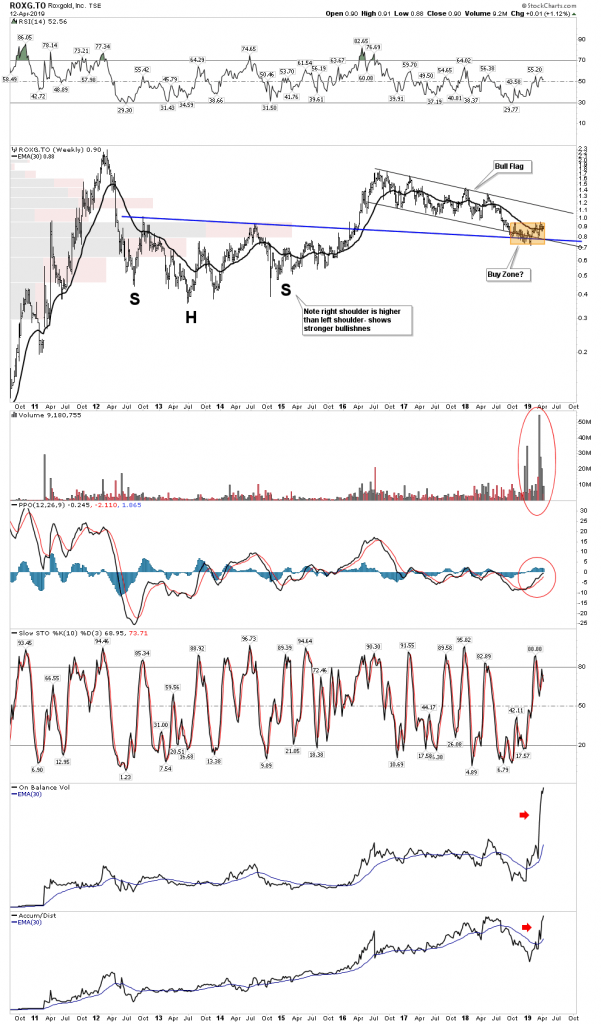
Roxgold– At the buy zone and check out the volume
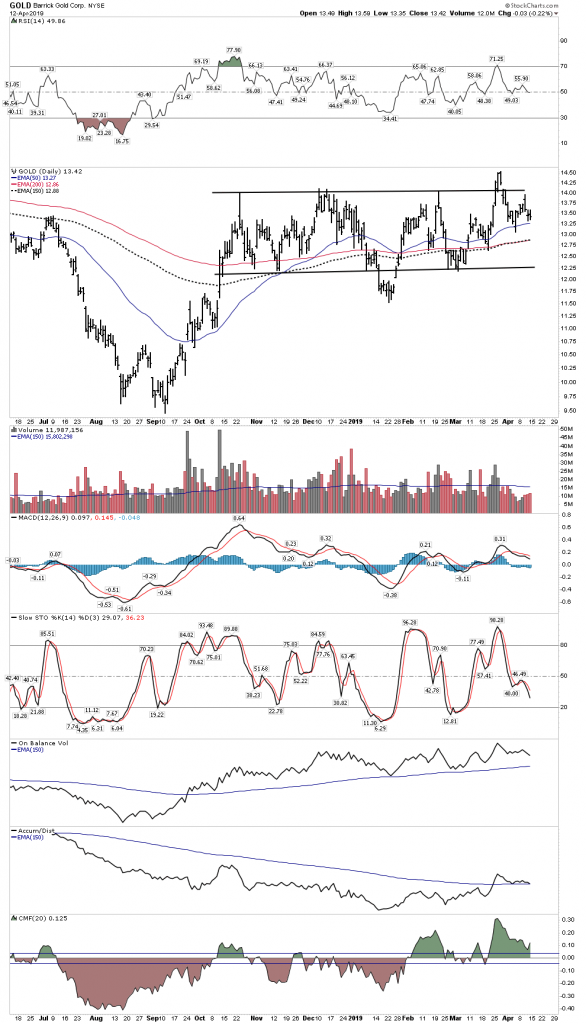
Barrick– Eventually will be regarded as a national treasure stuffed with Tier 1 mines. When it breaks out it will begin attracting serious institutional money
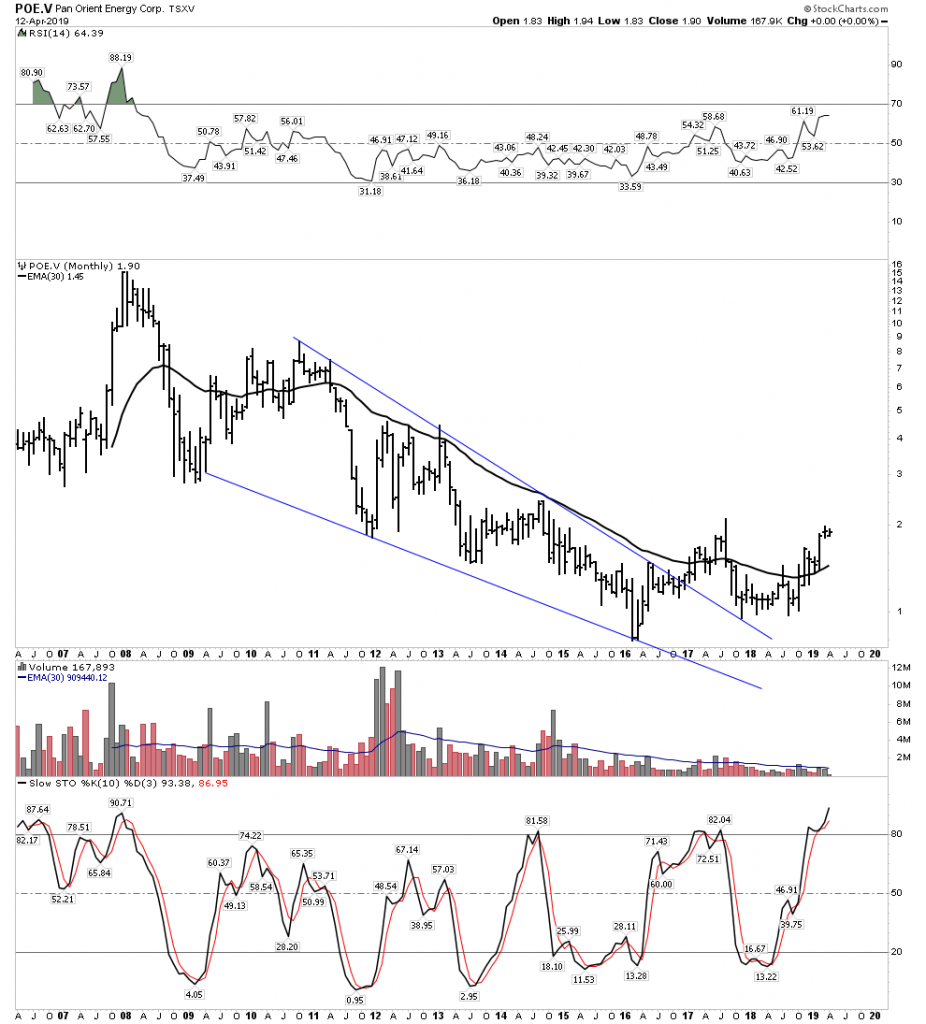
Pan Orient: Oil Discovery Play perking up after a long decline and base build.
The beautiful pictures go on and on. Charts at buy points where they broke out and are now back testing. However gold investors cower in fear and trepidation. While the correct strategy is to be right and sit tight Mr. Market throws in a kicker by offering up the Rare Gentleman’s Entry.
Who’s got the guts to take it?
The Gentleman’s Entry:

