Tonight I would like to finish up with the long term secular bull market we discussed in the Weekend Report for the US stock markets. Long term secular bull markets just don’t begin and end for no good reason. There has to be a catalyst that drives the markets higher over a long period of time.
Part 1 : https://rambus1.com/2020/07/05/weekend-report-213/
When the previous secular bull market began at the 1974 bear market low no one could have imagined then what was about to take place over the next 25 years. The news from a fundamental perspective couldn’t have gotten any worse which is the case at an important low. Even during the first 10 years of the bull market no one could have known that one of the greatest bull markets of all time lies ahead except for maybe a few tech geeks who understood some of the technology that was being born.
The 1980’s was the birth of a new technological revolution that everyone takes for granted today. Computers were only for big corporations that had the man power and money to run them. The average person in the early 1980’s may have heard of computers but the internet, what is that? Again, the average person back then didn’t have a clue of how the new technological revolution was going to change their life.
There were stocks likes MSFT, Dell Computer, CSCO and a host of other stocks too numerous to mention that began life as an embryo back then. By the time the 1990’s rolled around some of the winners like AAPL and MSFT for instance started to become familiar names in the trading community. I can’t remember how many times I traded in and out of APPL and MSFT not having a clue of what they would eventually become.
As the 1990’s wore on more and more names in the tech sector became better know to the average investors. People were finally beginning to realize that something major was taking place that was going to change lives in ways no one back at the bottom in 1974 could have imagined. Once the realization sunk in that life as we knew it was going to profoundly change the way we do things began the bubble phase that lasted from 1995 to 2000.
During those last 5 years was the craziest times to be an investor. Every week a new IPO would come to market which was advertised to open up at say $25 but on the day the IPO became public it would open up over $100 dollars or higher. This went on for most of the 5 year parabolic run into the 2000 top. Many of the new IPO’s had no earnings or had any prospects of having any earnings that were bid up into the stratosphere on pure speculation. It was that mania phase that I’ll never forget. We haven’t even come close to those days in our current secular bull market.
For me personally, there was a chip stock that had a patent that was going to make this company more money than anyone could imagine. They were going to get royalties from just about ever chip maker in the world or so the story goes. In the last 2 years of the bubble phase I traded this stock called, Rambus, exclusively. It would go up and double and then split 2 for one and then go right back up again and split again. If you think the junior miners can be volatile they don’t even come close to what Rambus, the chip stock was doing. The end came for me in early 2000 when RAMBUS the chip stock, more than doubled and then split 4 for 1 taking the price back down into the mid 50’s. In a matter of a couple months it had almost tripled and got up to the high 130’s where this time I wasn’t going to take any chances and called my broker, because online brokers were just being born. I put in a hard sell/stop in the high 120’s and let the chips fall where they may. It was just a couple weeks later that my sell/stop was hit and as they say, the rest is history.
That was a life changing experience for me that allowed me the financial freedom I still enjoy to this day. It wasn’t easy as the volatility could be massive but the Chartology never let me down. Big gains don’t come from being timid in the stock markets.There is a time to be cautious and then there are times to be aggressive. Knowing which one, comes with time. I’ve had 5 life changing events the stock market has offered me and in each case I had to be aggressive to get the results I was looking for. Please keep in mind this is my psychological makeup and is NOT for everyone.
Now I would like to discuss our current secular bull market that began at the 2009 crash low. If you were trading the stock markets back then you know it felt like the end of the world and the next great depression was upon us. Most investors that got caught in that bear market were scarred for life and will never trust the stock markets again. They will never be able to look at the stock markets objectively ever again. When we get to the mania phase of our current secular bull market they will finally give in and feel it is safe to start trading again because the profits will be too big to ignore. Same story but different time frame.
Everybody knows the FANG stocks now like the back of their hand but I can assure you that there are going to be new FANG type stocks that are just being born right now as we speak but very few investors have a clue of who they are right now. As time goes on they will start to emerge from the darkness one by one until they become a household name. The key is to understand the new technology that is going to change our lives in ways we can’t comprehend right now.
Our current secular bull market is now over 10 years old and we should start to see the emergence of some of the companies that are going to lead us into the future. The last secular bull market was the birth of technology which had a profound impact on our everyday lives. The current secular bull market is also going to change our lives in ways we can’t even imagine yet. Artificial intelligence, robotic, super computers, to name just a few. Then there is the biotech arena that is going to find a cure for cancer, heart disease, and extending the average lifespan again, to just name a few. There will be new technologies that we can’t even comprehend right now that are going to emerge from the shadows of the new technologies that are just getting their feet wet.
I probably seem naive to many of the harden bears that can only see the dark side of life and politics that so permeates our society right now. Even with all that is going on right now in the world it will not change the evolution of the profound changes that are coming our way whether we like it or not. It’s these new technologies that are driving this secular bull market that can’t be stopped no matter how hard we try. The human species is the only animal on the planet that keeps on improving life for the better which is part of our DNA. Just think of how much progress we’ve made in the last 100 years. Now with super computers and artificial intelligence the speed at which change comes will be much faster than most can imagine. Anyway my cup is always half full regardless of all the negativity that we are seeing all around us.
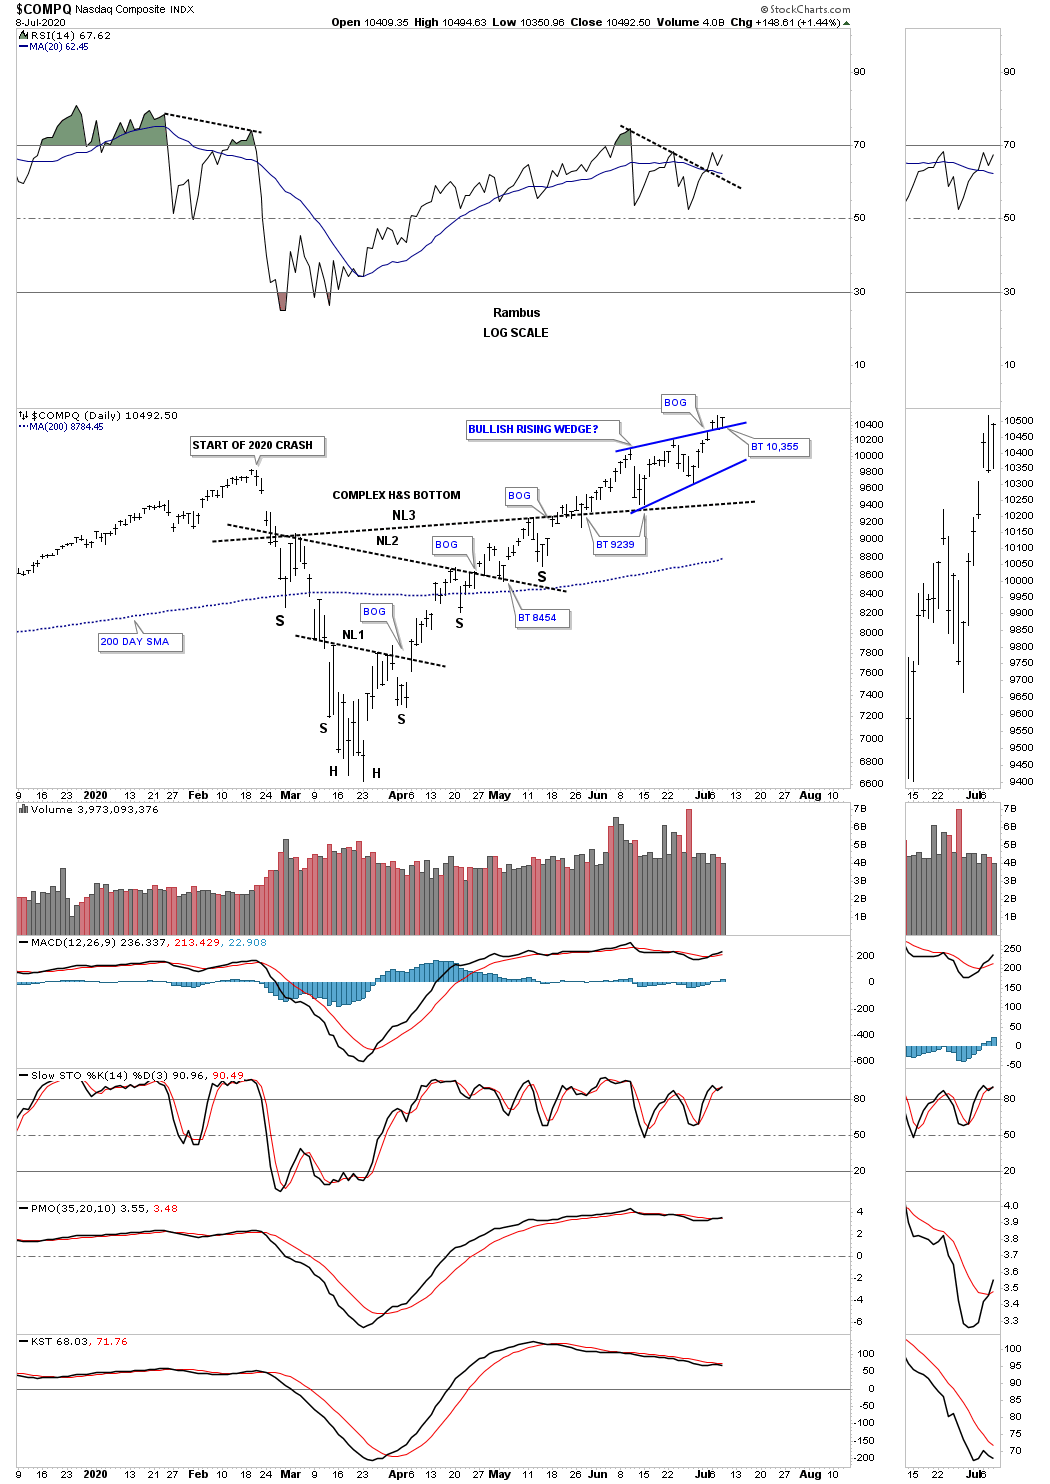
Lets look at a few more charts which are suggesting that our current secular bull market is not dead yet. This first chart is the daily look at the COMPQ which is backtesting the top rail of its blue bullish rising wedge.
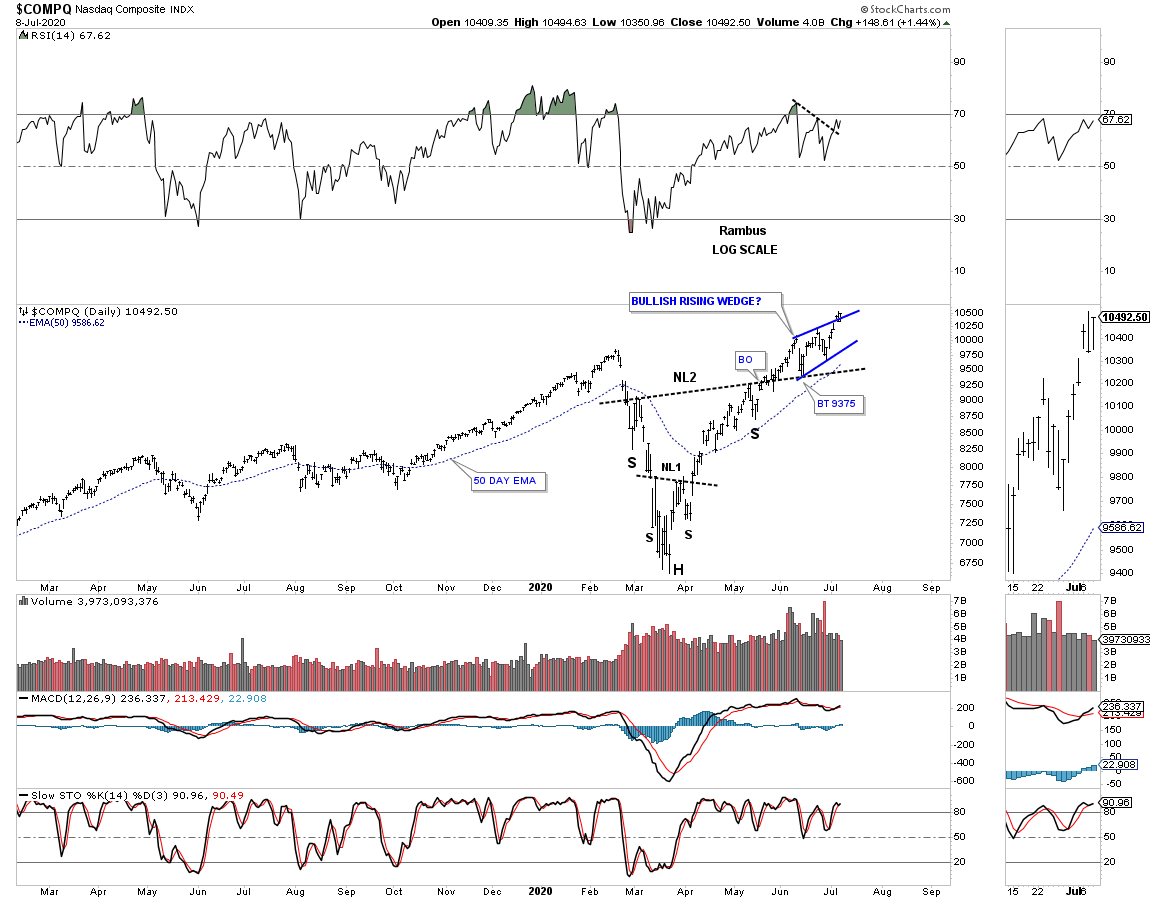
The longer term perspective with the blue rising wedge forming the backtest to the neckline.
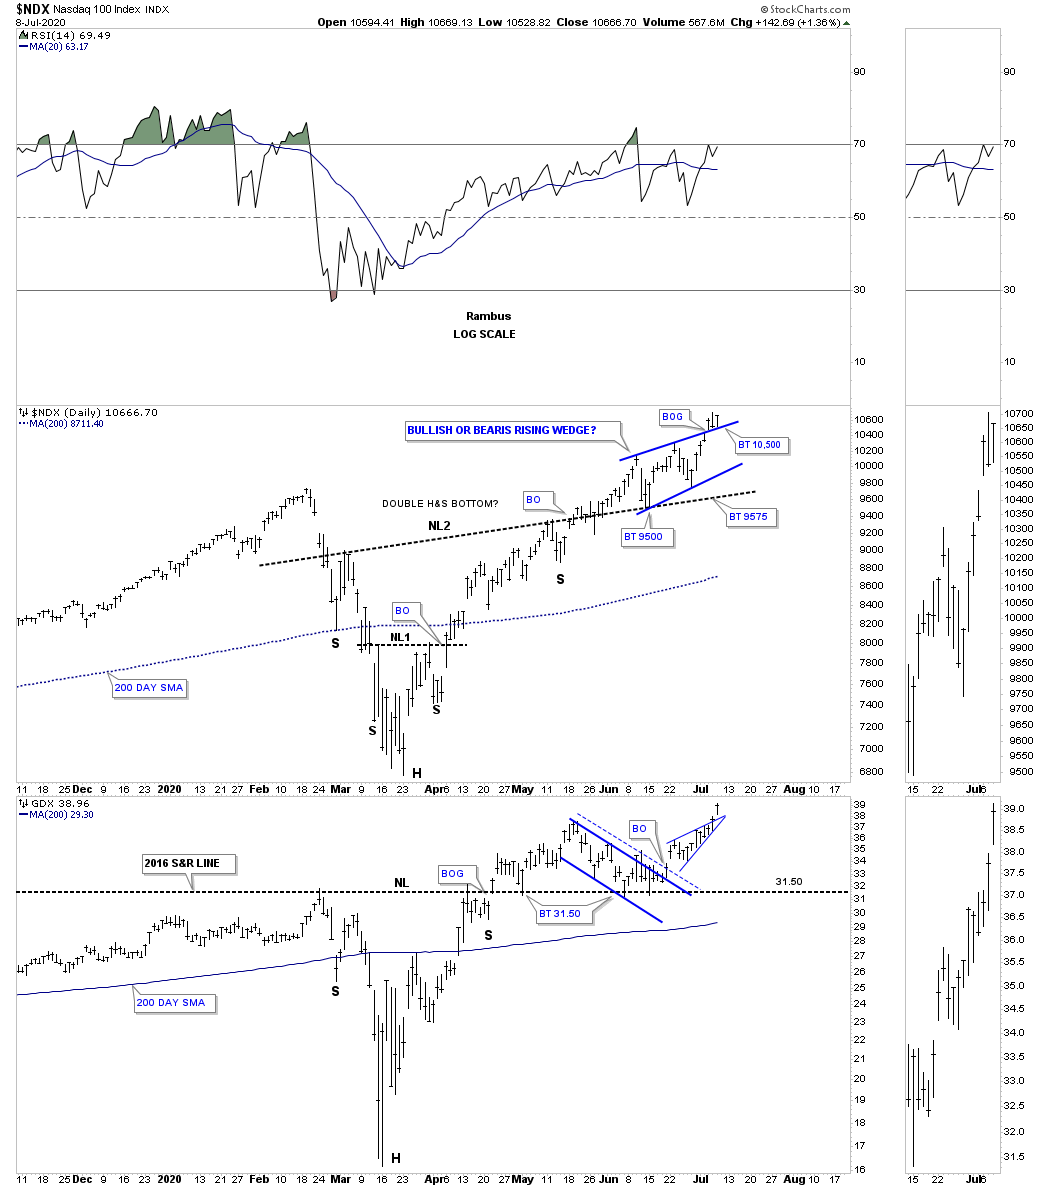
Below is the NDX and GDX combo chart we’ve been following which shows a pretty positive correlation taking place.
Below is a daily combo chart which has some FANG stocks with GLD on the bottom. Again some pretty close positive correlation.
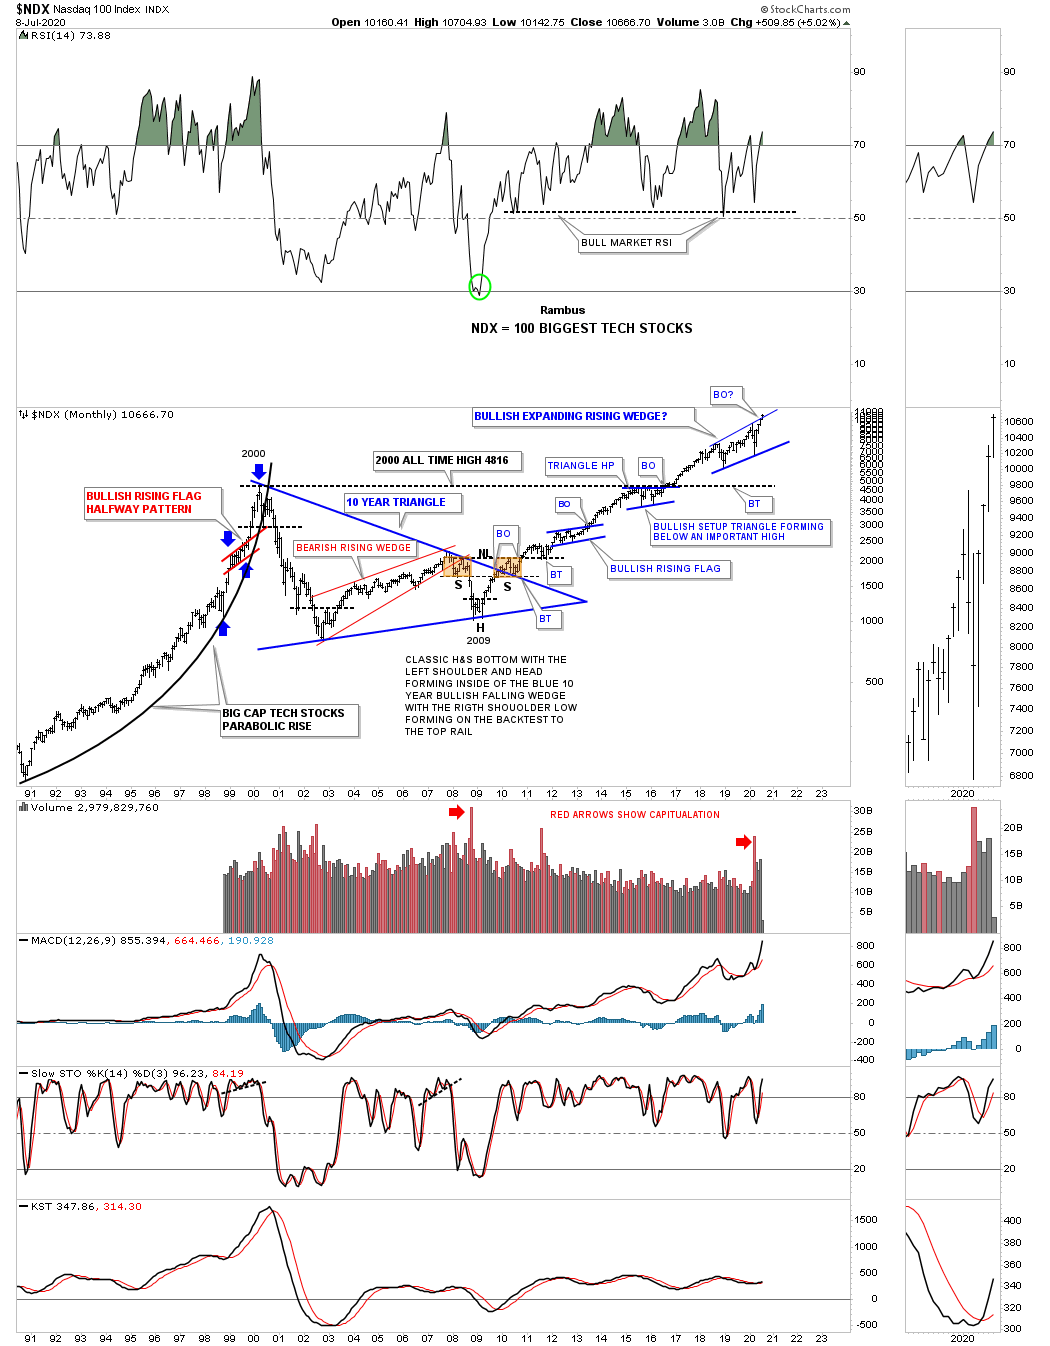
Is this long term monthly chart for the NDX showing us just another consolidation pattern in the 2009 secular bull market? As you can see the price action has completed the all important 4th reversal point. Note the capitulation volume at the 2009 crash low and the 2020 crash low.
The long term daily chart for the SOX.
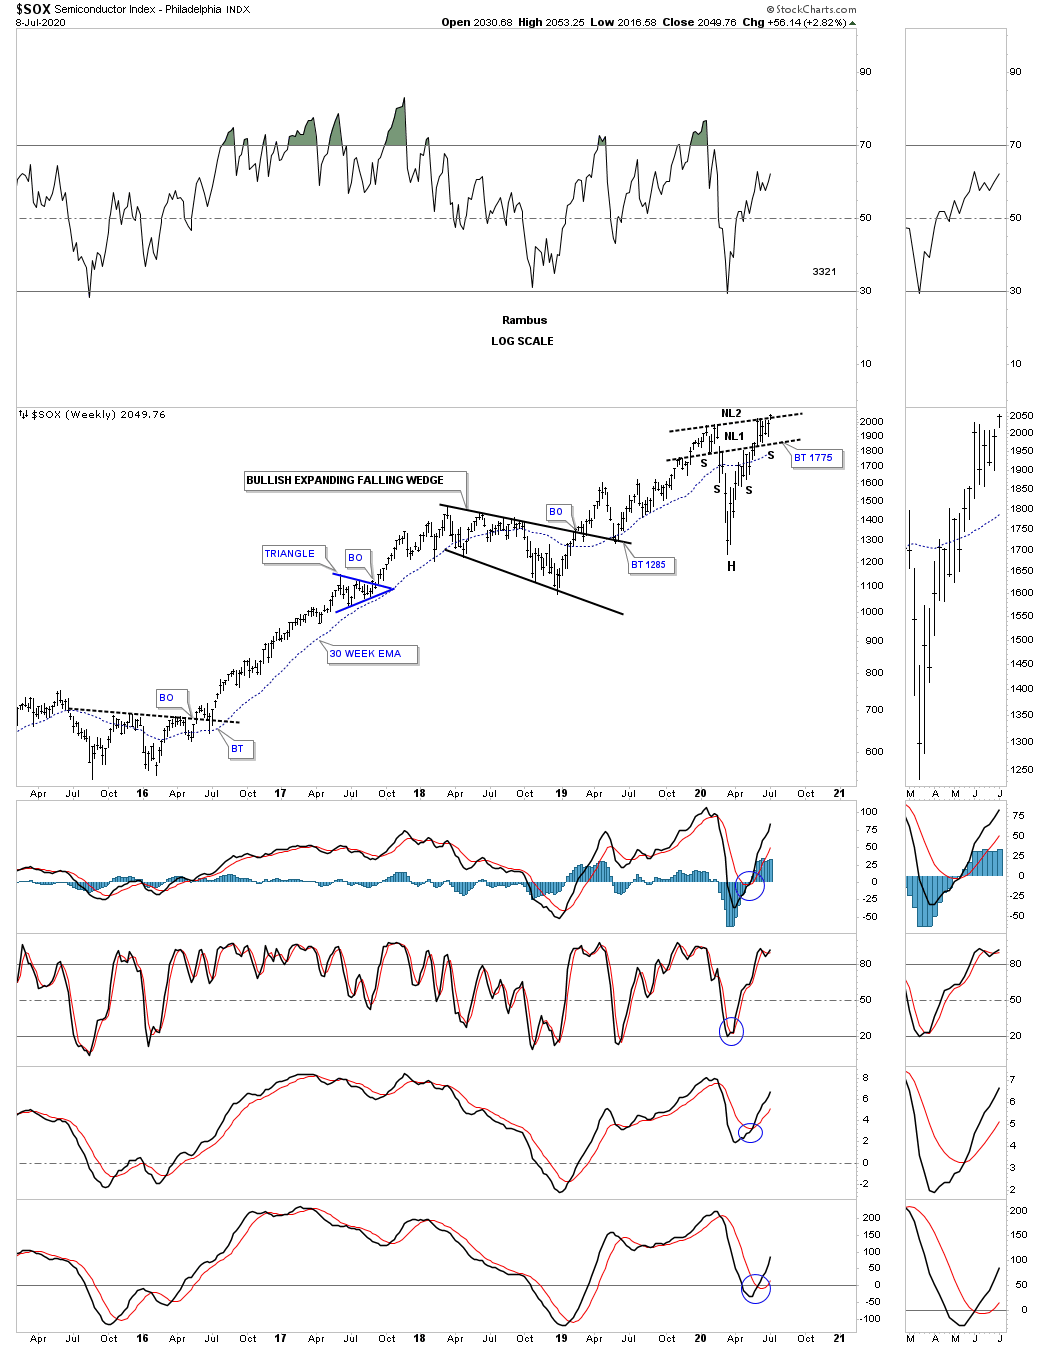
The long term weekly chart for the SOX for perspective.
What is the difference between these black consolidation patterns vs the ones we’ve been following in the PM complex? Nothing.
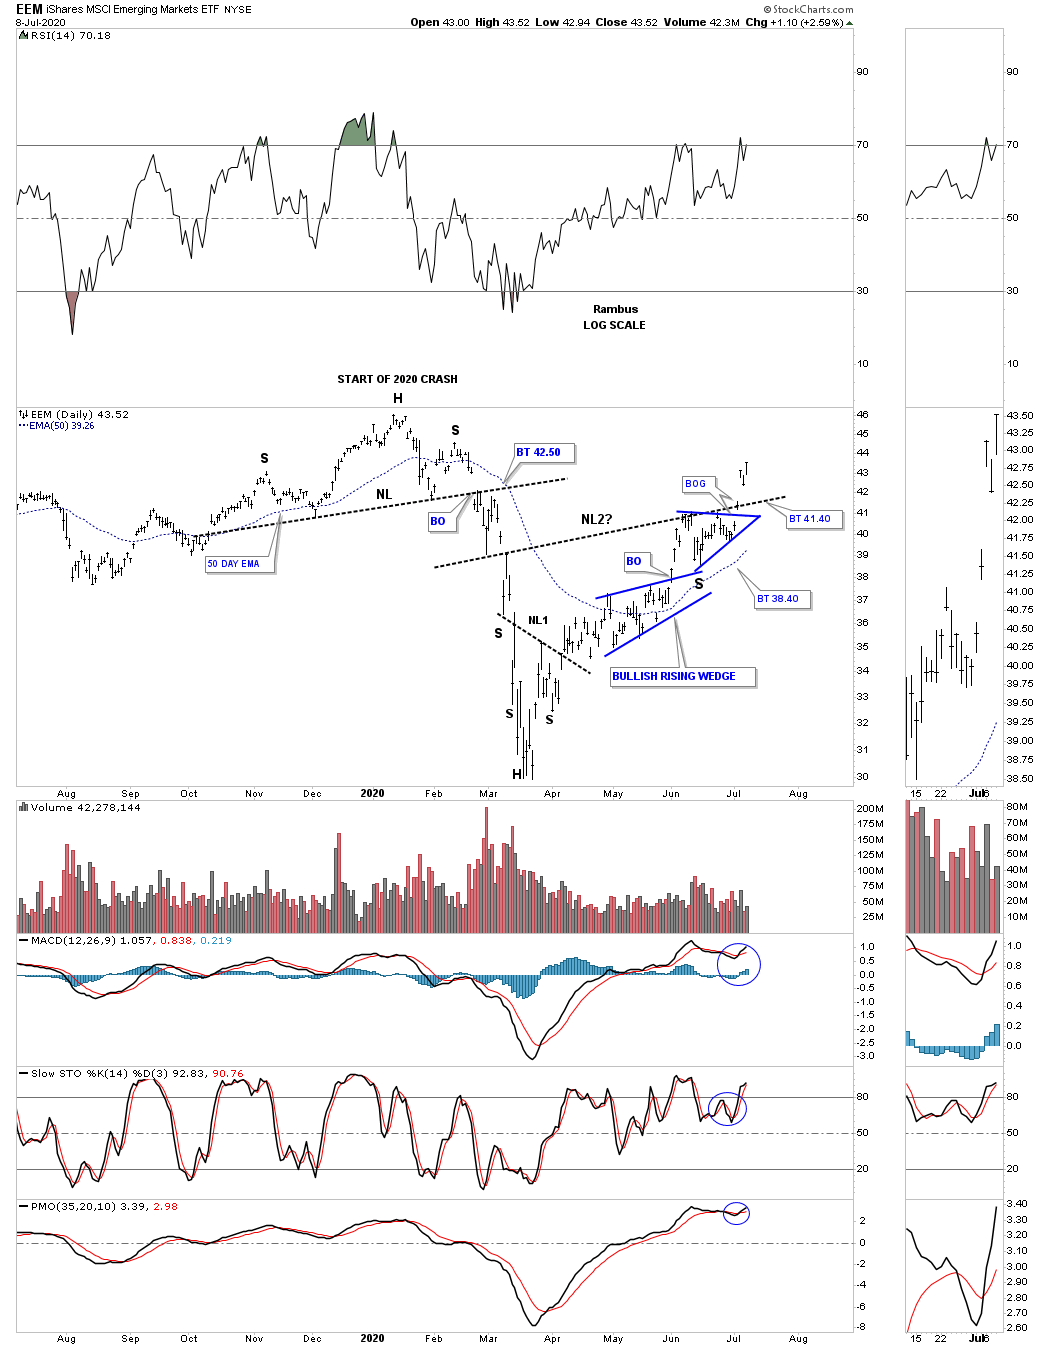
We are not going to be the only stock market that continues to moves higher as this secular bull market takes hold. Monday of this week the EEM, emerging markets, gapped above its double H&S neckline.
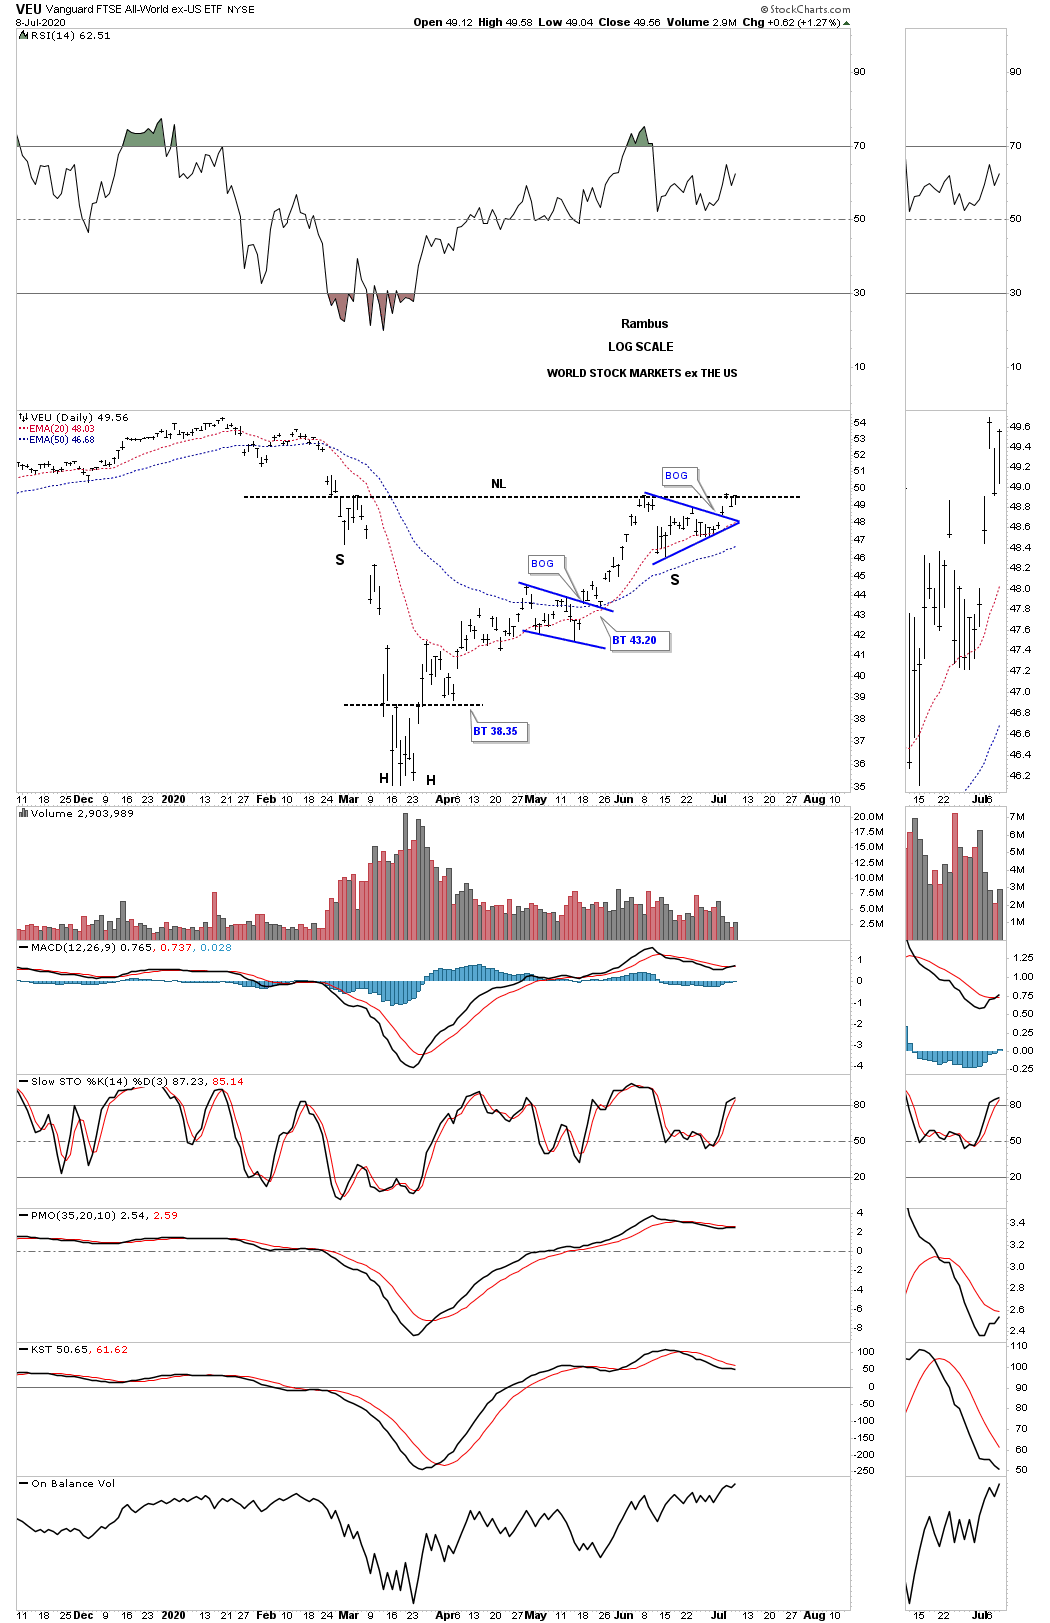
Next is the VEU, all world stock markets ex the US stock market. After breaking out of its right shoulder blue triangle the price action is now testing the neckline.
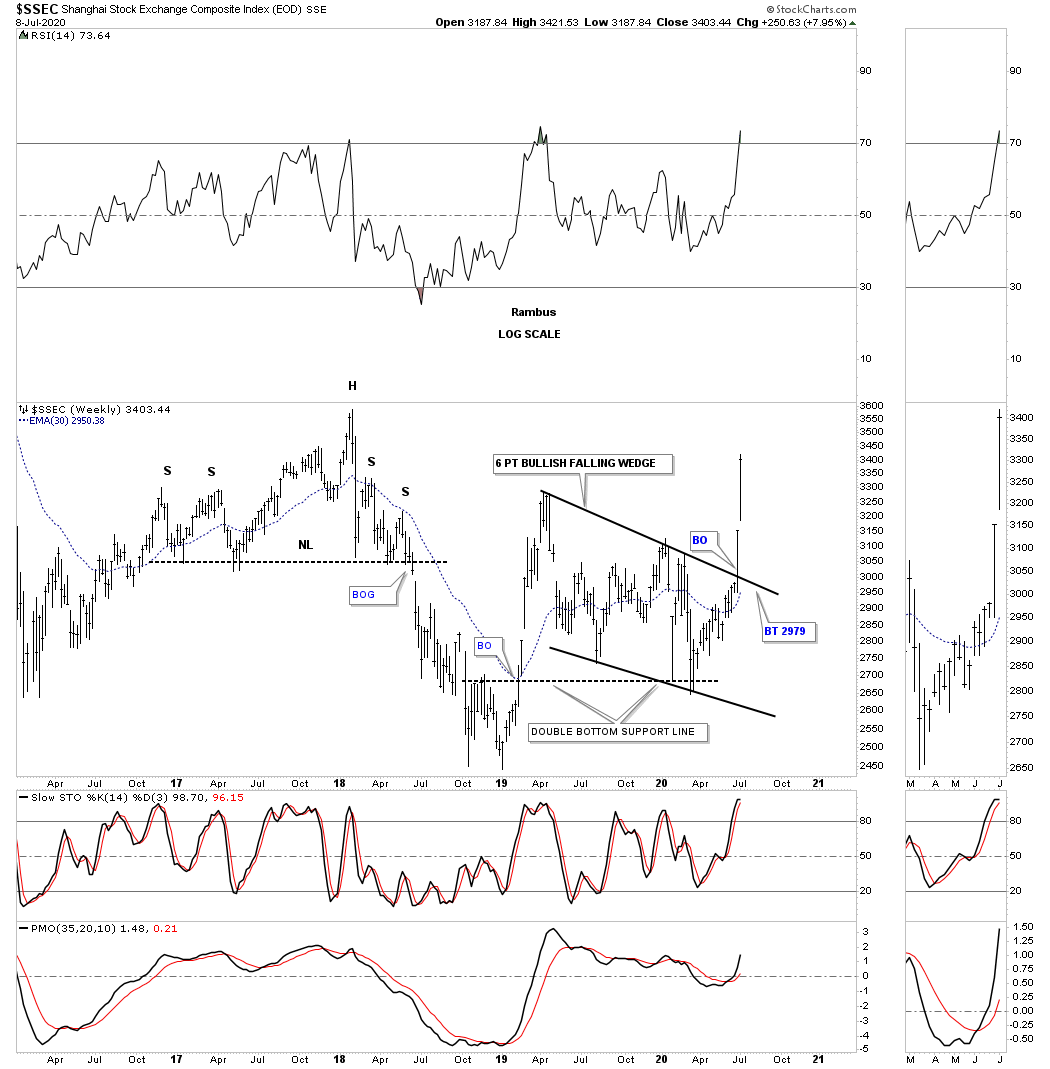
The SSEC, Shanghai stock market, has come to life over the last 2 weeks.
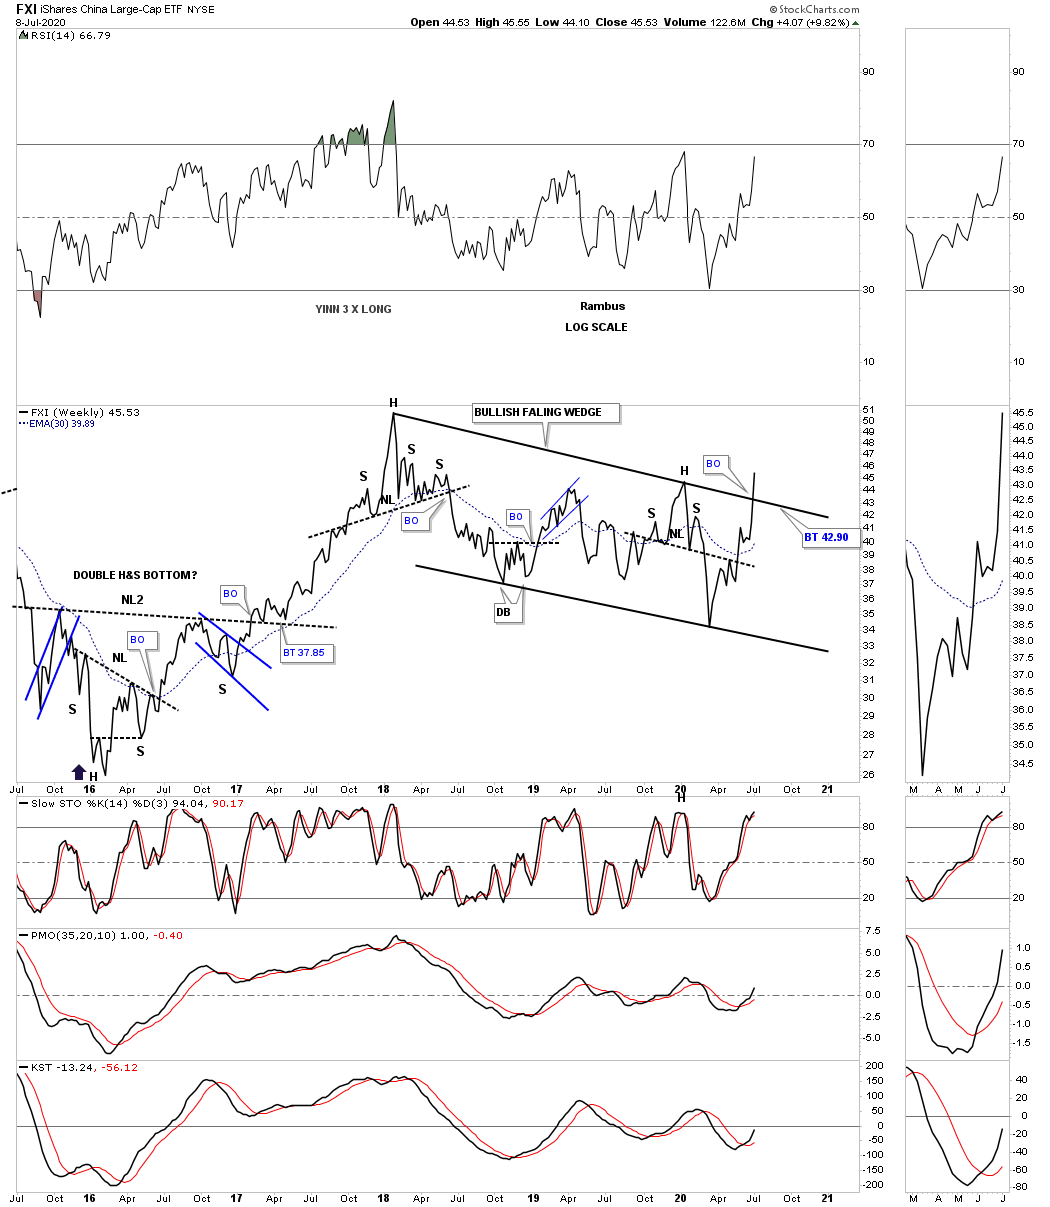
The FXI is the China big cap etf which is breaking out from its bullish falling wedge.
The NIKK is slowly getting close to the the top rail of its flat top expanding triangle.
The ITB, US home construction etf, has broken out of the possible right shoulder triangle.
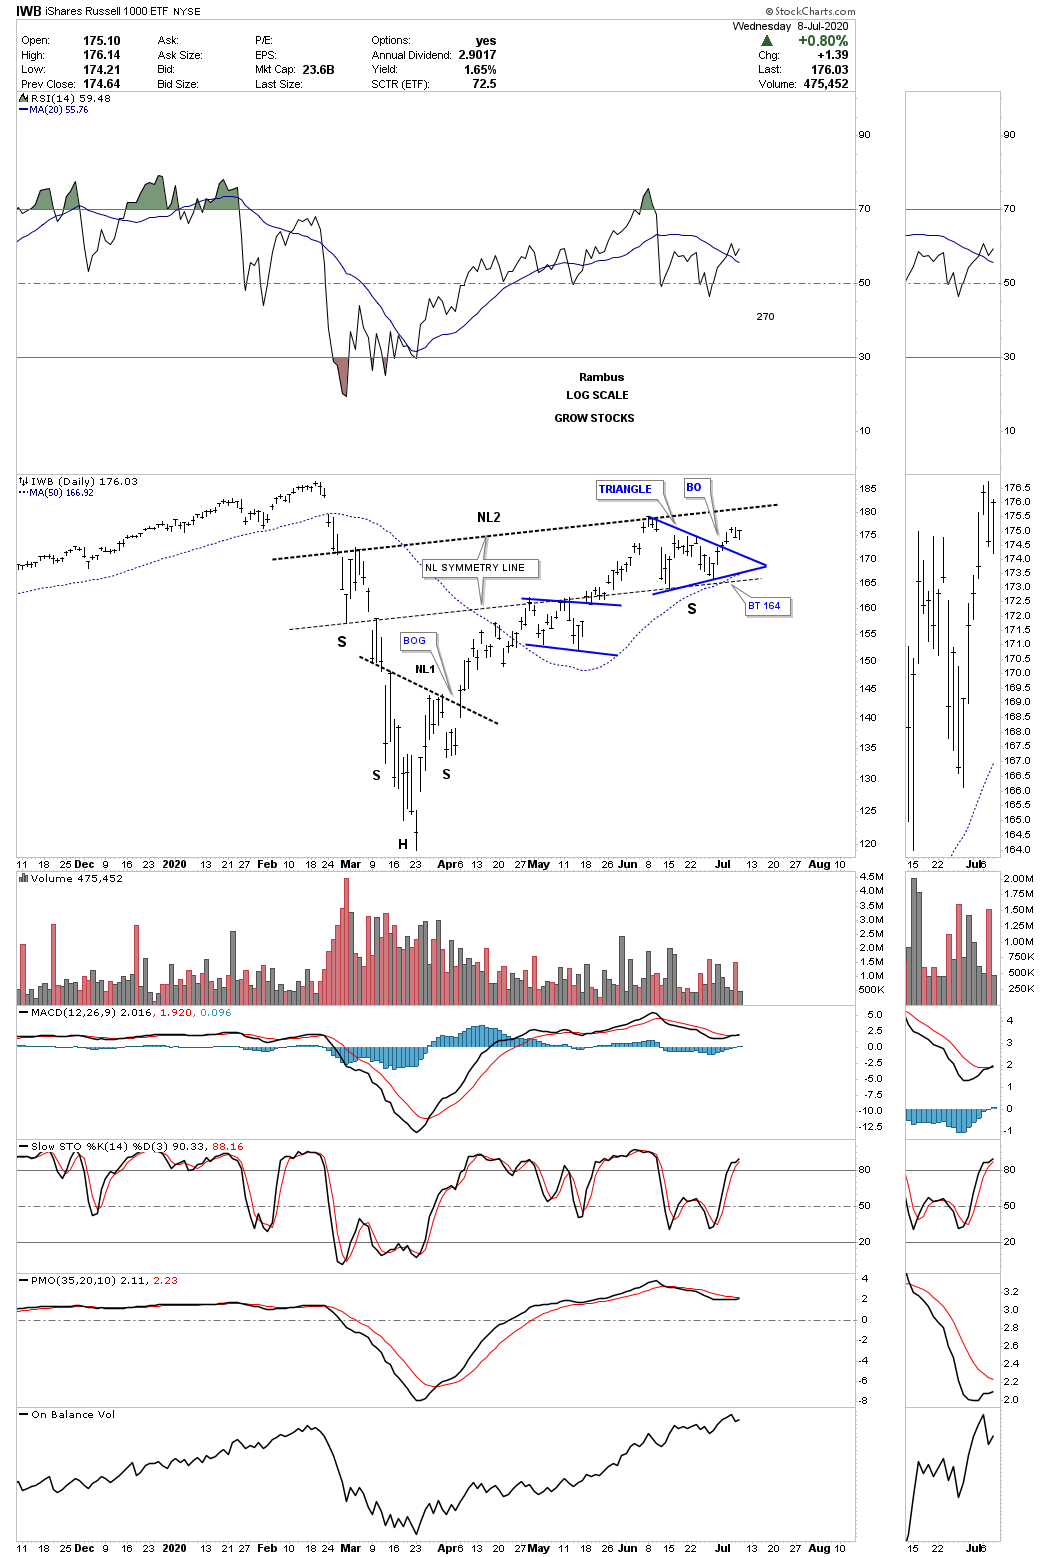
The IWB, Russel 1000 growth etf, has broken out of its possible right shoulder triangle consolidation pattern.
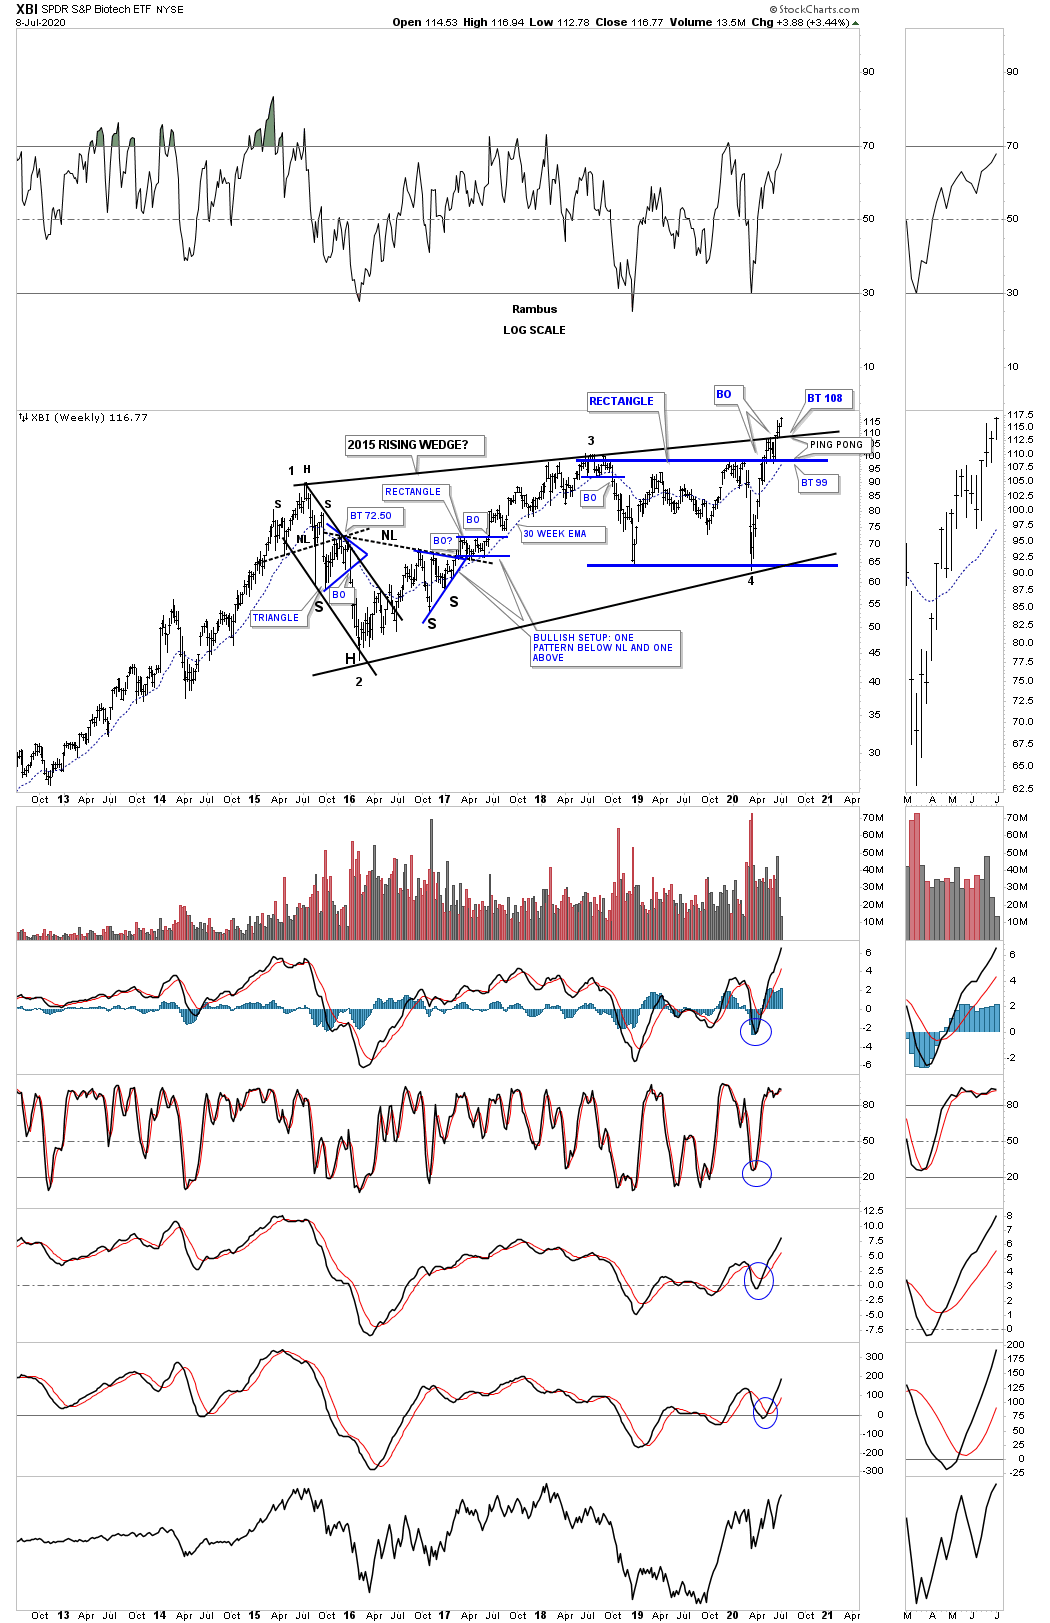
This weekly chart for the XBI, biotech etf, is still producing some great Chartology with the breaking out and backtesting of the important trendlines and making a new all time high today.
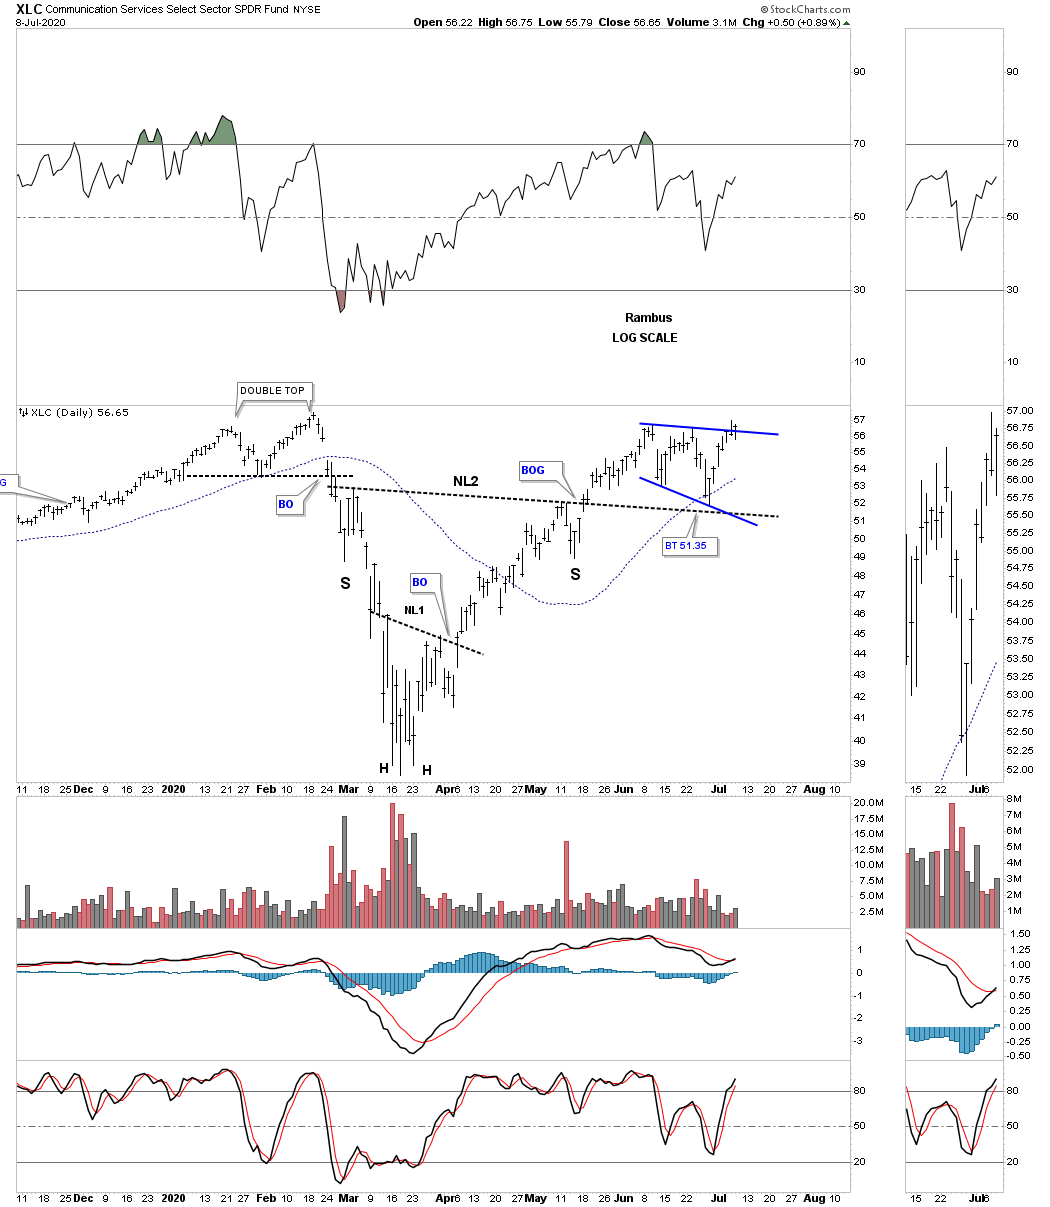
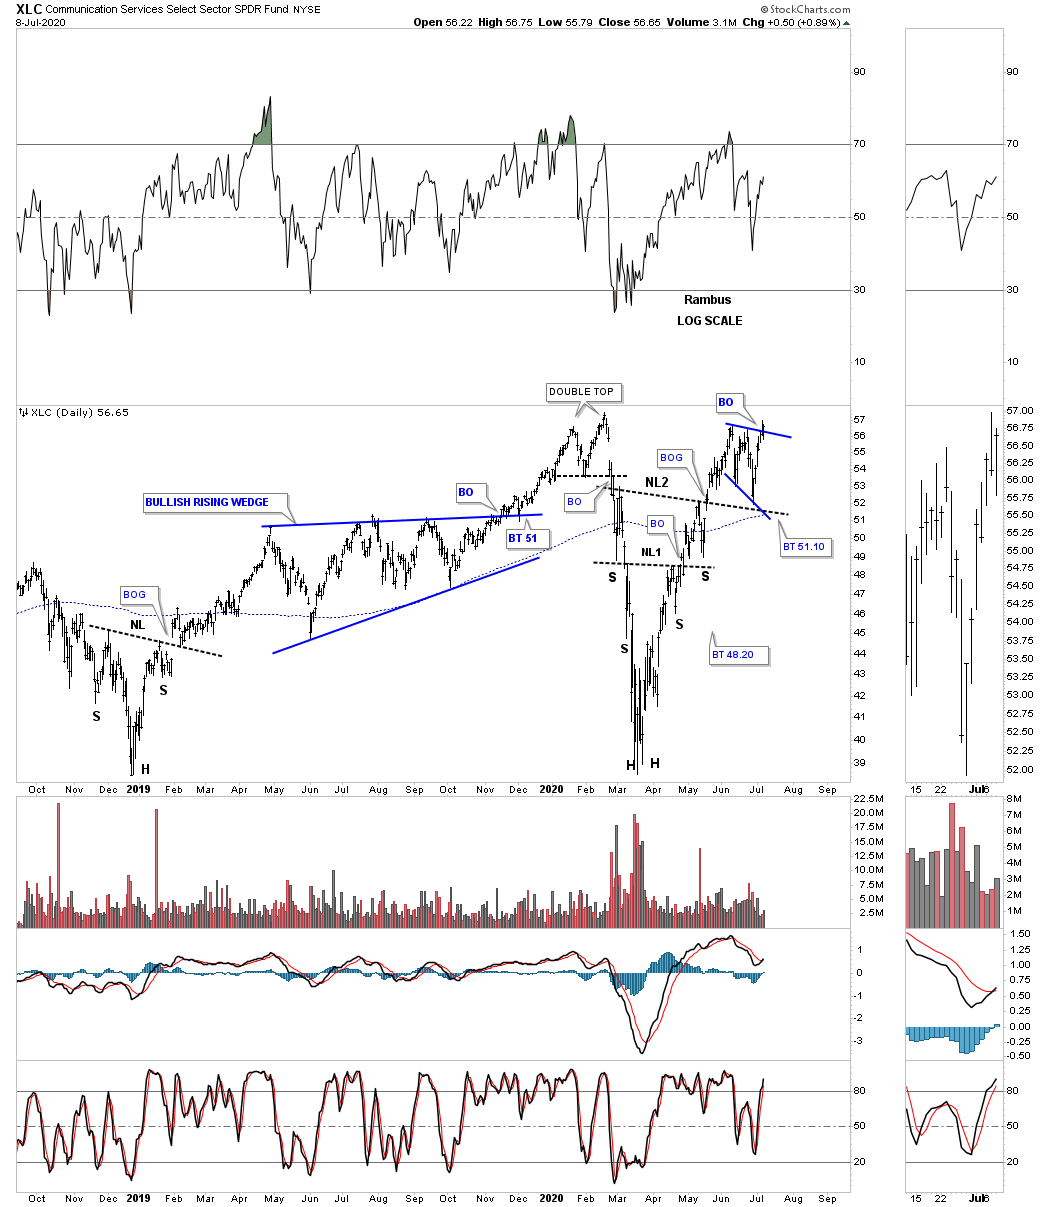
This daily chart for the XLC, Communications service fund is breaking out from its bullish expanding falling wedge as the backtest to neckline #2.
The long term daily chart for perspective.
Just like many of the right shoulder triangle patterns we’ve looked at tonight the XRT, Retail etf, broke out of its possible right shoulder triangle late last week.
This last chart for tonight is a combo chart which has the XLY on top with the SPX on the bottom. Normally when the XLY is doing good so is the SPX.
So far there is nothing in the charts that is suggesting the end of the secular bull market that began at the 2009 crash low. We will have more confirmation when many of these potential H&S bottoms finally breakout above their necklines. Once that occurs there should be no doubt in our minds that the next impulse leg in the secular bull market is truly underway. All the best…Rambus

