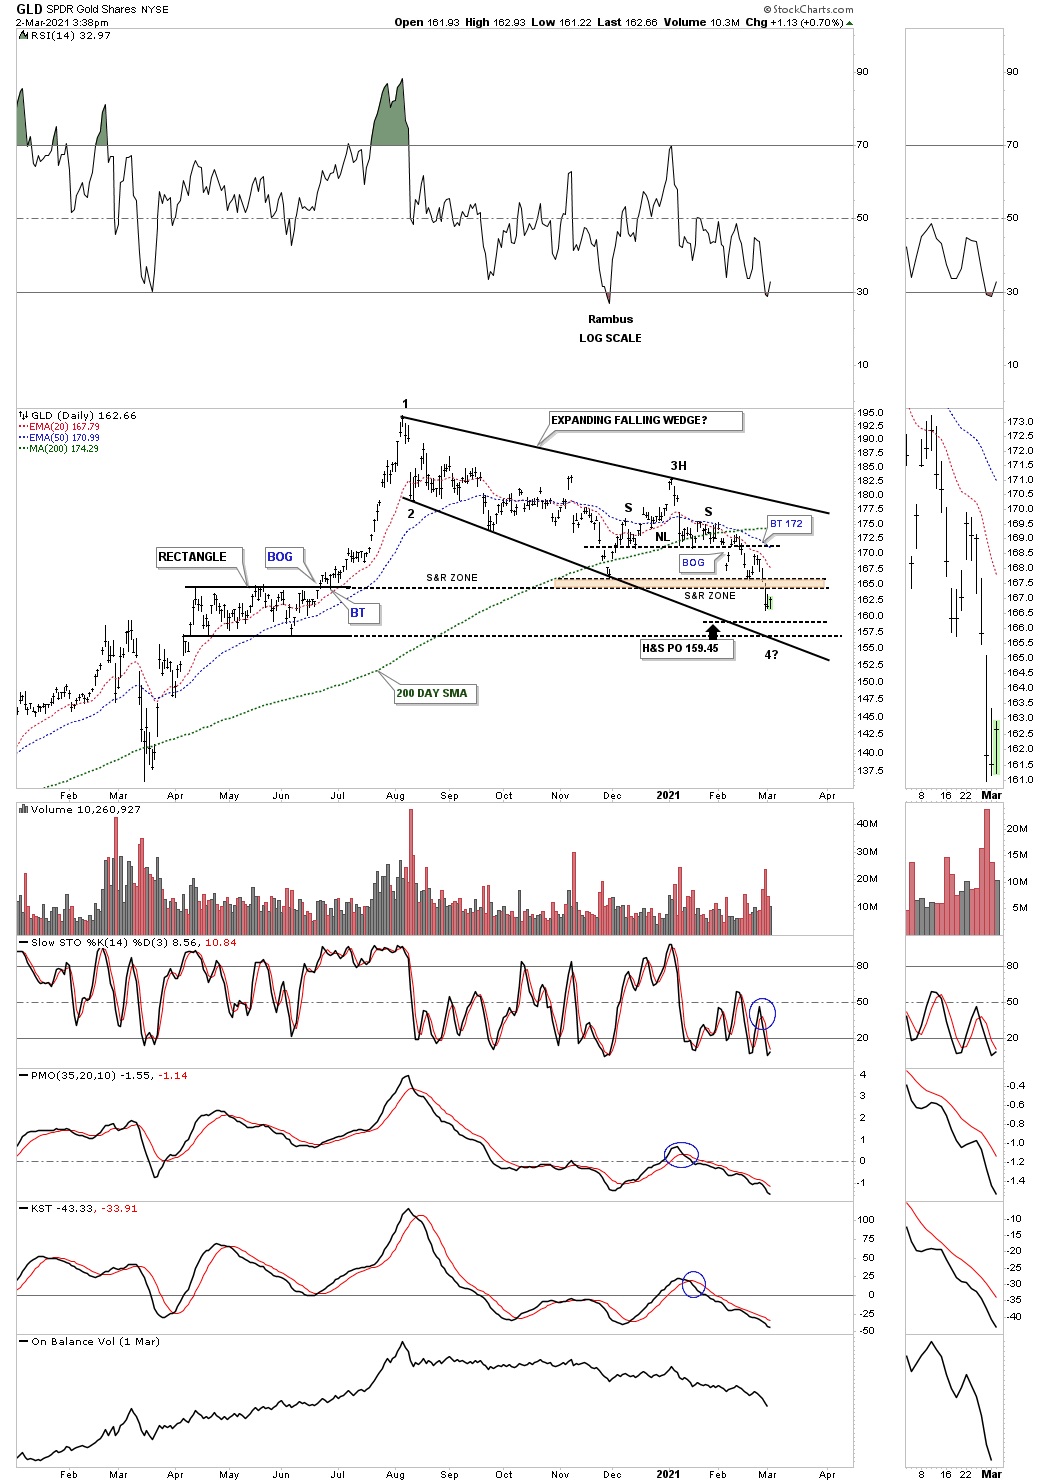
The recent volatility continues today in the PM complex. Another day of sideways trading in the daily bar combo chart showing the August expanding falling wedge.
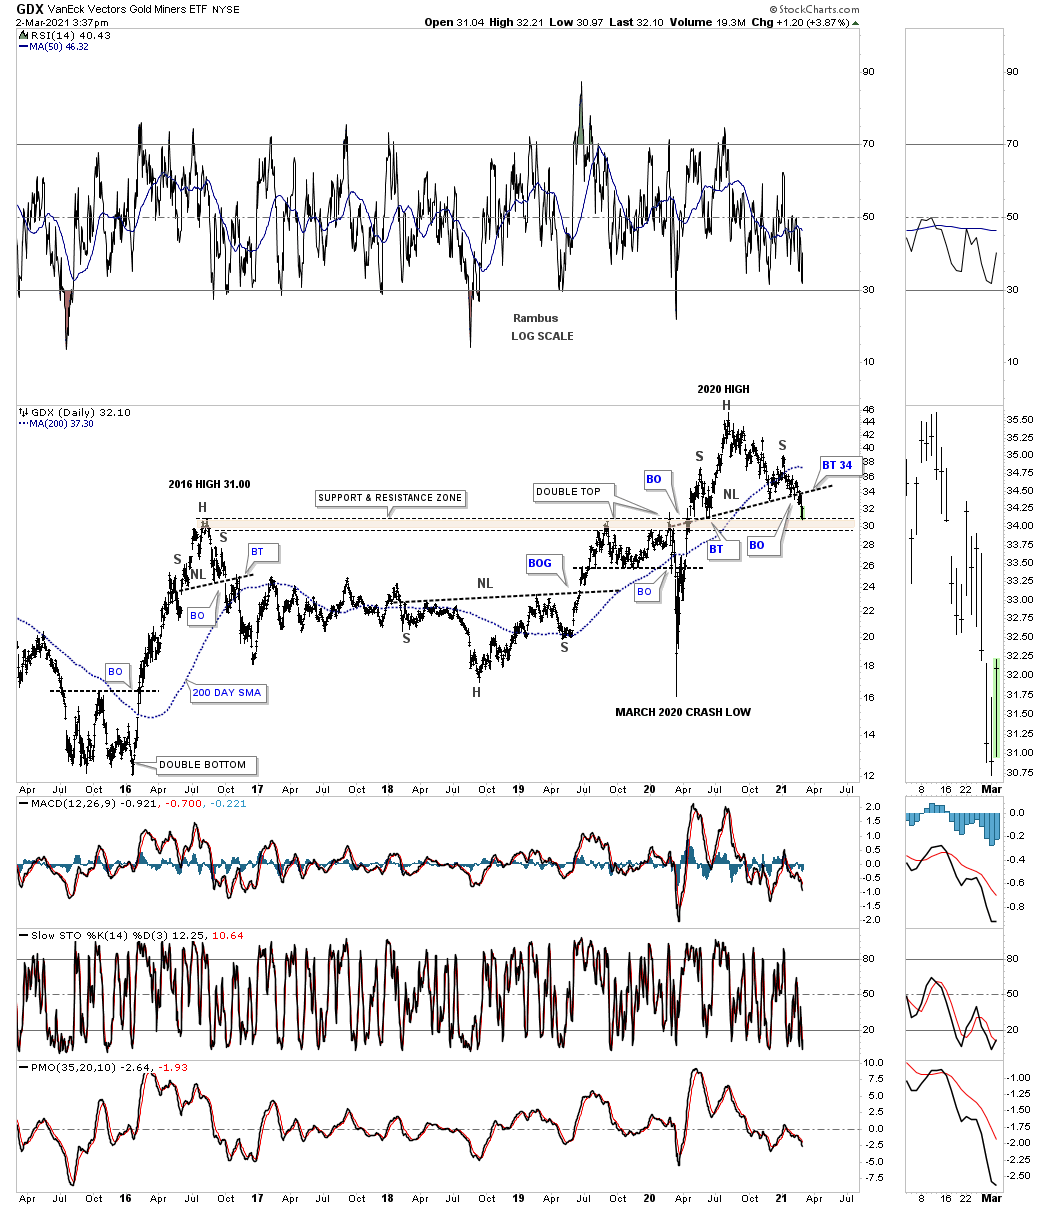
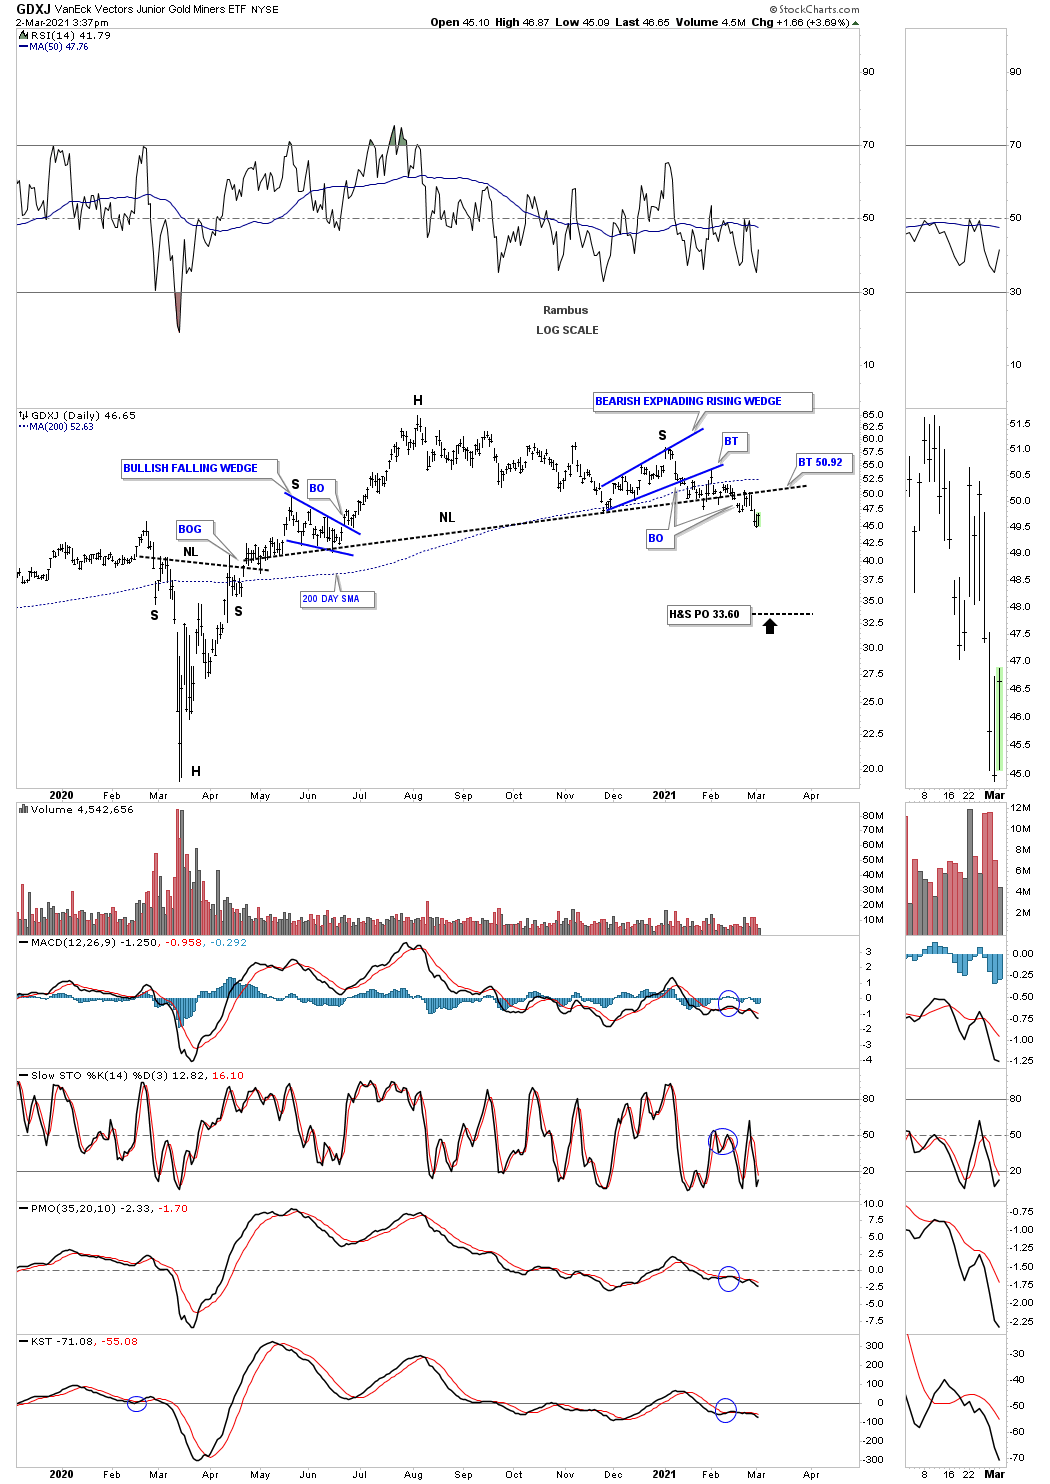
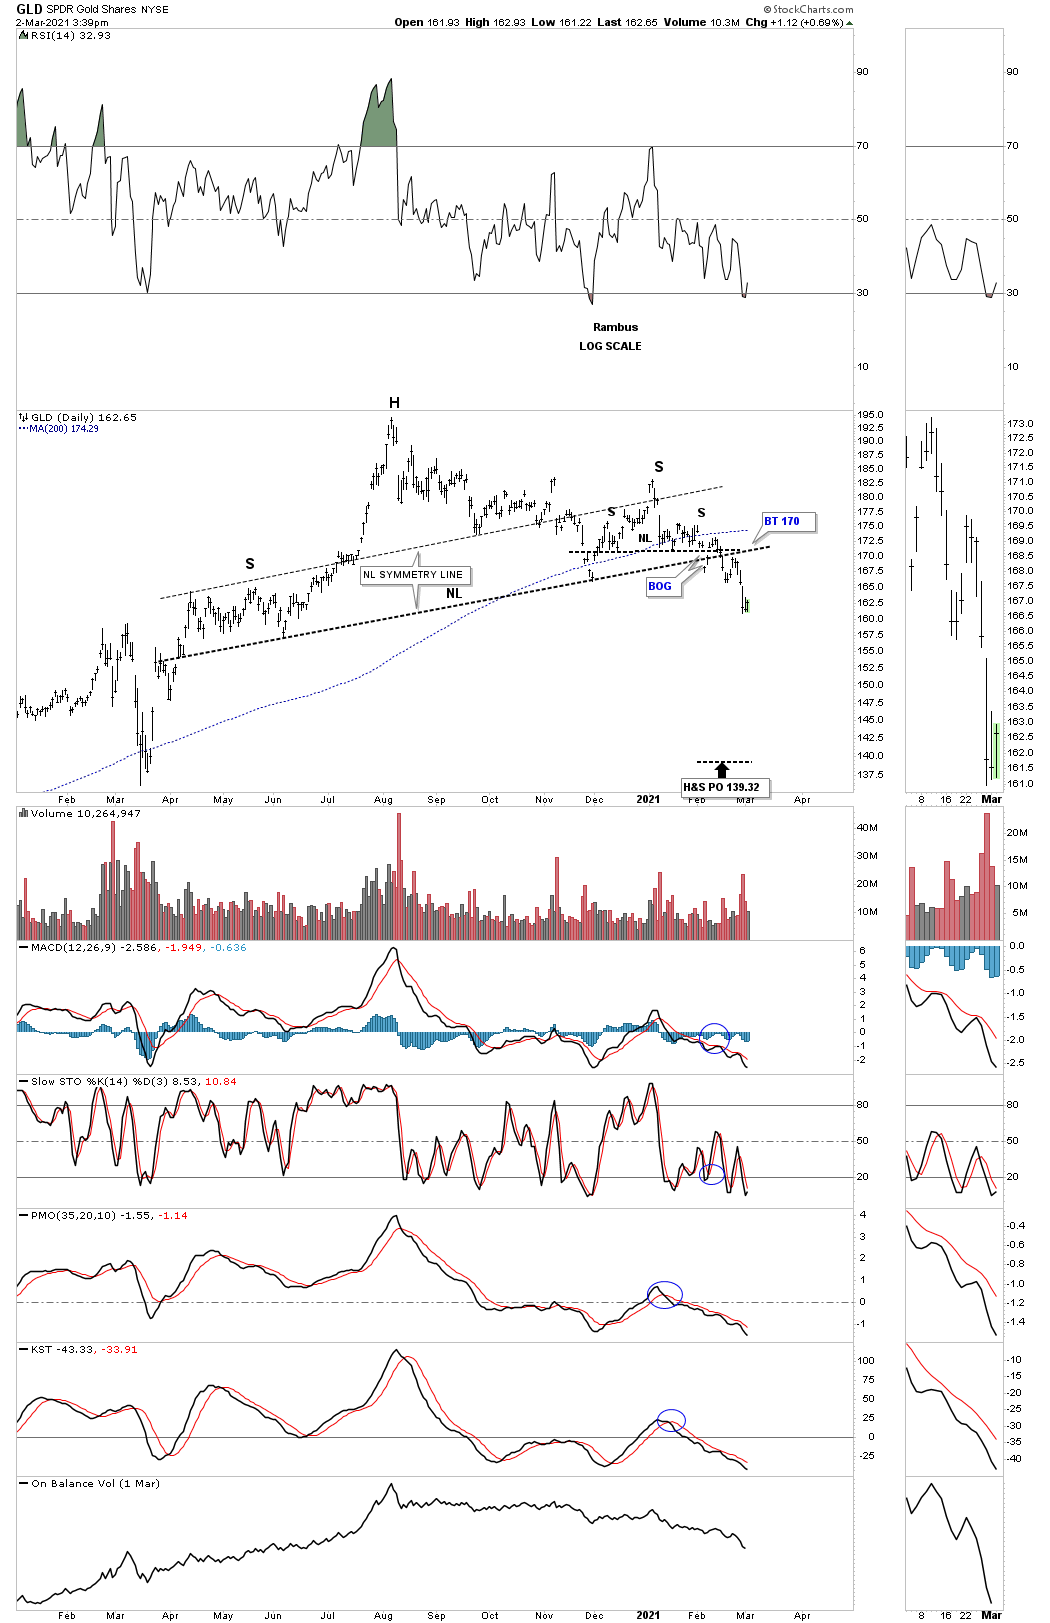
Today is an interesting day in regards to the H&S tops that have been playing out. I’ve been showing you the small blue consolidation patterns that have been forming around the neckline area. Today we are seeing a backtest to the bottom rail. Many times you will see a small consolidation pattern form just above, just below or right on the neckline to complete the H&S. As always the first thing we need to see happen to negate those H&S tops is for the price action to trade back above the neckline and then the right shoulder high. That would represent a change of character.
The daily line chart for the PM complex shows a little more clarity.
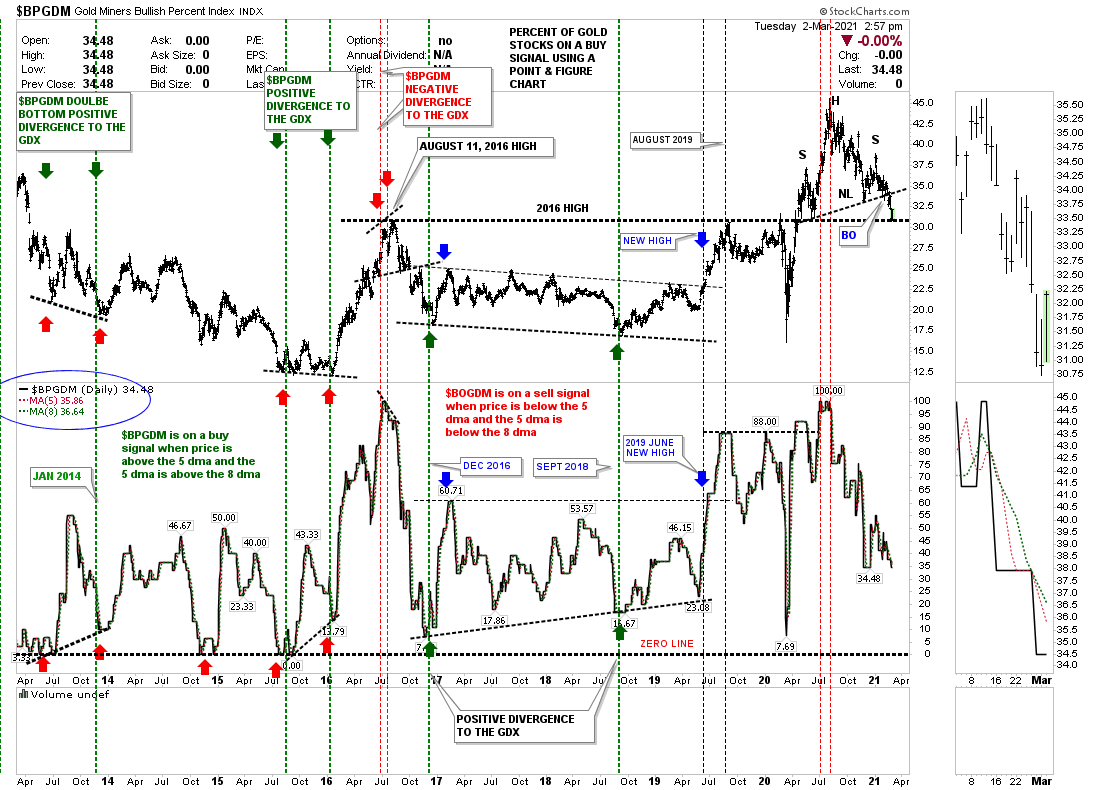
Its been awhile since we last looked at the combo chart which has the $BPGDM, Bullish percent index on bottom with the GDX on top. The BPGDM is still on a sell signals as the price, 5 day sma and the 8 days sma are all moving lower. You can see the GDX at the top is finding initial support right where it needs to show up at the 2016 high. Now the question becomes will we see a ping pong move between the 2016 high and the neckline of the H&S top. Normally when the BPGDM trades close to the zero line that generally represents a pretty good buying opportunity. I also like to look for some type of divergence between the two.
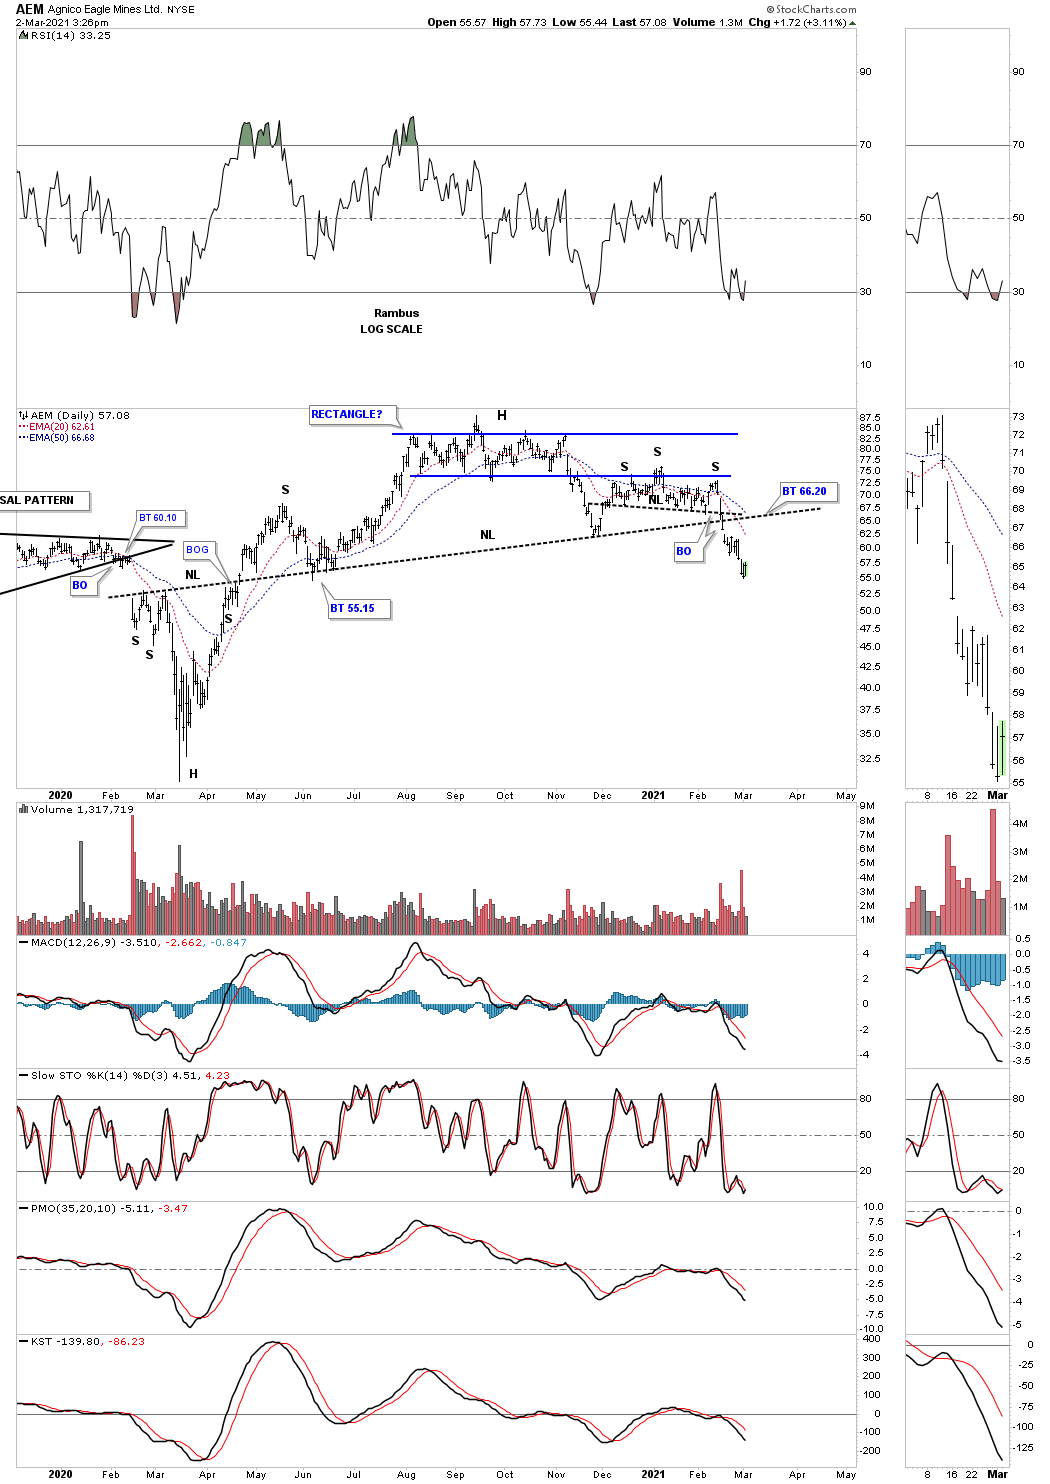
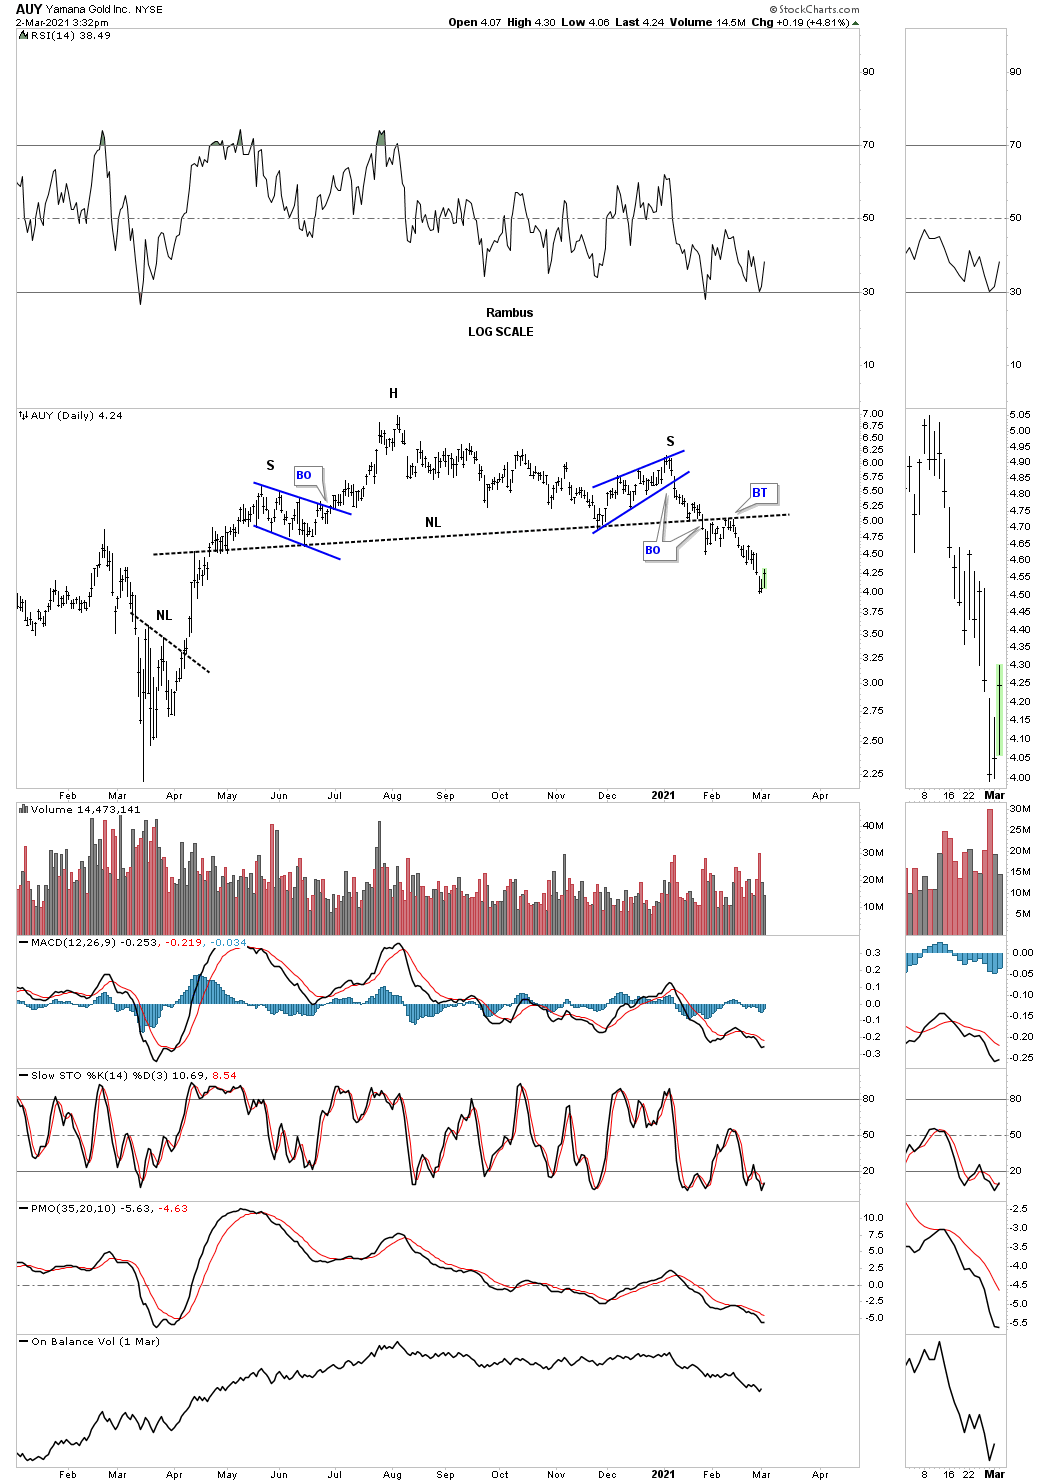
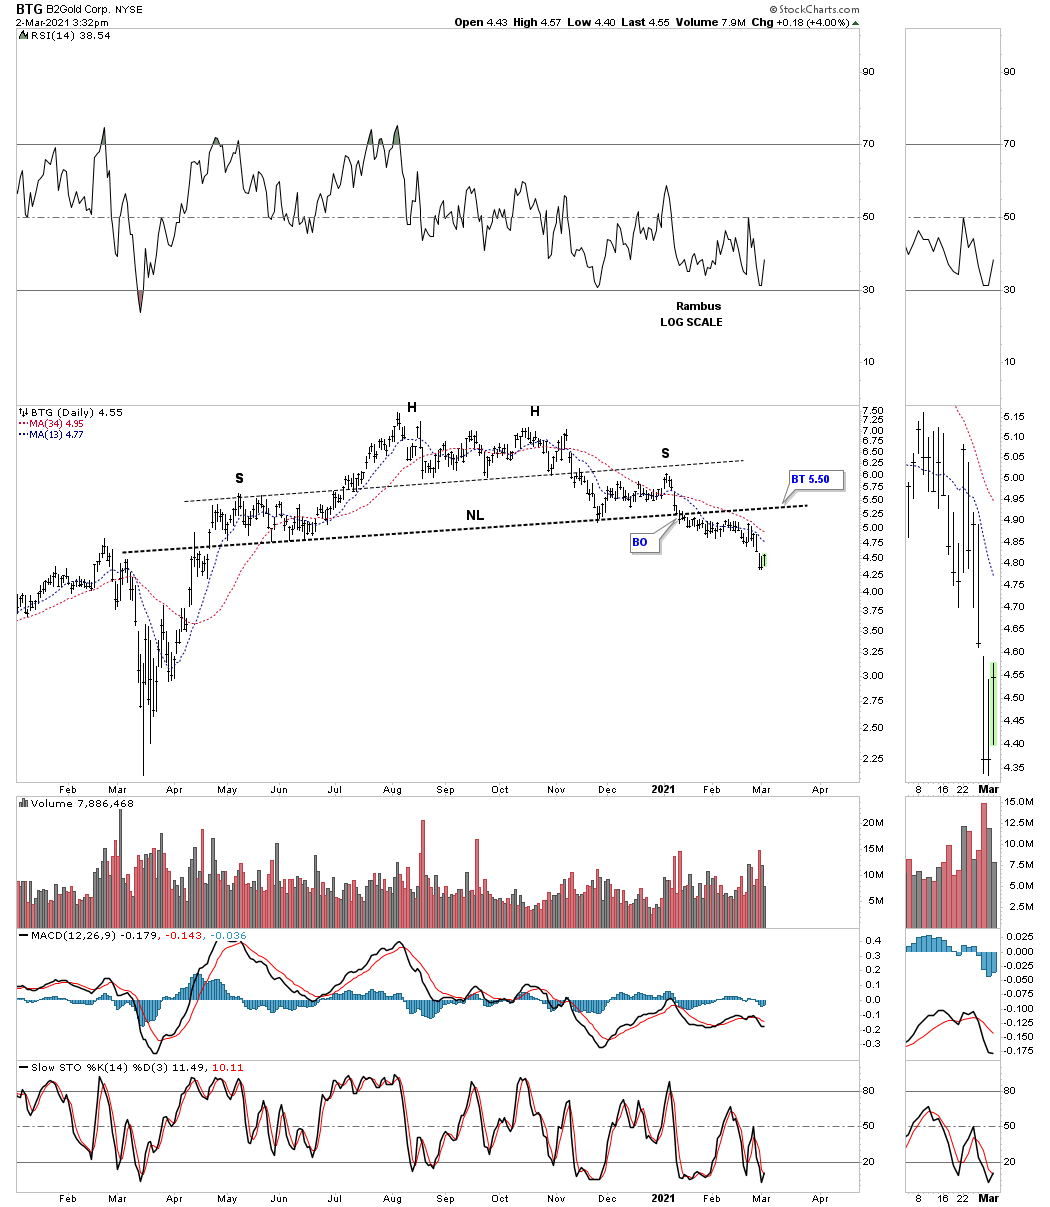
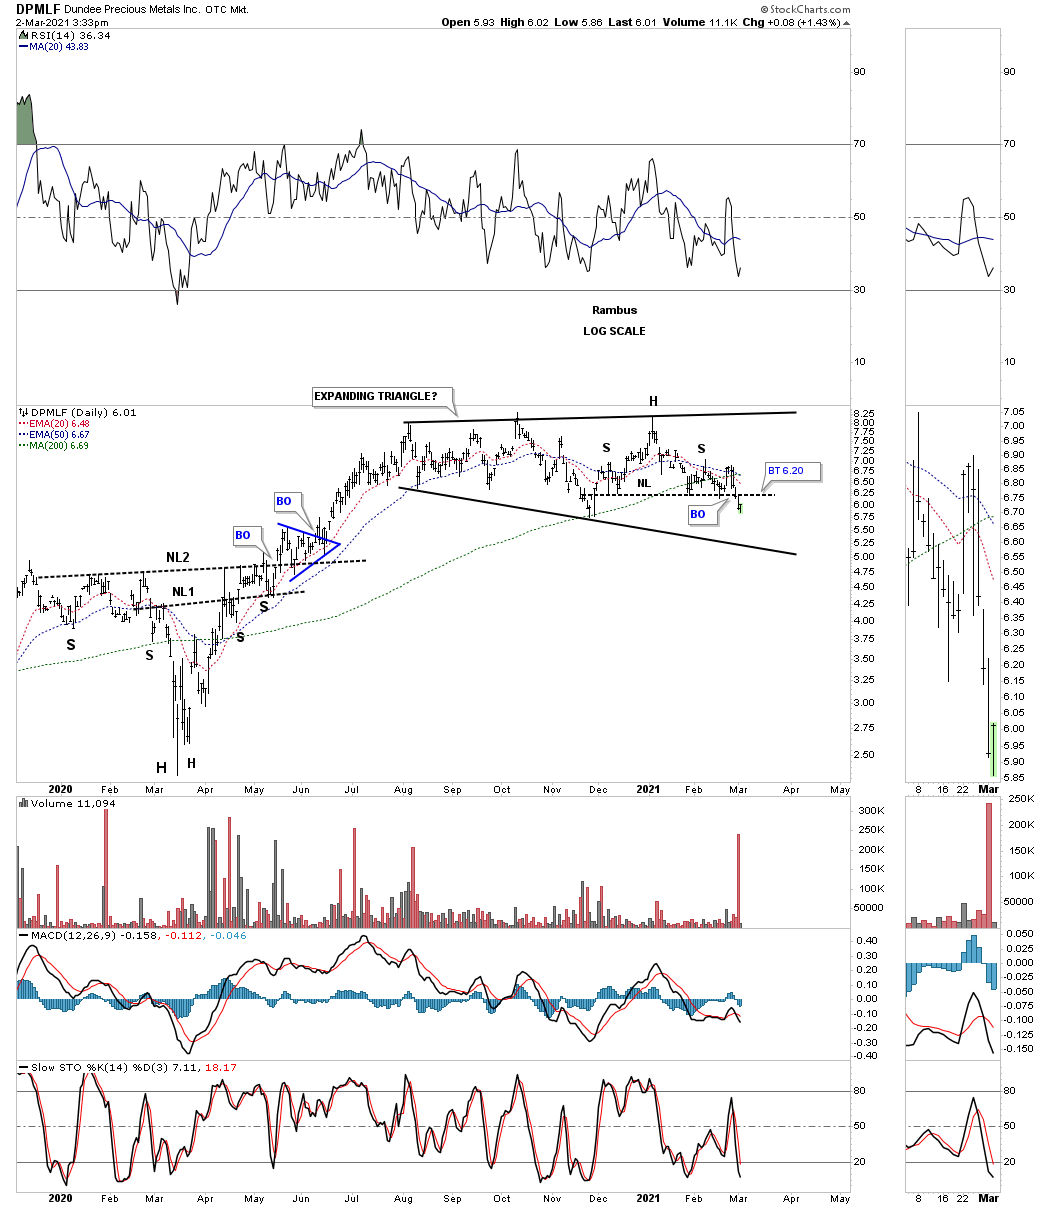
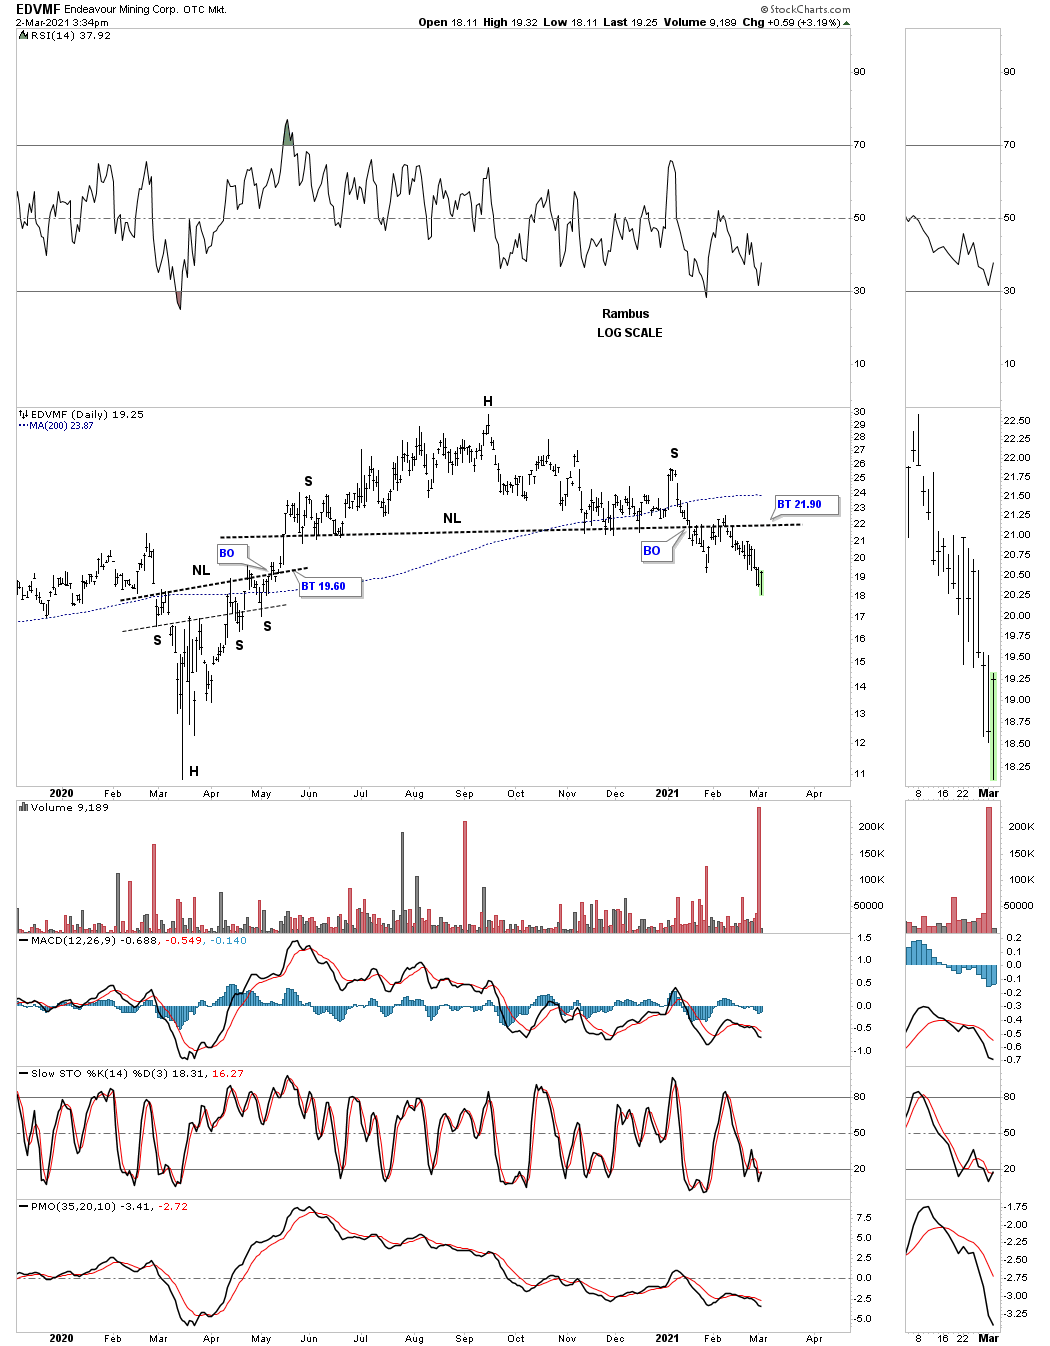
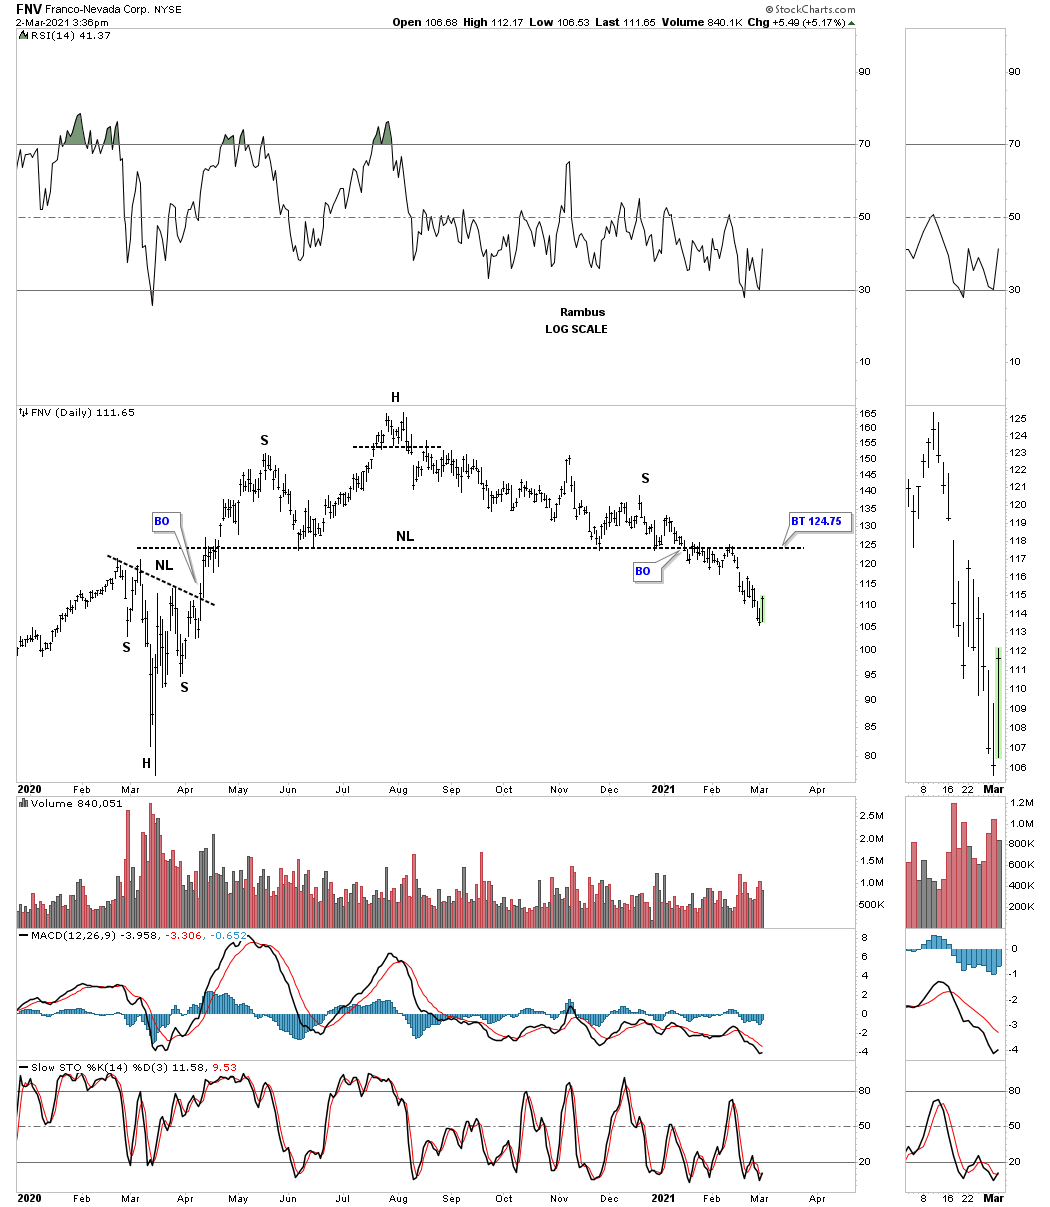
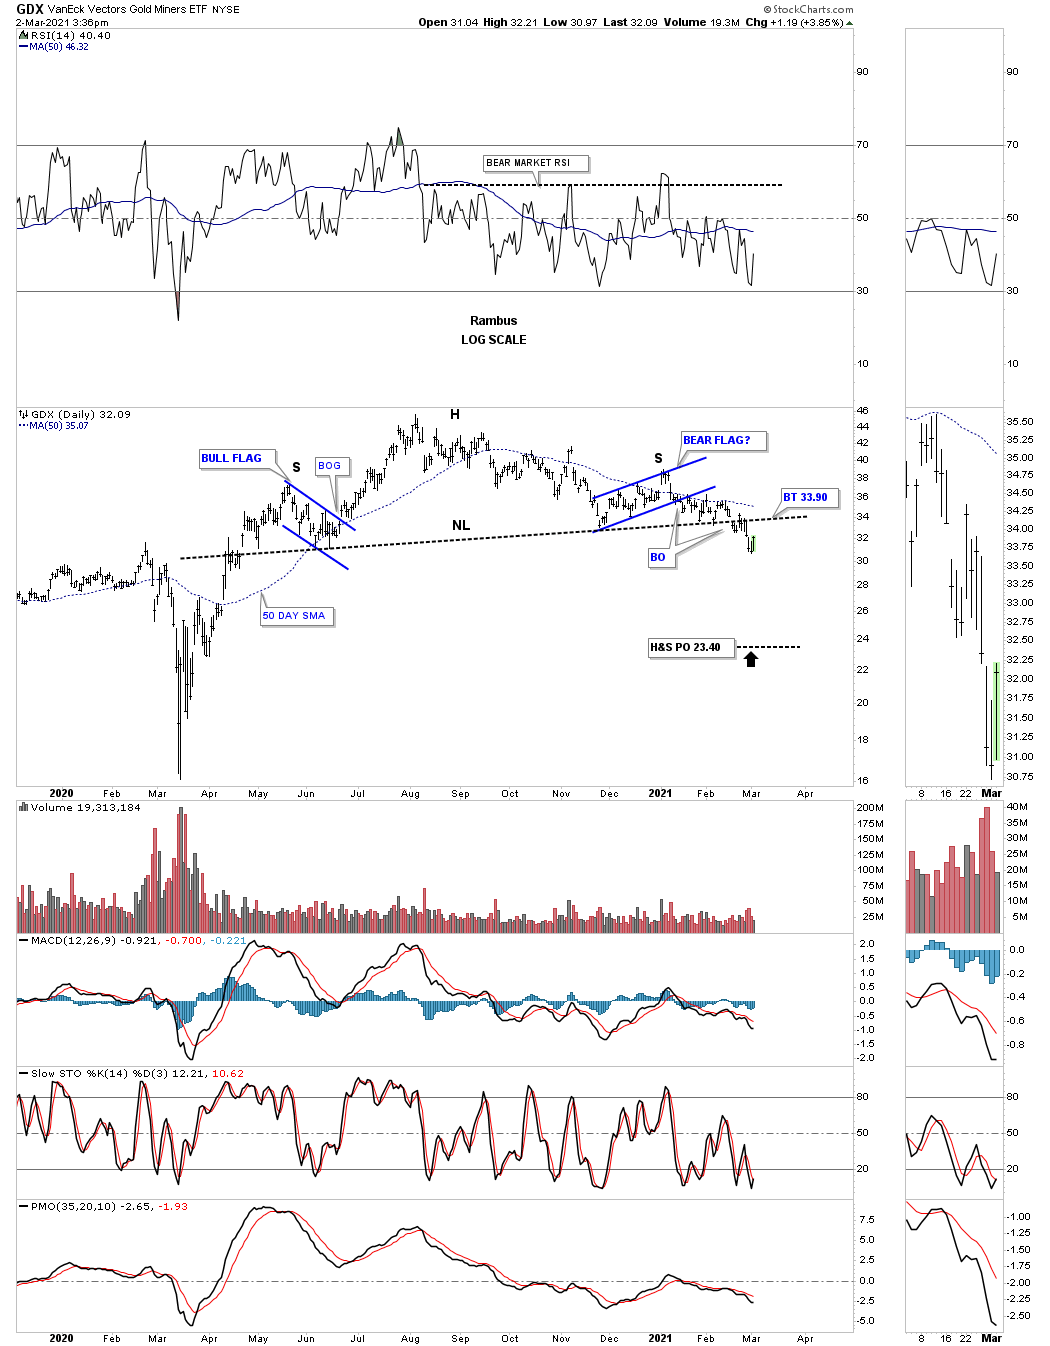
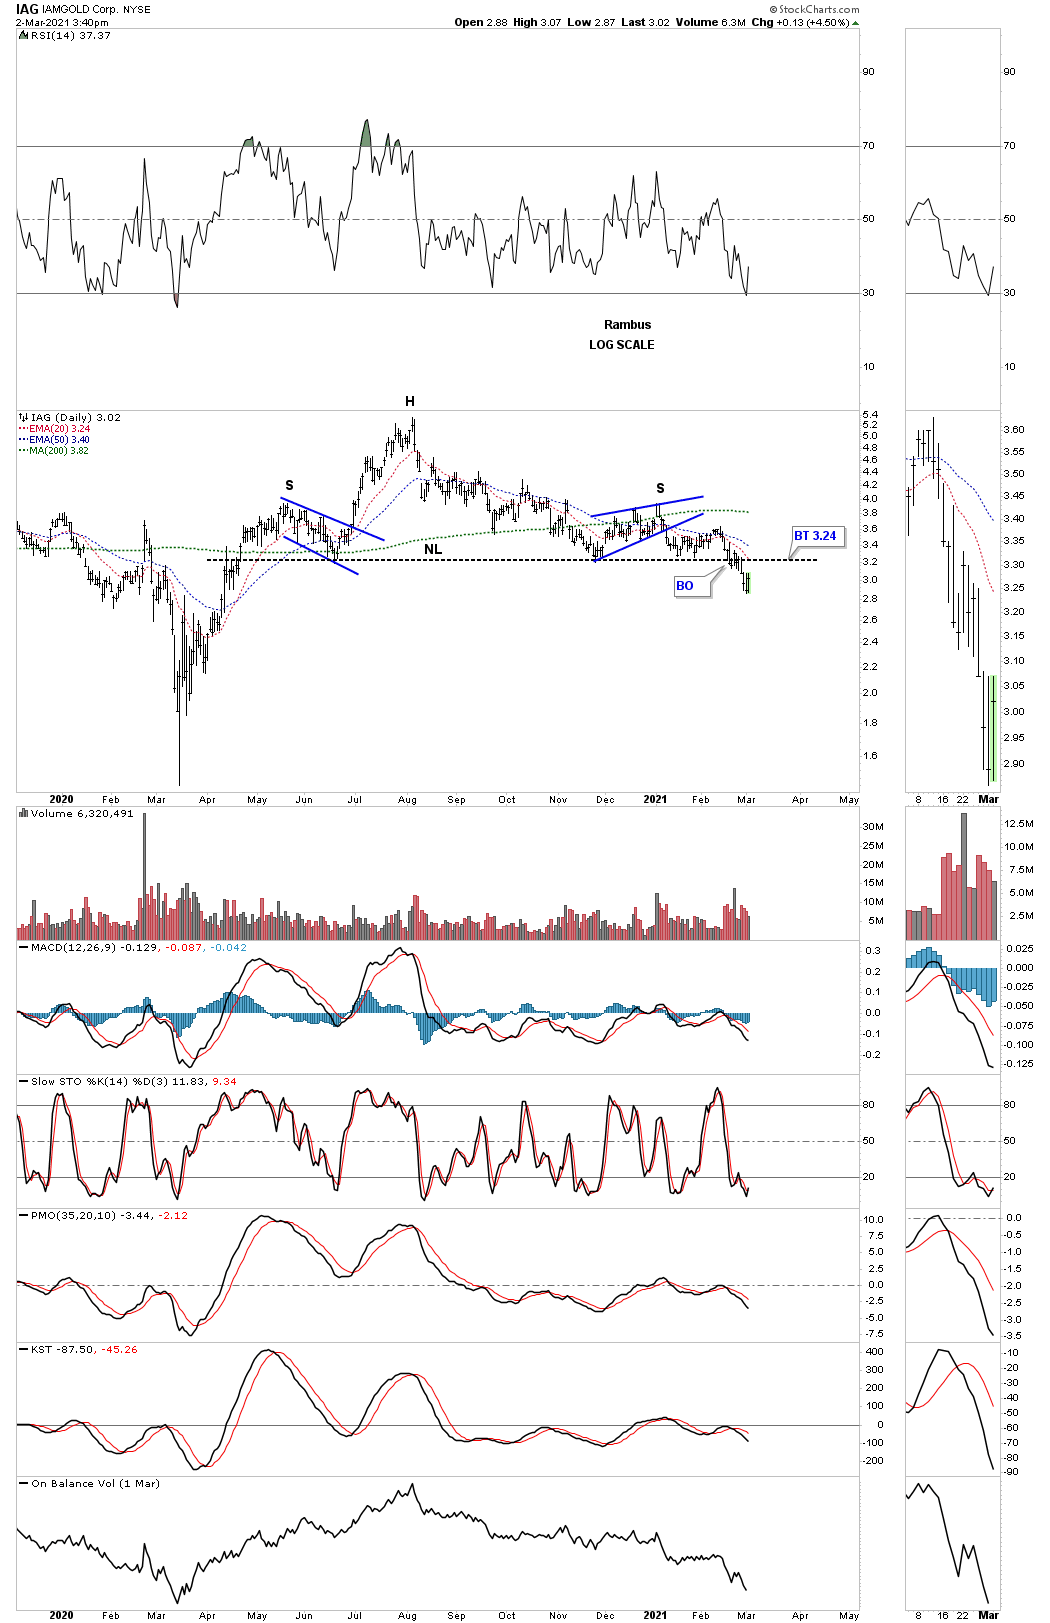
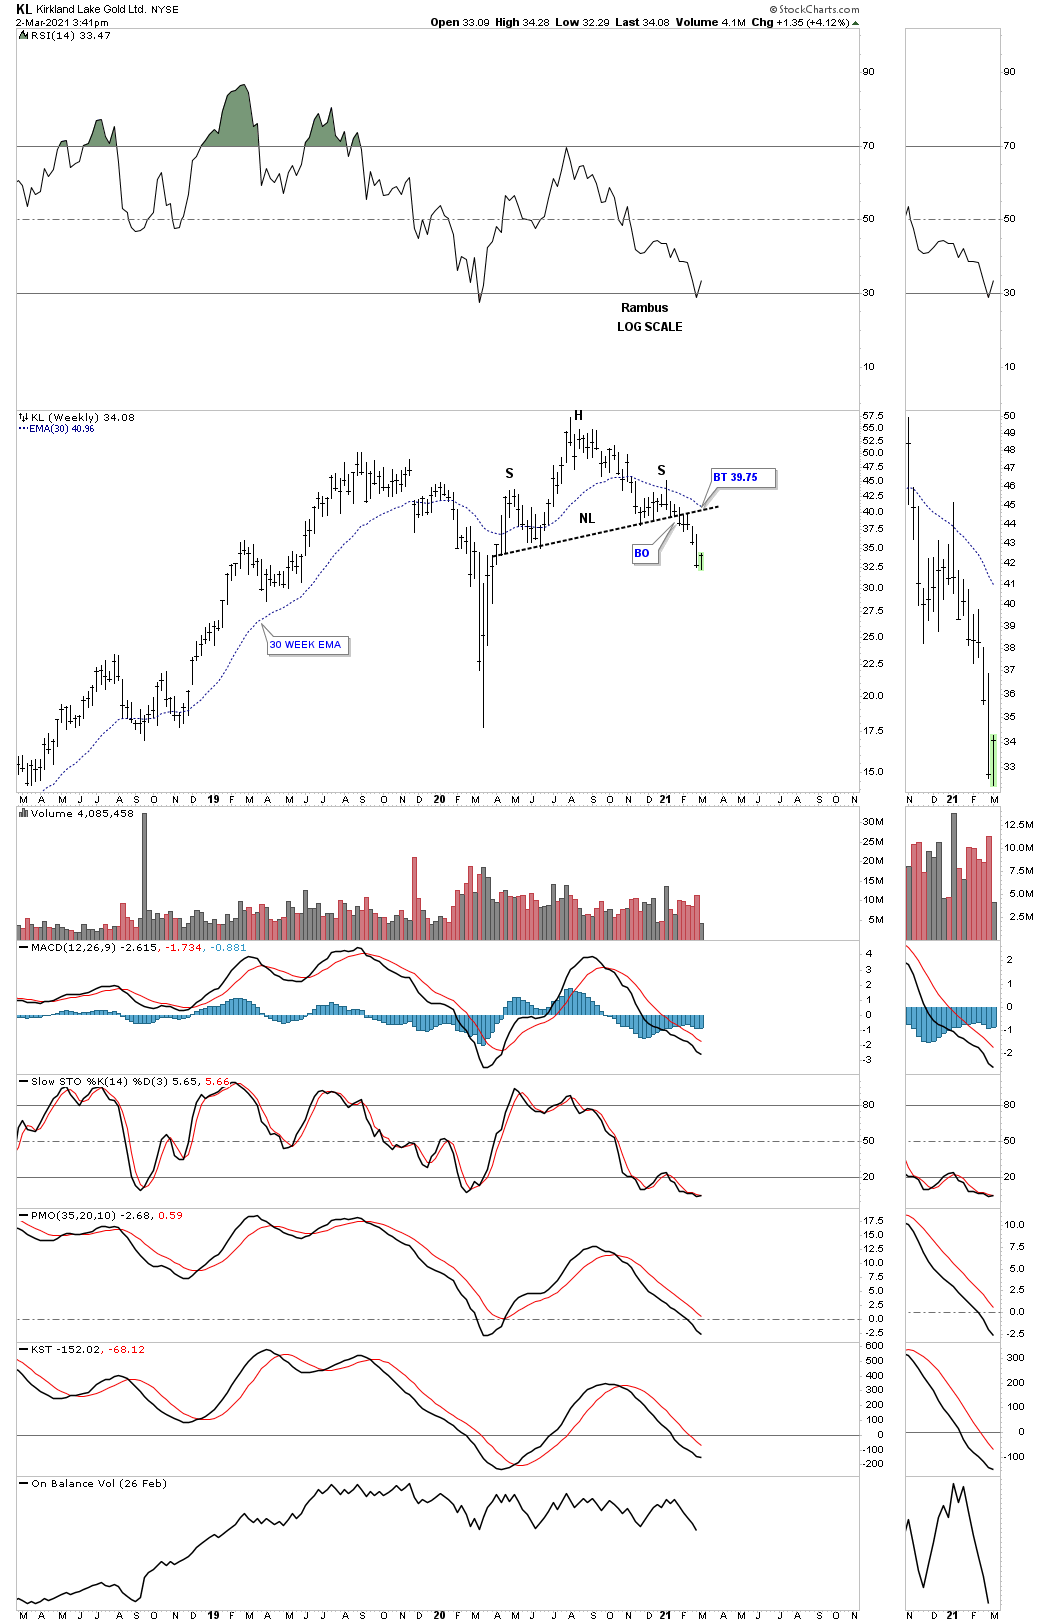
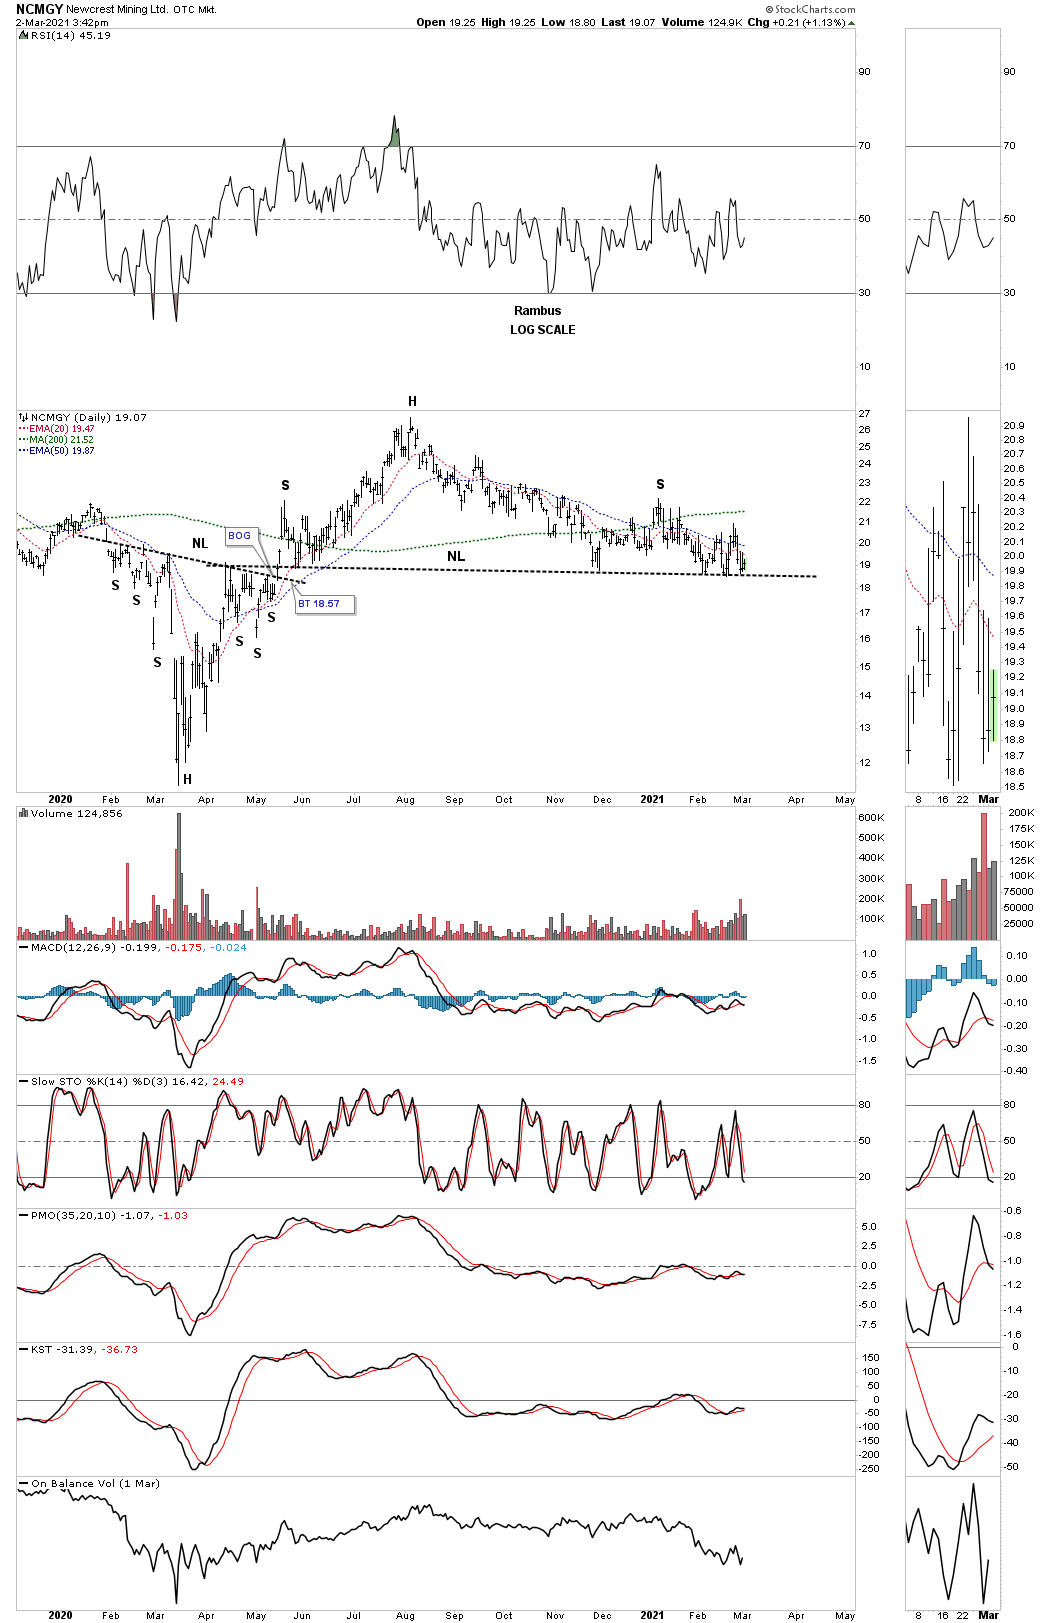
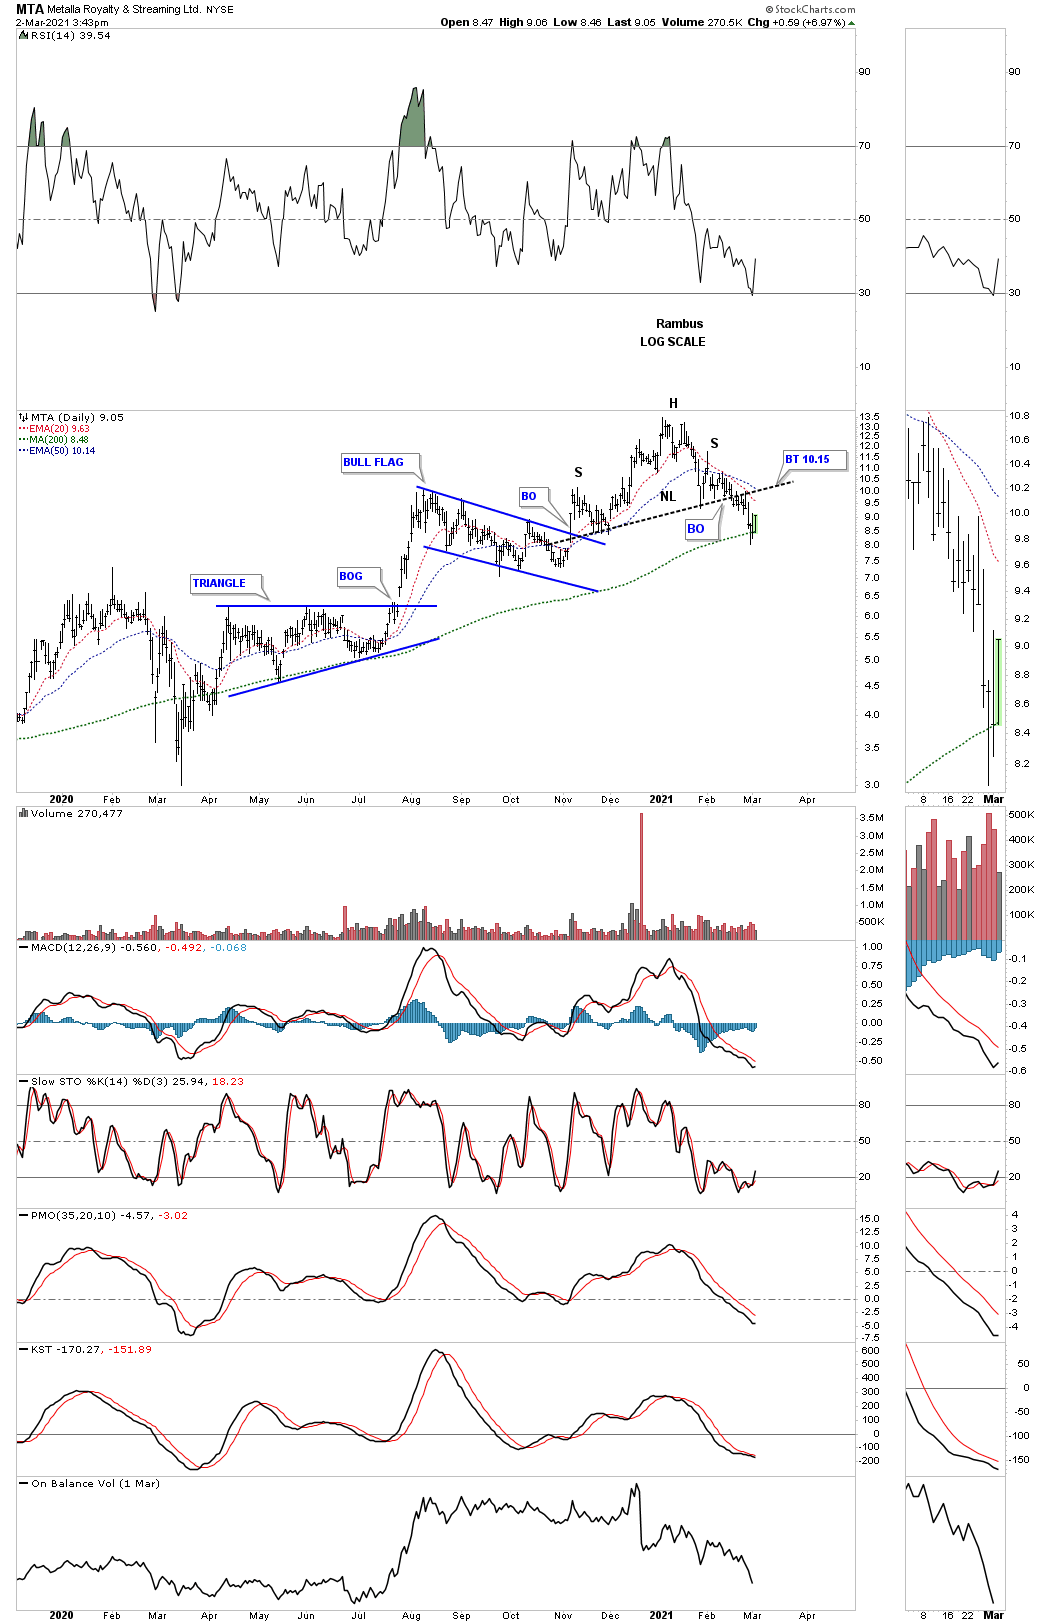
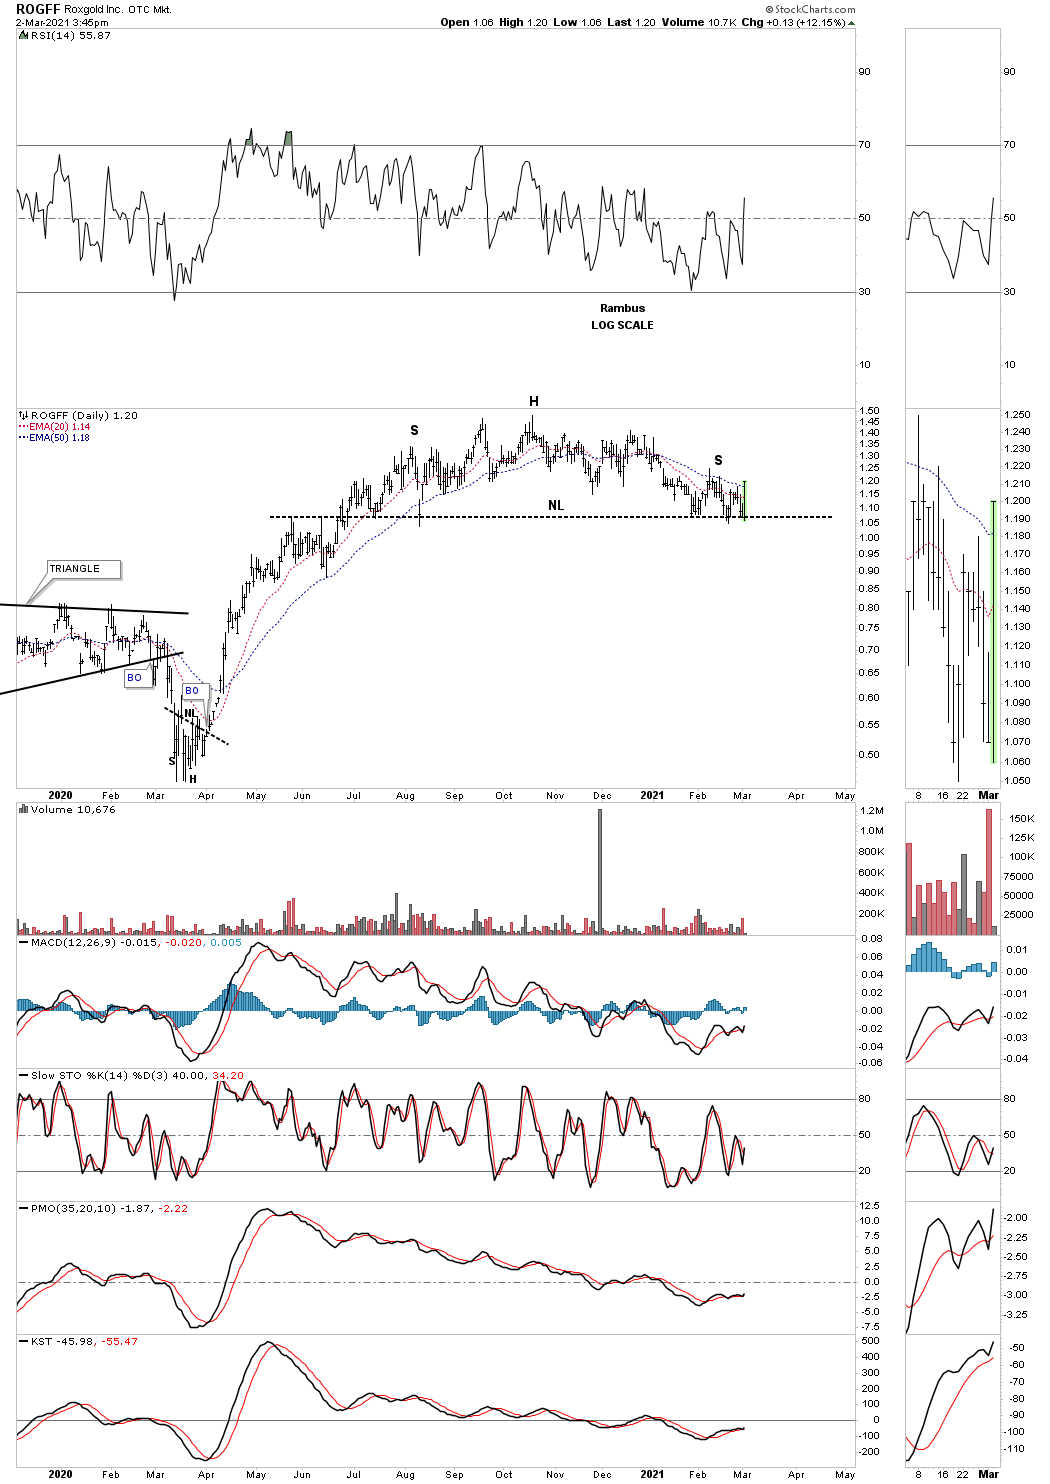
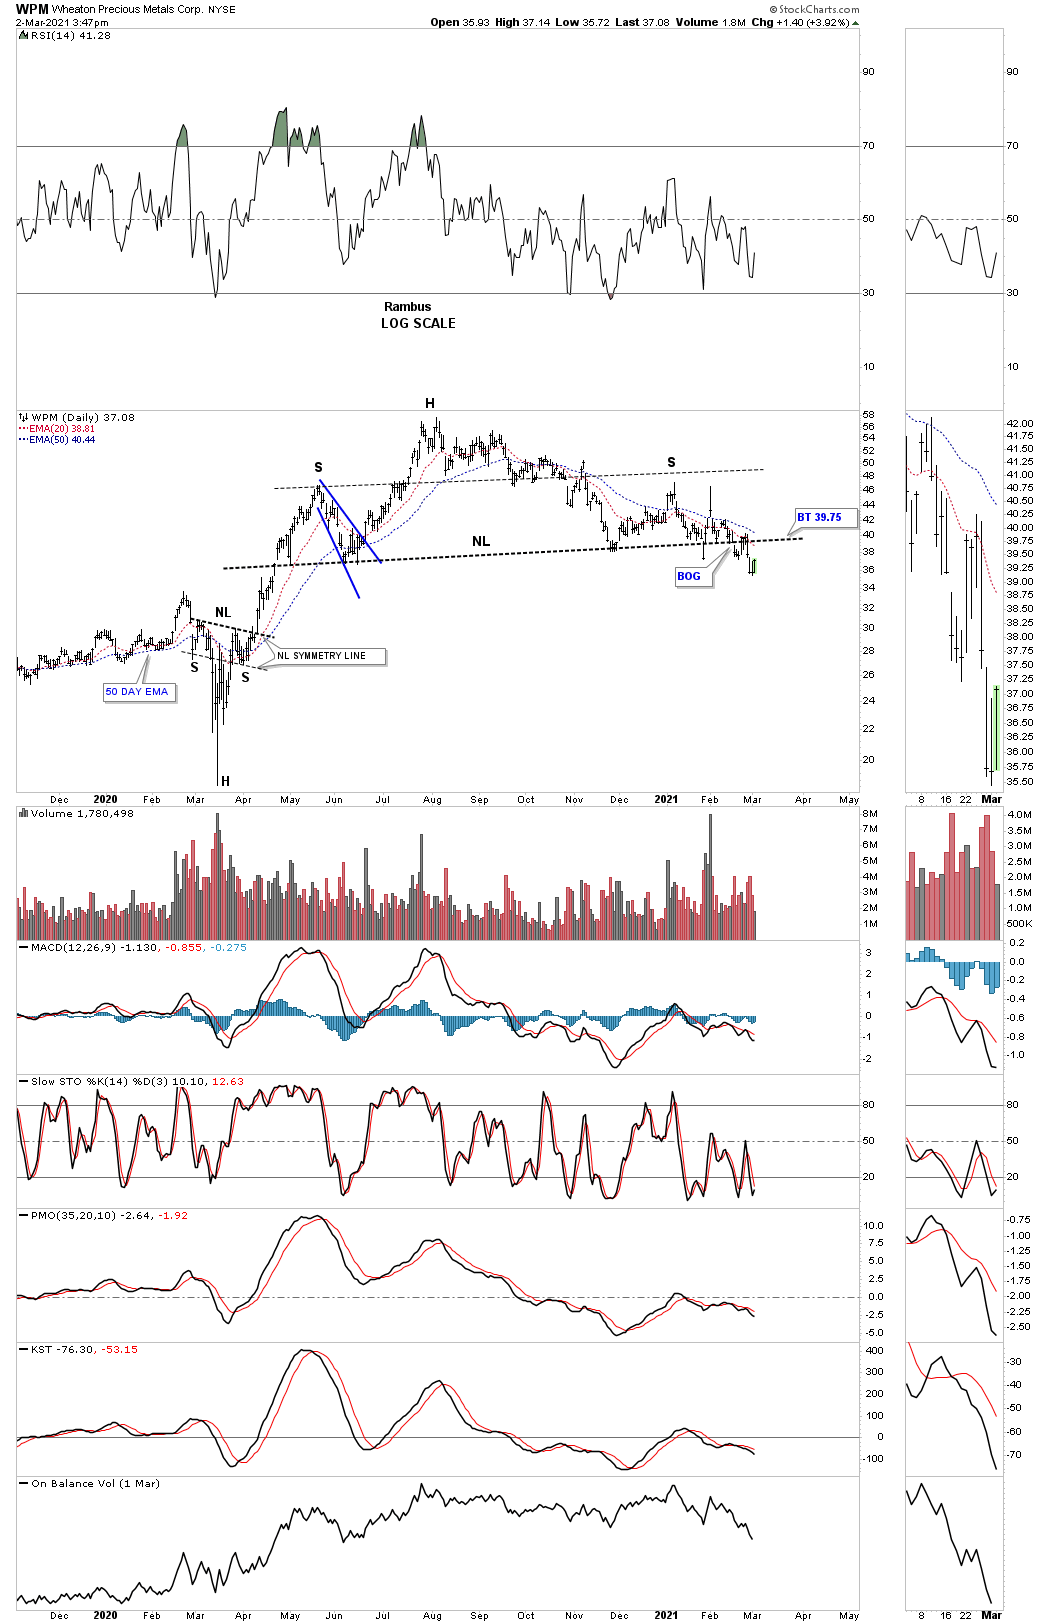
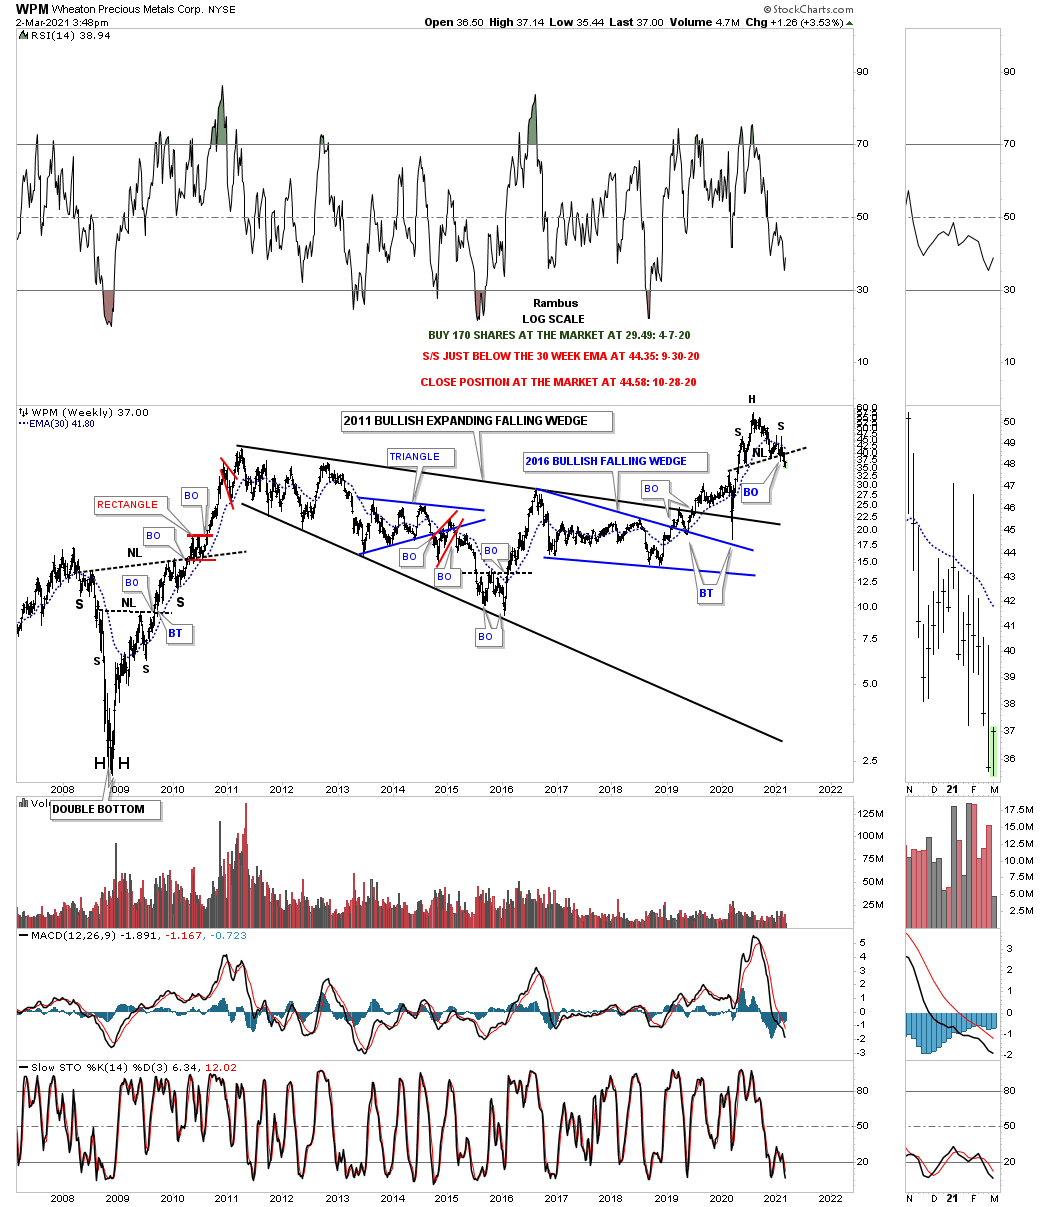
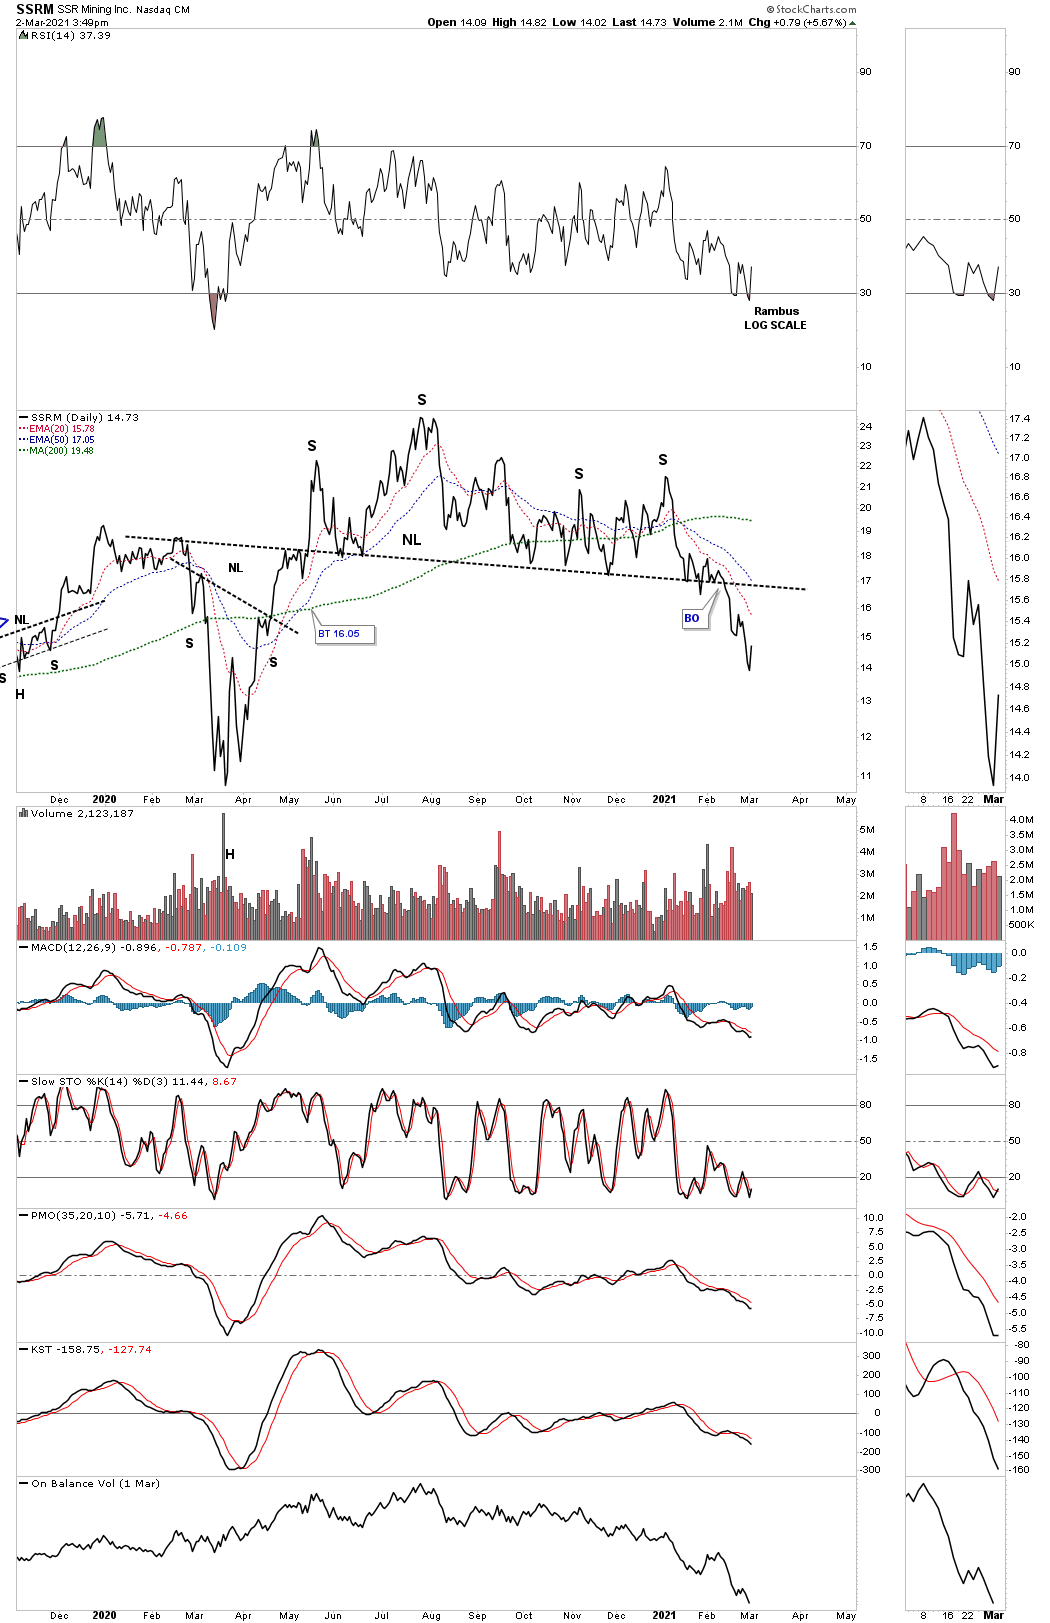
I’ve been mentioning for some time now that there are a lot of ugly looking PM stocks with a H&S top similar to what we are seeing on the PM stock indexes. Below are just a few that give me great pause for concern. Until they can right themselves caution is the better part of valor. All the best…Rambus
AEM:
AUY:
BTG:
DPMLF small H&S top within the expanding triangle.
EDVMF:
FNV:
GDX:
GDX: 2016 brown shaded S&R zone.
GDXJ:
GLD expanding falling wedge.
GLD: H&S top.
IAG:
KL WEEKLY:
NCMGY:
MTA:
ROGFF:
WPM daily:
WPM WEEKLY:
SSRM:
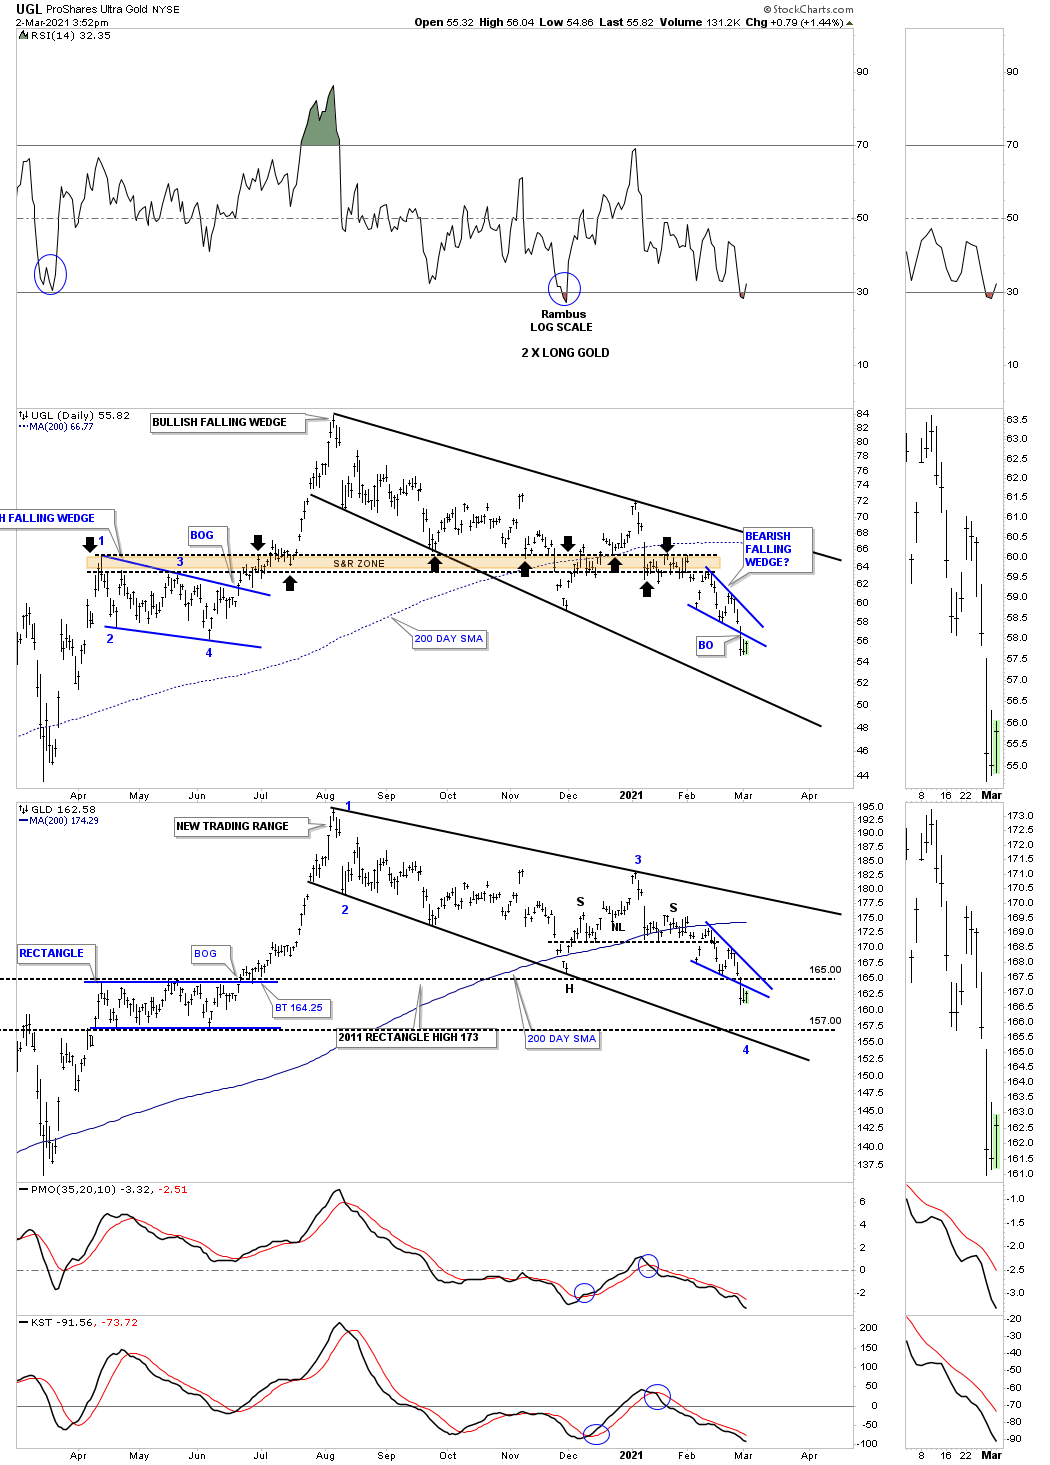
UGL / GLD combo chart.
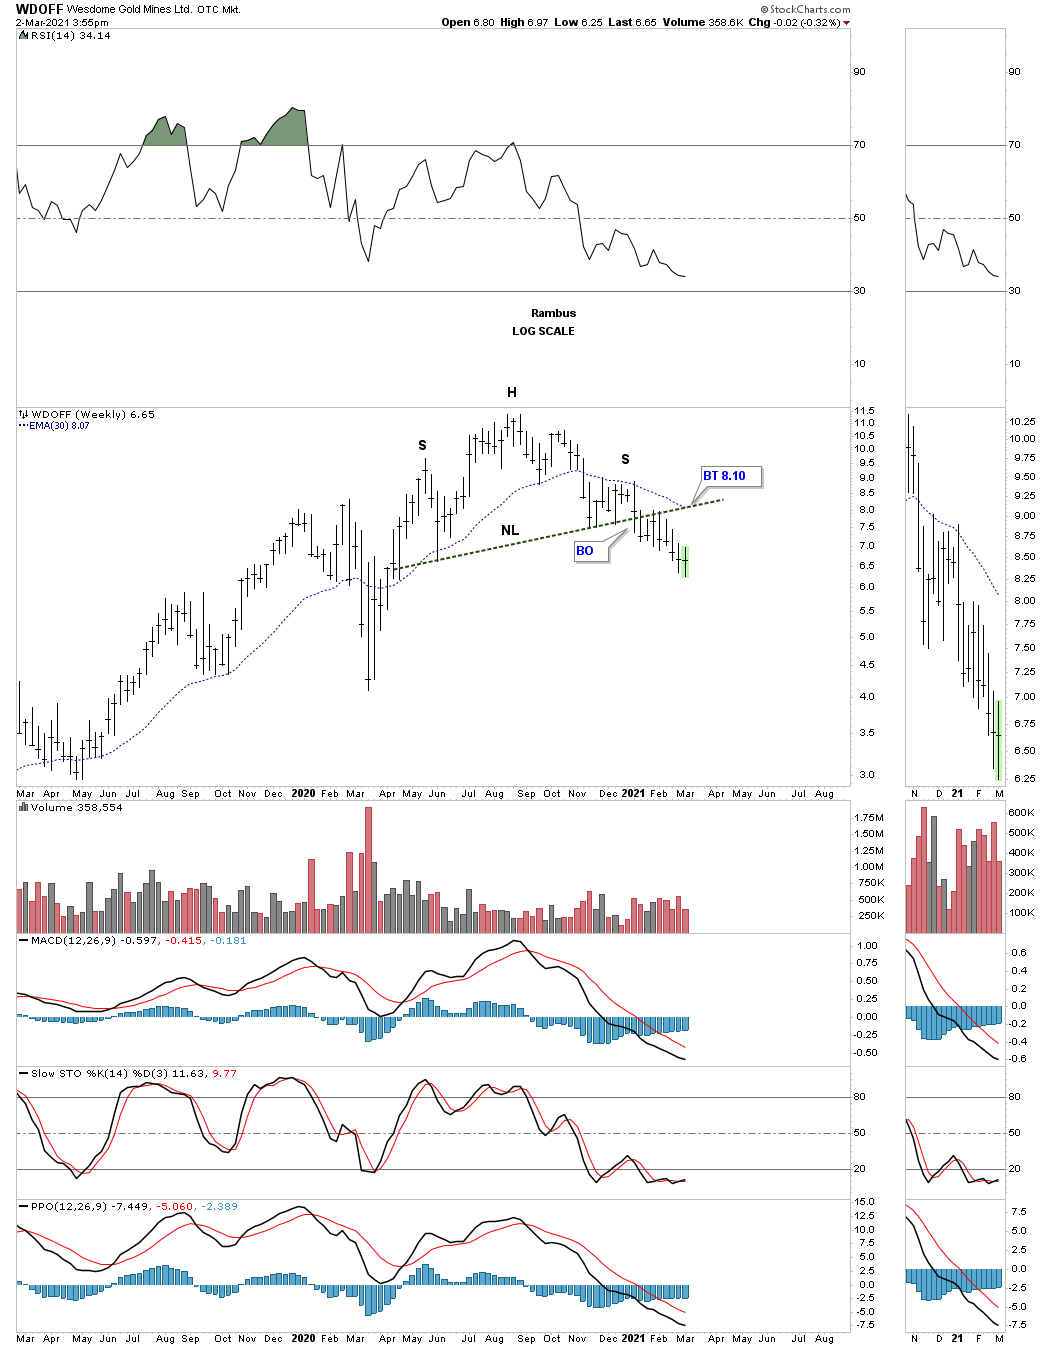
WDOFF WEEKLY:
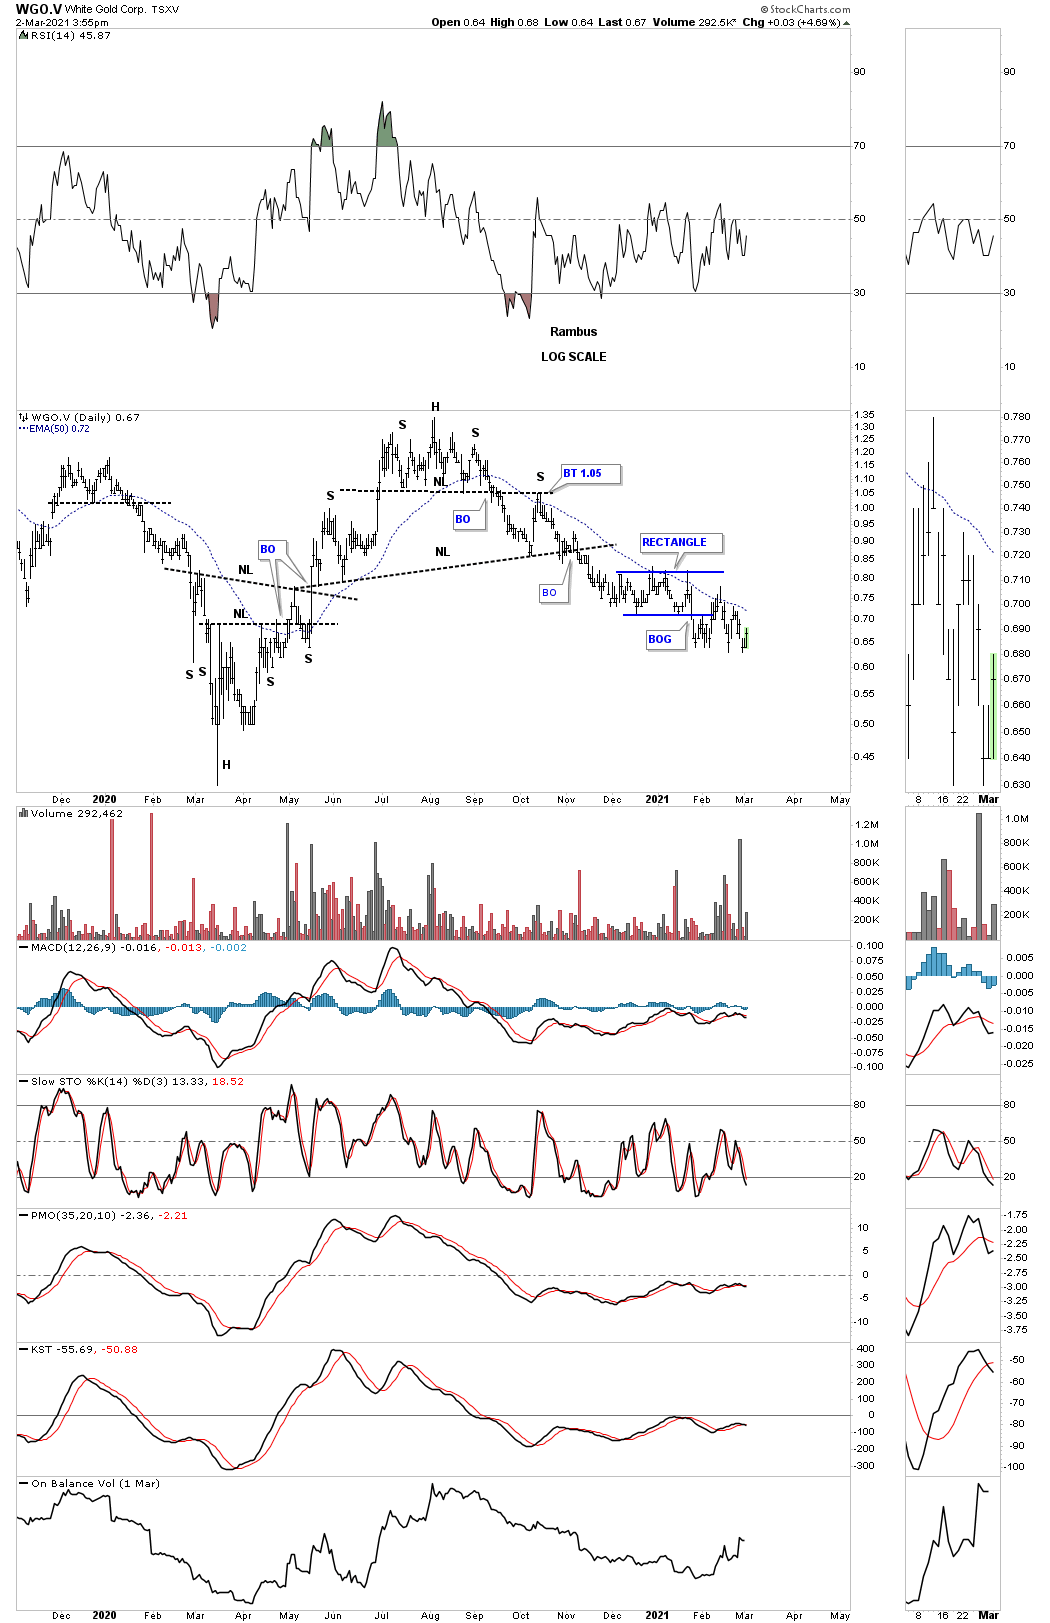
WGO.V original double H&S top.


