Lets start with the daily combo bar chart for the PM complex which shows the double H&S bottom failing today. With today’s failure it means I have to go back to the drawing board and see why this pattern has failed. Keep in mind we are looking at the short term and not the intermediate or long term charts.
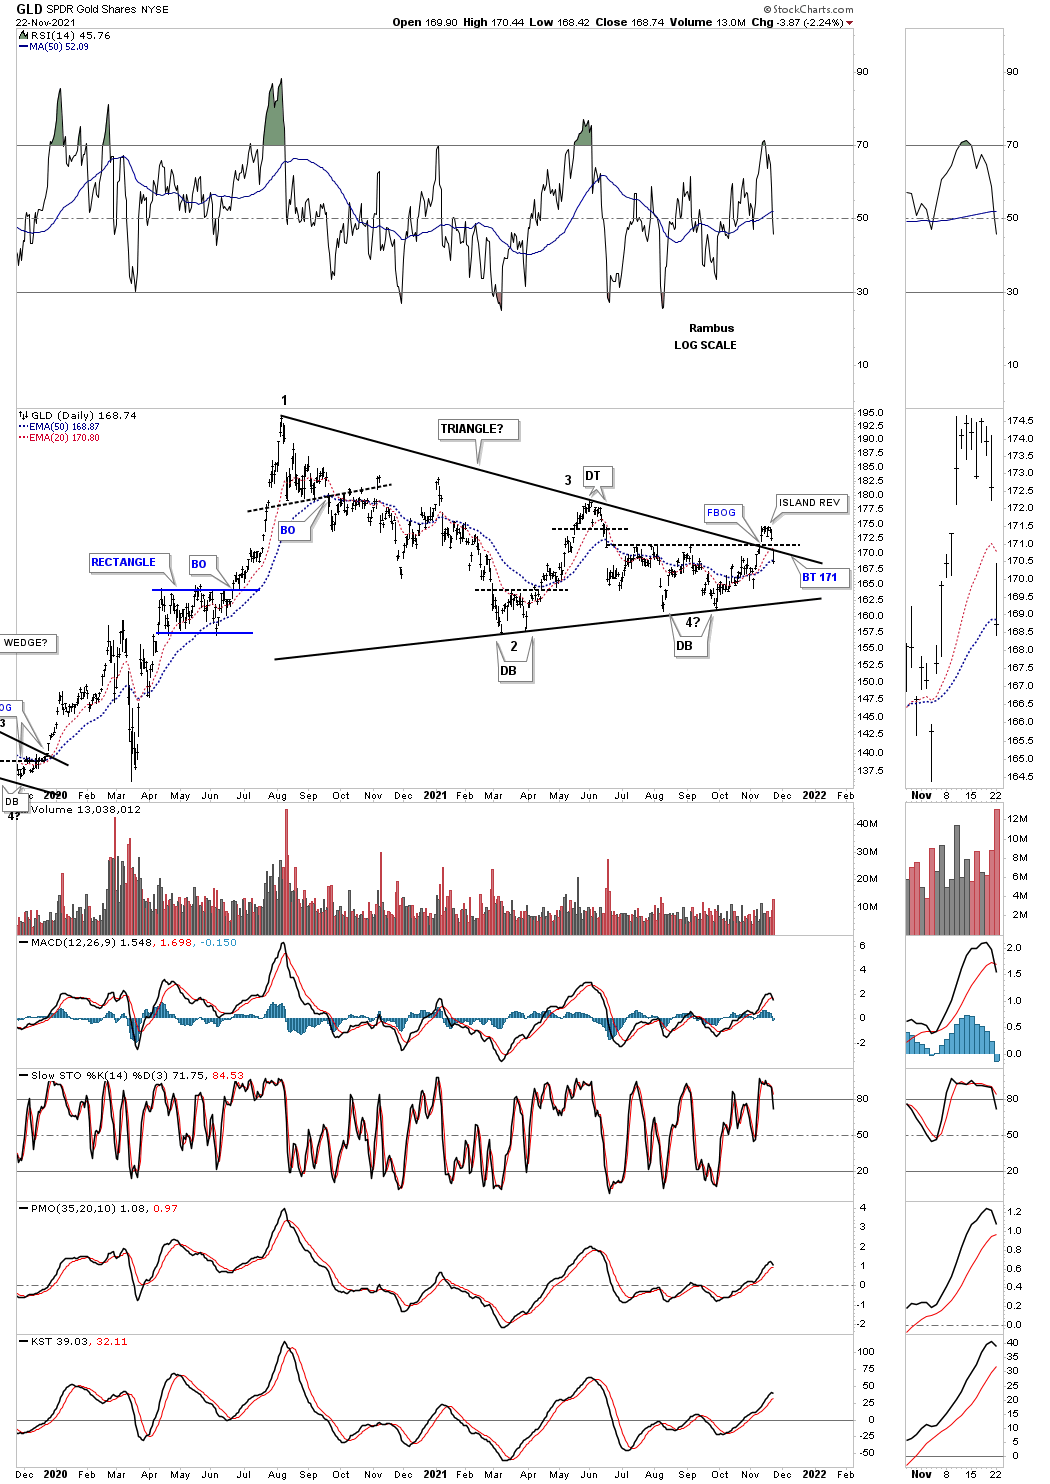
Even on the daily line chart the backtest is failing on a daily closing basis. GLD was by far the worst performer today as it closed below the top rail of its recent trading range which had 3 touches from below.
Before panic sets in lets look another daily combo chart for the PM complex from a different perspective. This combo chart shows the original bullish falling wedge in most cases, solid black trendlines. There is a pattern that is called fan lines which can identify an uptrend. First, notice the solid black rising trendline which shows us the uptrend is still intact by making higher highs and higher lows which is just the opposite of the falling wedge which made lower lows and lower highs during its formation.
Fan lines work like this. You start the first fan line from an important top or low and in this case the June high. You then draw a trendline connecting the tops with the top rail of the falling wedge being fan line #1. Normally you will see a backtest to the top of the fan line before the stock moves higher. A backtest to the top of the fan line isn’t mandatory but it happens in many cases.
After the first fan line is in play you look for a rally that makes a new higher high. When that rally fades and starts to correct you add the 2nd fan line to that top of that minor high and then look for support on top of the previous fan line, in this case fan line #2. Today’s price action is close to backtesting fan line #2 which intersects with the short uptrend line. We’ve seen many important inflection points in the past and this is one right here. What we want to see is for fan line #2 to hold support and then a rally above fan line #3 with one last backtest to complete the pattern.
As you know reverse symmetry plays a big role in how I view the markets, how a stock comes down many times it will reverse back up over the same area. Below is a new daily line combo chart which shows how I tweaked the neckline from the previous high and not the lower high which I have been showing on the daily combo chart I started this post with.
Keep in mind morphing is also part of the game we have to understand which can be a bit tricky to spot sometimes. Using the slightly higher high on the way down is where I drew the neckline from which still gives us a very symmetrical H&S bottom under construction.This also gives us a new neckline symmetry line as shown by the thin black dashed lines. If the neckline symmetry line can hold support then we are dealing with a slightly bigger H&S bottom vs what I’ve been showing before today. Again if the H&S bottom plays out it is strongly suggesting that the top rail of the June trading range will be broken to the upside as the price objective is much higher than the top rail.
Below is a daily bar chart which shows the morphing H&S necklines with the new neckline symmetry line.
Today when GLD gapped below the top rail of the black triangle and the black horizontal dashed S&R line it formed an island reversal pattern which sometimes can be a short term reversal pattern. We know the top rail of the August 2020 triangle was properly place because GLD gapped above and then gapped below it. For the time being we have a false breakout since GLD is trading back inside of the triangle.
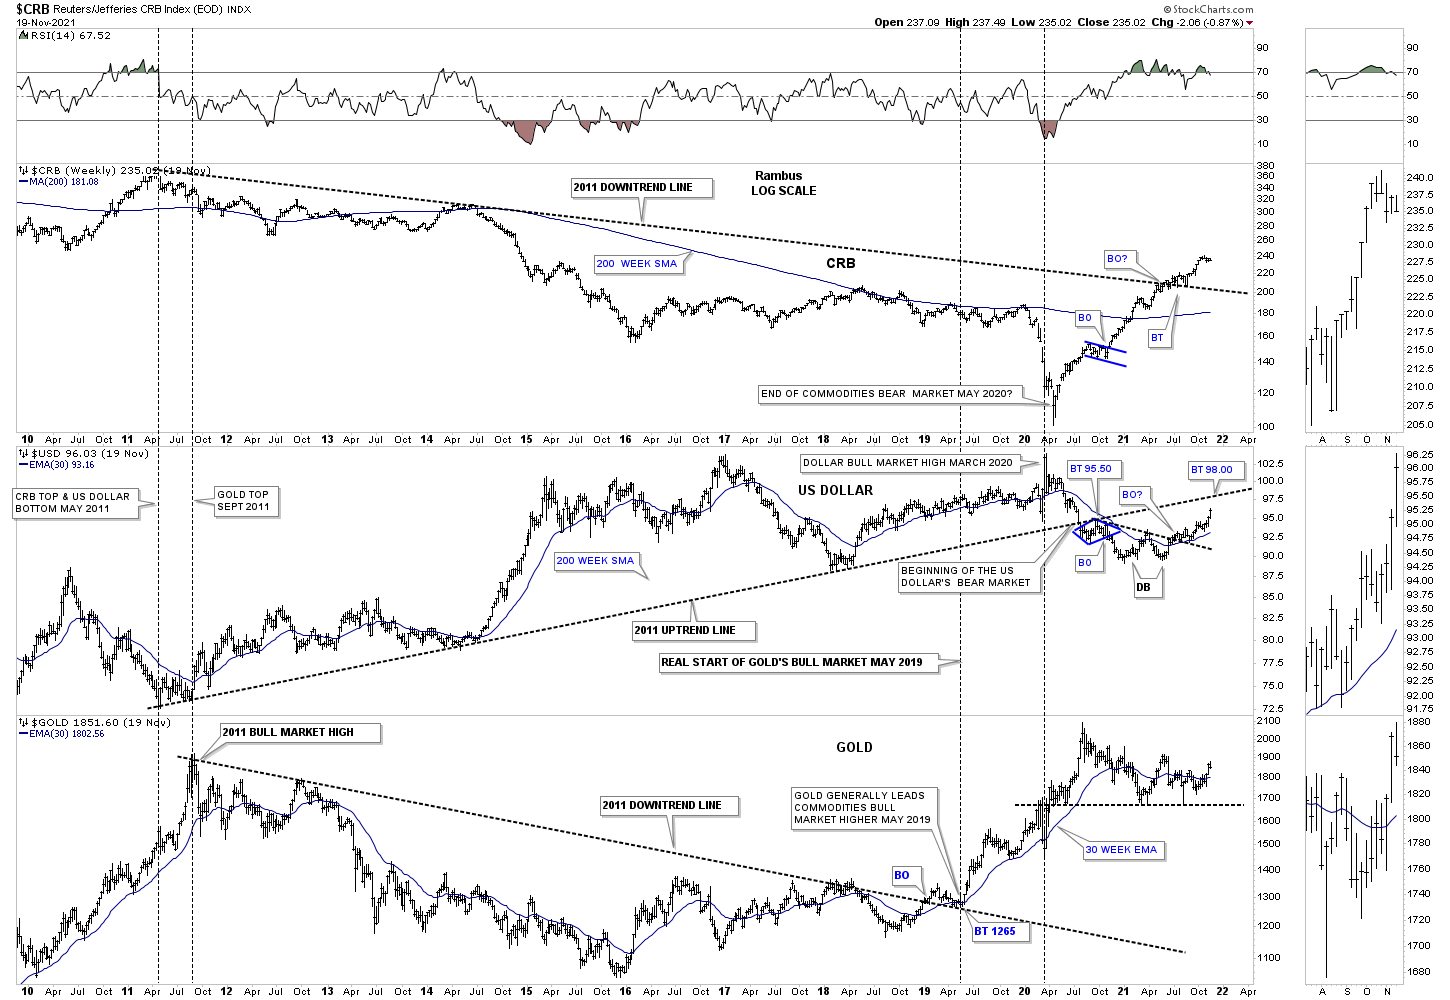
It is always important to keep the big picture in mind on days like today which can seem like the end of the world on a daily chart but might not look as bad on a longer term chart.
This last chart for today is the triple weekly combo chart which has the CRB index on top with the US dollar in the middle and Gold on the bottom. Looking at the the US dollar in the middle you can see that small double bottom we looked at previously on the UUP. The bottom rail of the 2011 uptrend line comes into play around the 98 area which should work as strong resistance with all the touches it has. It looks like the CRB index may need to rest for a bit and could backtest the top rail of its 2011 downtrend line. Gold just needs to trade sideways and not move below the horizontal bottom line that has been holding support since the correction began.
Many times before an important move begins you will see a sharp selloff for a couple of days that shakes out the weak hands hitting all the sell/stops in place. So far nothing is broken on the longer term charts for the PM complex which I”m watching very closely. If the neckline symmetry lines fail to hold support then that will call into question of the validity of the H&S bottoms. For the time being I’m giving the benefit of the doubt to the bulls. All the best…Rambus


