We are having a big family cookout planed for later today so I just wanted to get something posted.
I have literally well over a 100 different charts for Silver going back over 20 years which I have shared a time or two, but some not recently. It was interesting to go back and look at some of these old charts to see how they progressed through the years.
Lets start with the current price action and work our way out to some very long term quarterly charts.
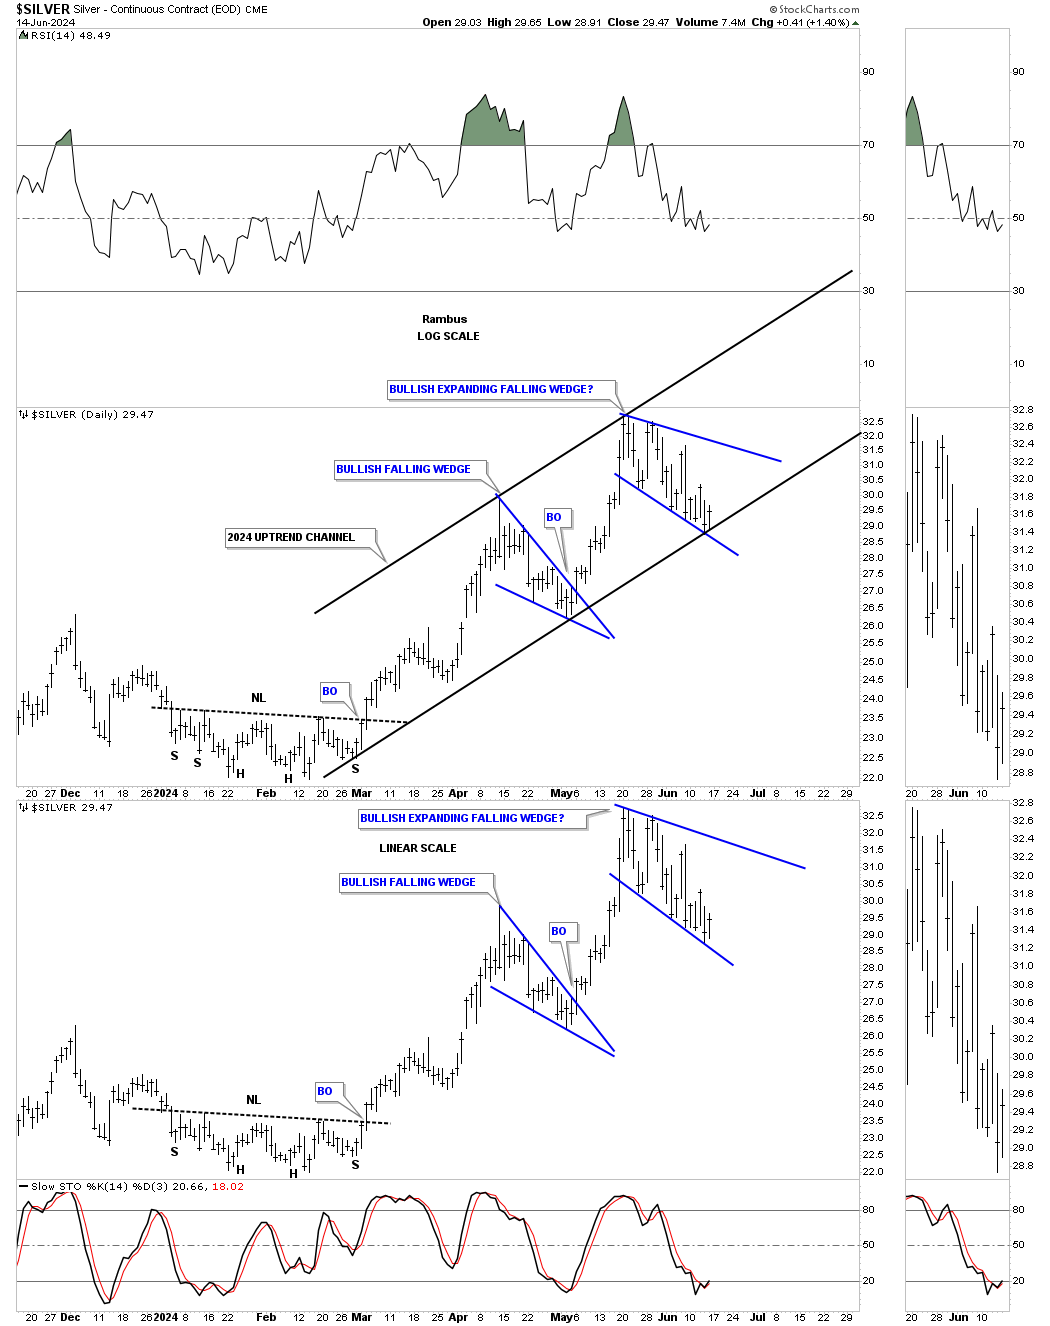
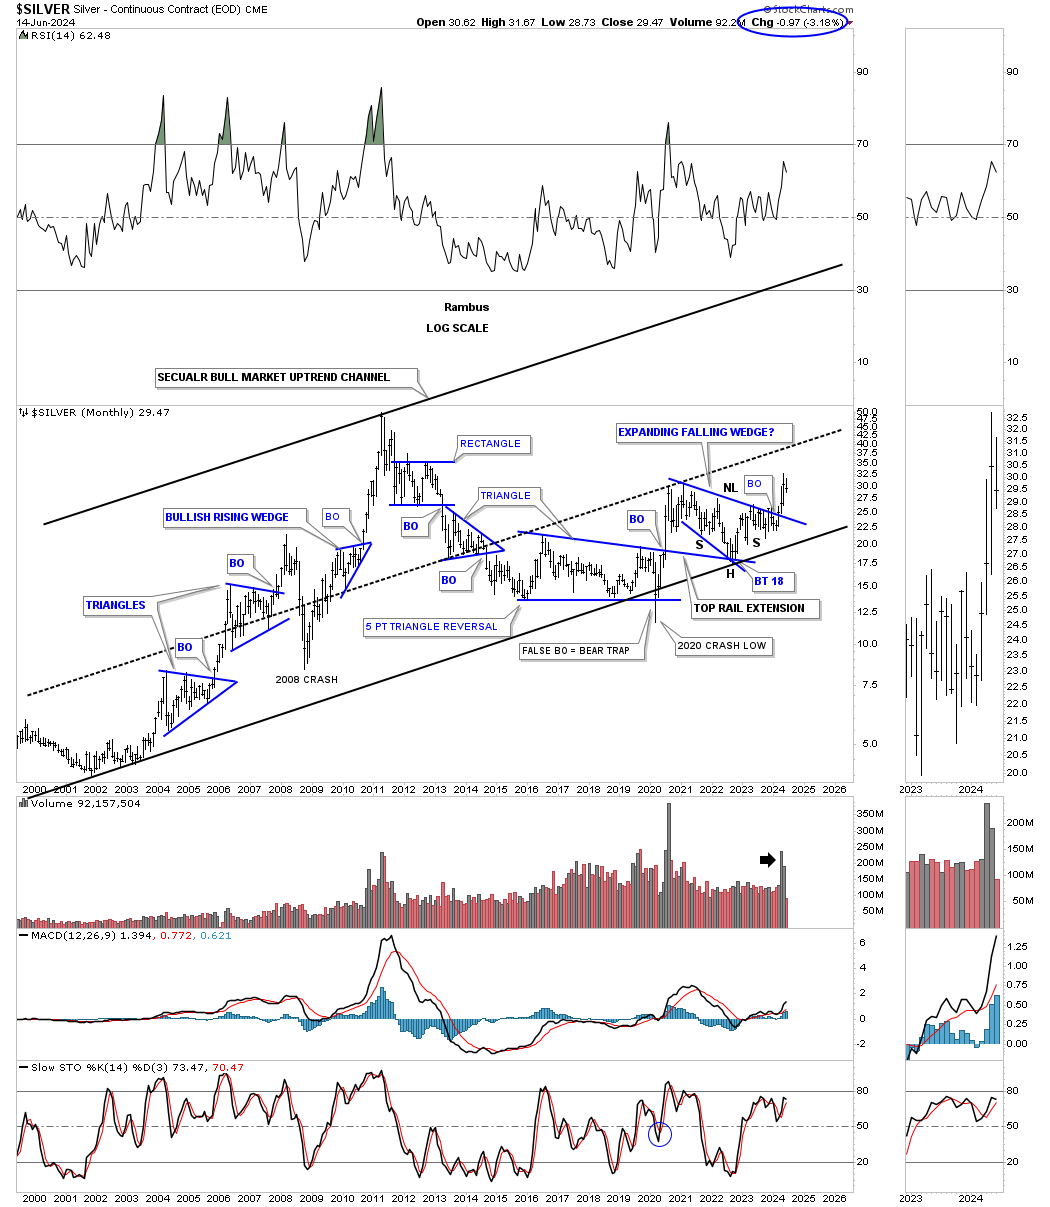
This first chart is a daily combo chart with a log scale chart on top and linear scale on the bottom just for perspective. The price action starts at the February / March 2024 H&S bottom with the first consolidation pattern being the bullish falling wedge. After that impulse move ended Silver has been working on a potential bullish expanding falling wedge with a very critical area of support where the bottom rail of the blue expanding falling wedge and the bottom rail of the parallel uptrend channel intersect. We should know shortly if this is going to play out.
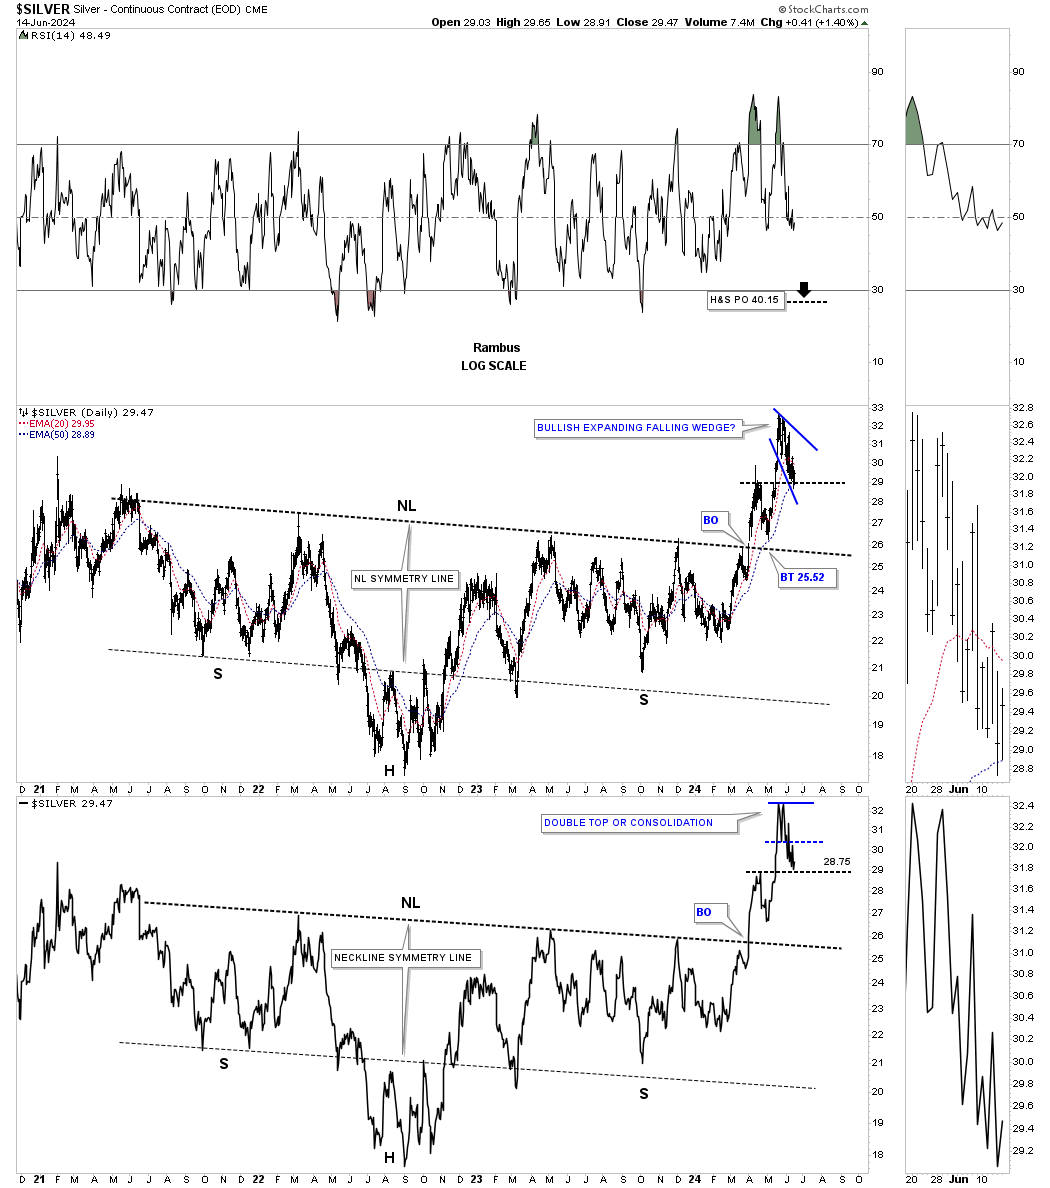
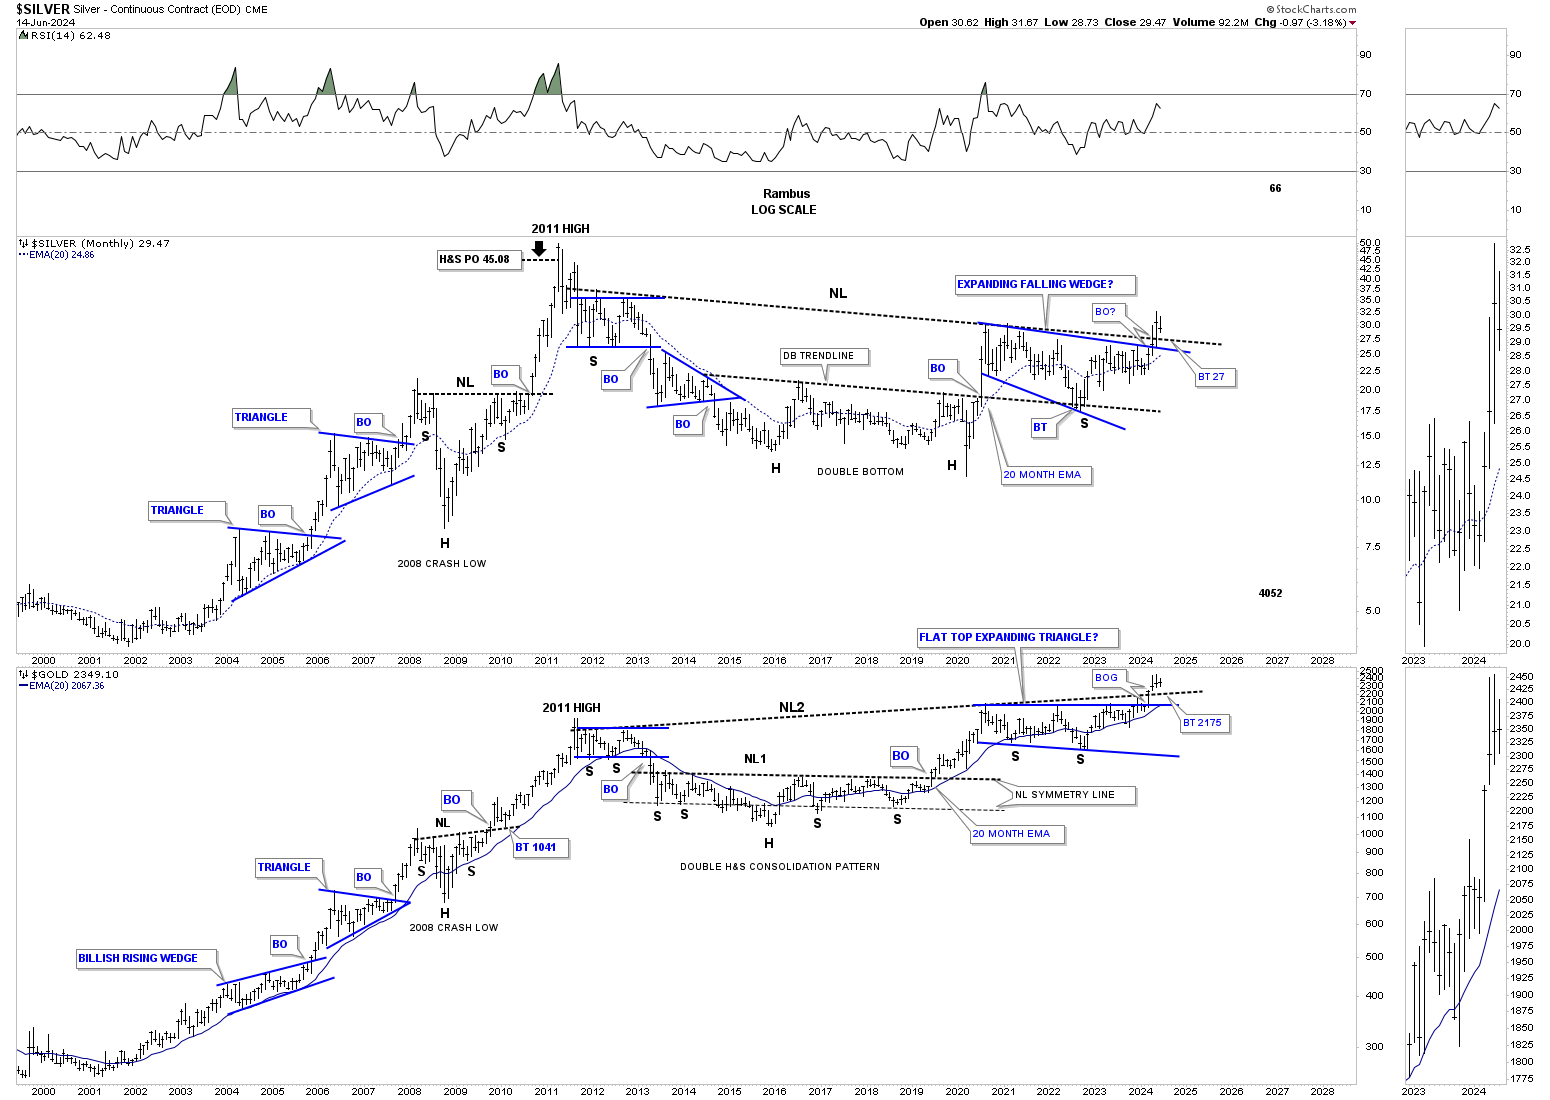
Next is the long term daily chart for Silver showing its very large H&S consolidation pattern. The bar chart on top shows the backtest to the neckline, bullish falling wedge, followed by the strong rally to the April high where the potential bullish expanding falling wedge is located. Note how the potential bullish expanding falling wedge is forming on top of the previous high of the blue falling wedge on the daily chart above. The line chart on the bottom I’ve labeled as a possible double top or consolidation pattern. If the bullish expanding falling wedge plays out then we’ll have a consolidation pattern. It’s important to take note of this nearly 3 year H&S consolidation pattern as it will play a role in the long term charts to come.
The H&S consolidation pattern on the daily chart above is just the right shoulder of this much larger 2011 massive H&S base.
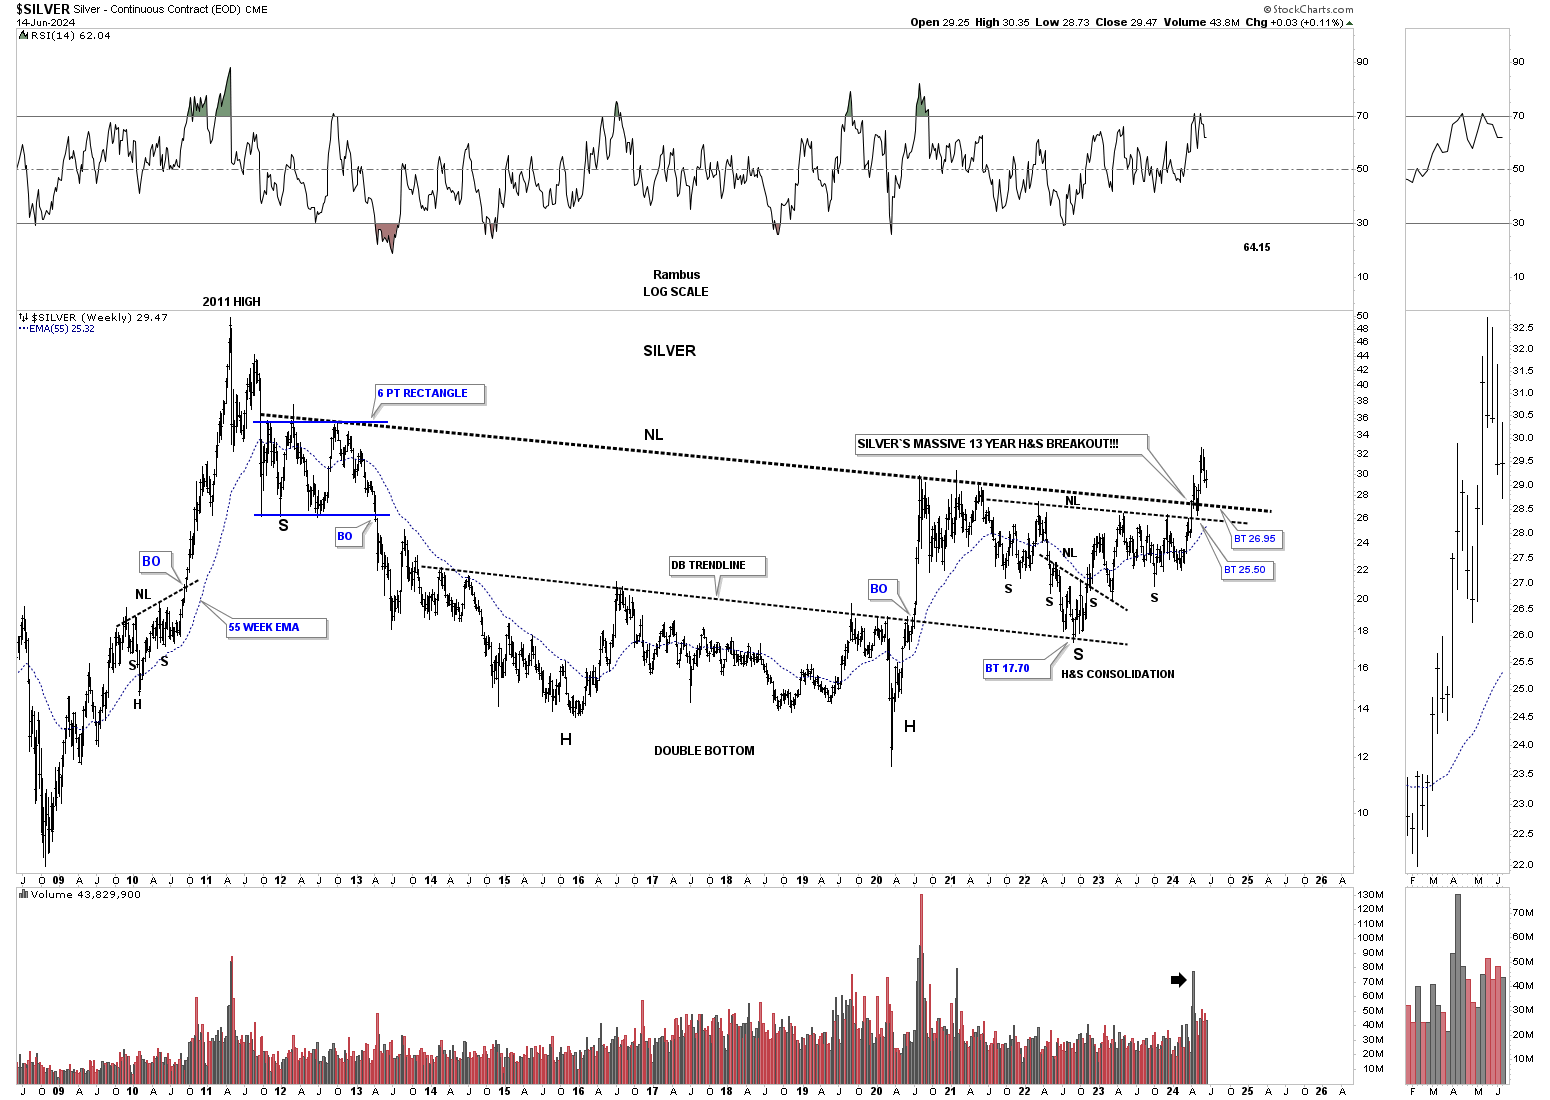
As you know we’ve been following 2 very large consolidation patterns since the 2020 high, the H&S consolidation pattern on the daily chart above and the 2020 bullish expanding falling wedge.
This monthly chart below shows Silver’s secular bull market with the blue bullish expanding falling wedge and H&S consolidation pattern forming in the same area, two for the price of one. Note the increase in volume on the breakout.
Next is the monthly combo chart we’ve been following for both Silver and Gold showing the recent breakout from their 2011 H&S consolidation pattern. On this chart I show the right shoulder on Silver forming the 2020 bullish expanding falling wedge and on Gold the bullish flat top expanding falling wedge. The only question is wether we’ll see a complete backtest to the neckline.
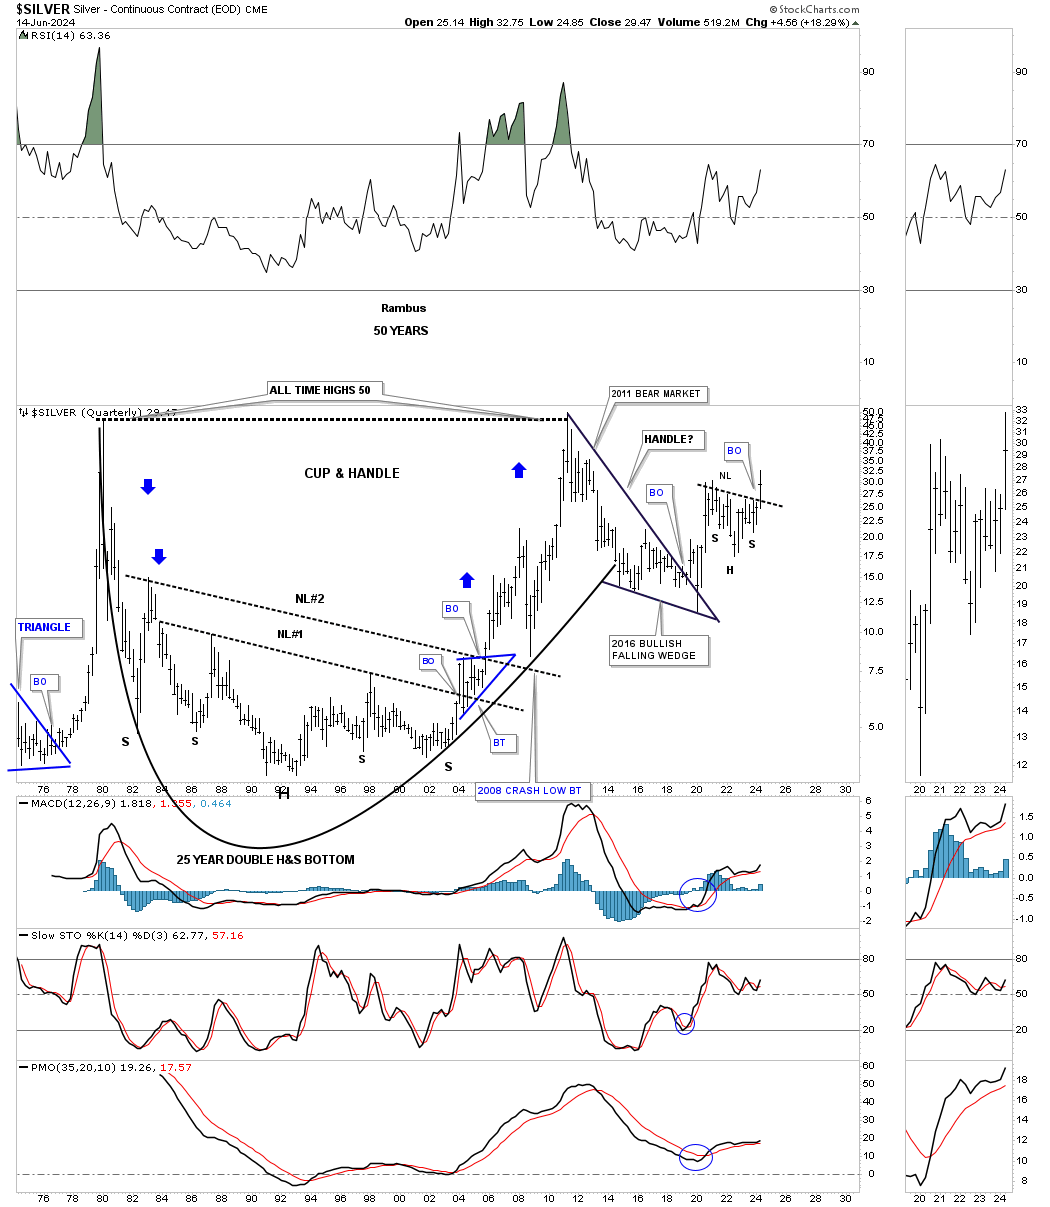
Below is the first chart I ever posted publicly back in 2005. At the time I was showing the potential massive 25 year H&S base that was forming. There was no cup and handle at the time only a very large base which no one thought was possible. As it turned out it did play out as the blue arrows show how the price action reversed symmetry back up over the same area on the way down.
What also played out very nicely was the 2008 crash in the PM complex in which Silver found support on the backtest to neckline #2 confirming the validity of that significant neckline. As you can Silver reversed symmetry all the way back up to the 1980 all time high before topping out at 50 once again.
Our longer term member may recall the 2016 bullish falling wedge which formed in the PM complex which was another one of those long drawn out consolidation patterns which finally gave way to the 2020 rally. On this quarterly chart it was the 2011 bear market bullish falling wedge which formed the possible handle of the very large cup and handle formation. I really don’t know if it even qualifies as one now, but the Chartology is still playing out beautifully.
Note the breakout of the H&S consolidation pattern we’ve been following on the daily and weekly charts for the 2nd quarter of 2024. Again, the only question I have is if we’ll see a completed backtest to the neckline.
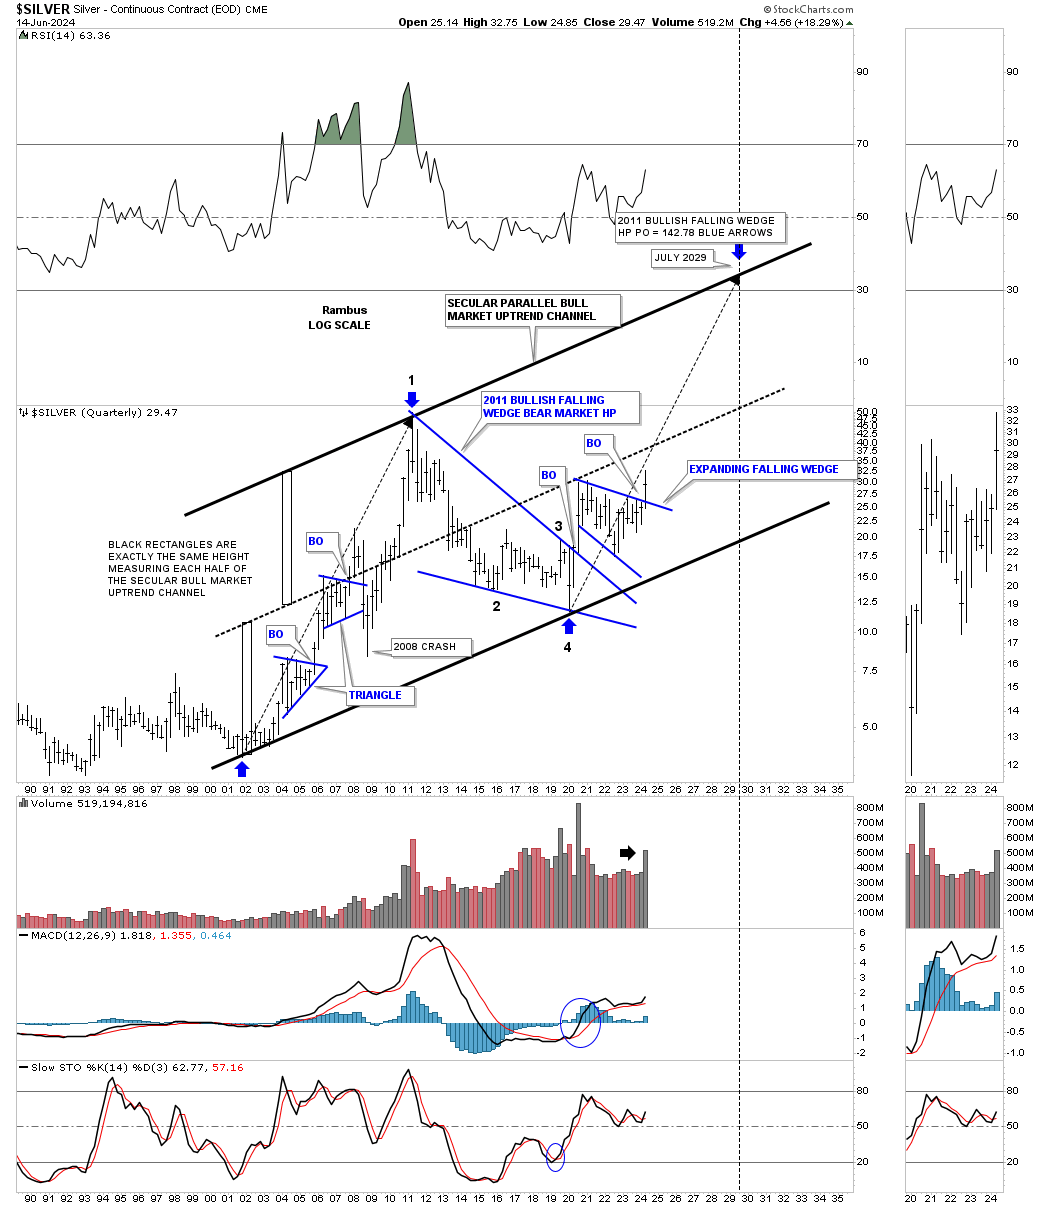
This next quarterly chart shows Silver’s secular bull market uptrend channel with the quarterly breakout from the blue bullish expanding falling wedge.
When I first built this chart it was shortly after the breakout from the 2011 blue bullish falling wedge confirming reversal point #4 was an important low. At that point I was able to draw in the bottom trendline off the 2002 low and moved it up to the 2011 high showing a possible new uptrend channel. I then added the narrow rectangles to show if there was a center dashed midline that helps confirm a new uptrend channel if it fits in nicely between the lower and upper trendlines.
Next I could add the long black arrow taken from the 2002 low to the high in 2011, add it to the 2020 low, to make a price objective up to the 147 area in July of 2029. When you are working with a nice clean parallel uptrend channel this technique can work out pretty well in time and price. As you can see the price action is following the angle of the 2002 to 2011 bull market fairly closely.
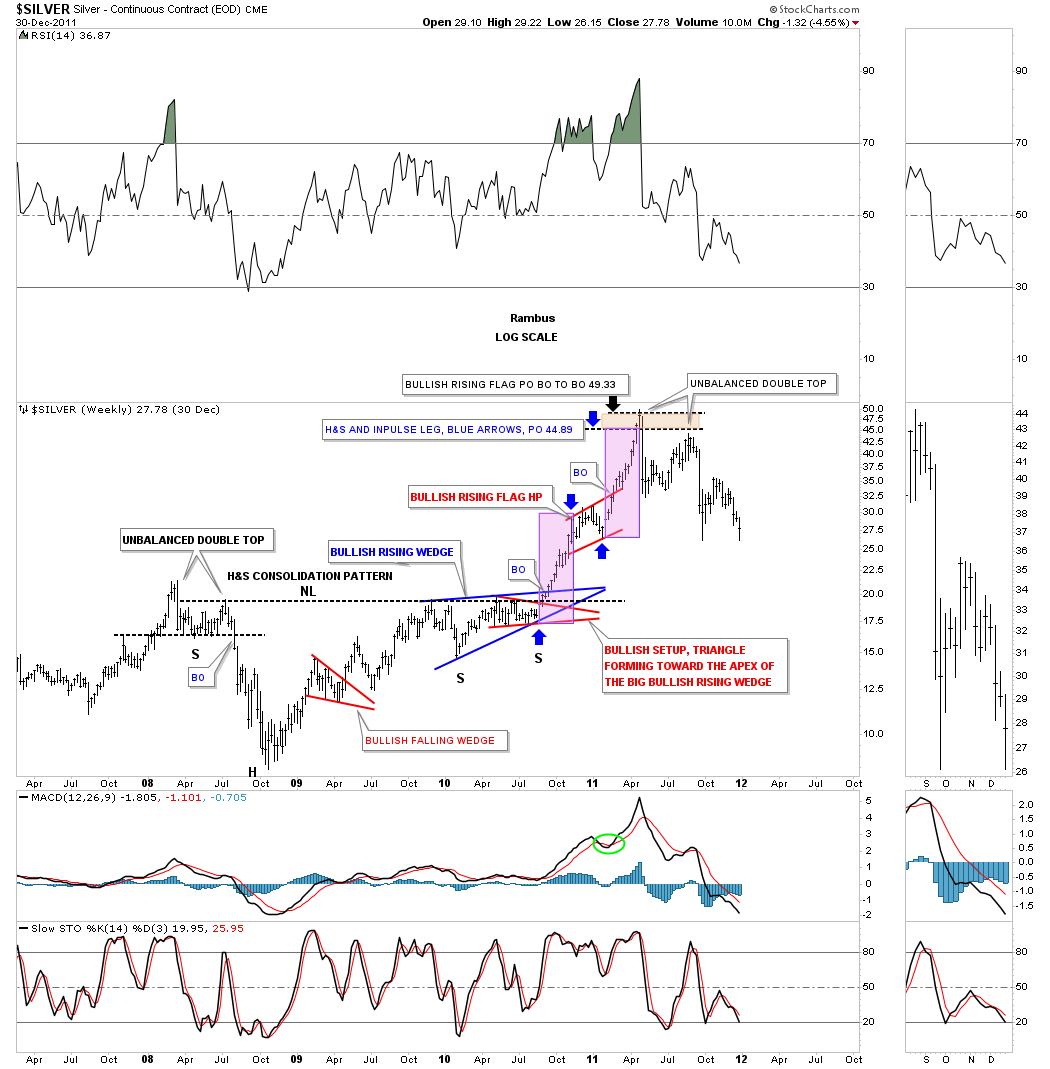
This last chart for today is the weekly chart for Silver which shows the 2008 H&S consolidation pattern which was similar to the one I refer to on some of the long term charts for Gold which formed a very symmetrical 2008 H&S consolidation pattern.
As you can see the right shoulder was fairly complex with the blue bullish rising wedge with the red triangle forming toward the apex which is usually a very bullish setup.
The pink shaded areas show the price and time for each leg of the impulse move leading into the 2011 all time at at 50. There were actually 3 different price objectives as shown by the brown shaded target area. Note how the 2 pink halves of the impulse move to the 50 high were separated by the beautiful red bullish rising flag halfway pattern.
From all time frames Silver still looks very bullish. It’s always the short term that is hard to deal with which is why the longer term charts are important to help keep your emotions balanced. Even when you know the road map you can still get lost sometimes, but if you know the general route to your destination you will finally get there.
I would like to wish all the fathers a Happy Fathers Day and enjoy this day with your family. All the best…Rambus