 I’ve been watching the SILJ very closely for confirmation that the silver juniors are finally ready for their turn to run. You may have noticed that today’s action in the PM complex was fairly subdued as the backtest to the top rail of the April bull flag is taking place, but many of the small and micro-cap silver stocks showed some decent gains.
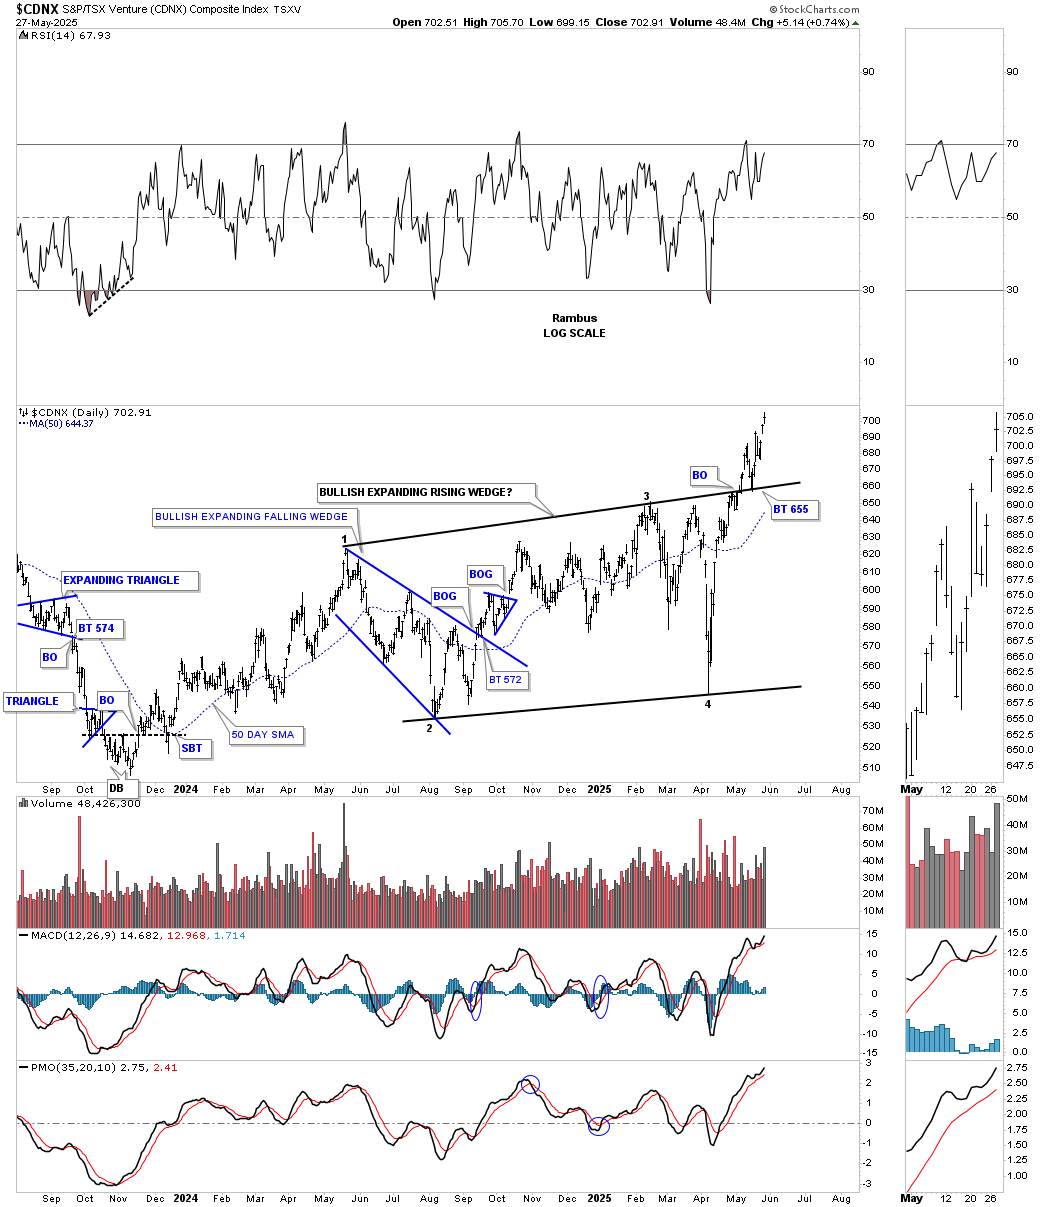
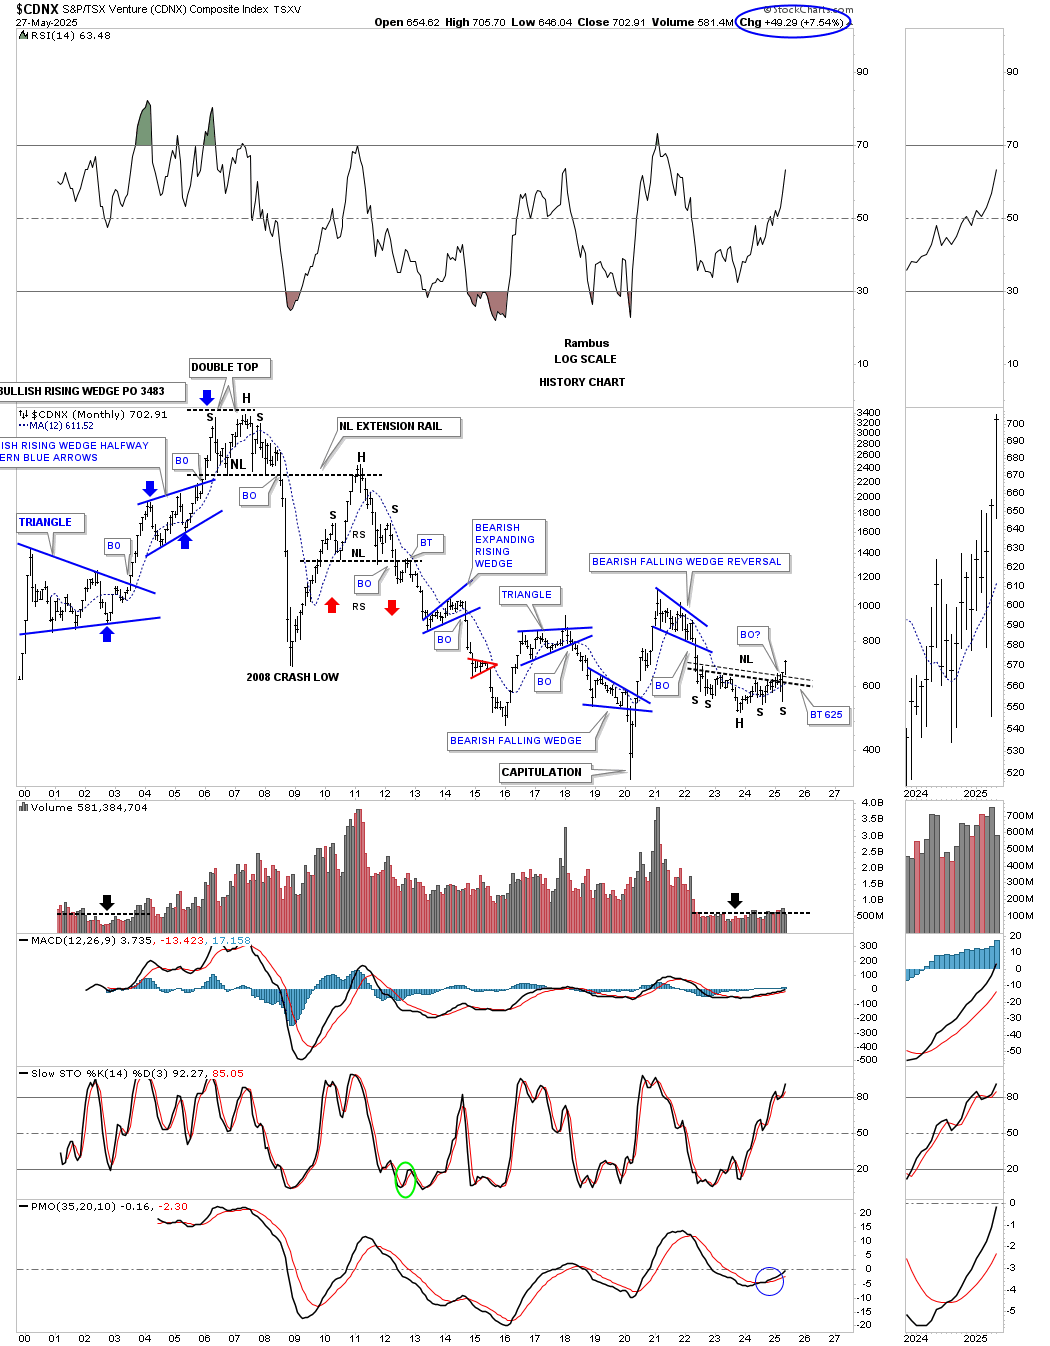
Let’s start with the daily chart for the CNDX, which shows the one-year bullish expanding rising wedge we’ve been following, showing the perfect breakout and backtest, with the price action taking out the breakout high, which is what we want to see from the PM stock indexes, which hasn’t happened yet.
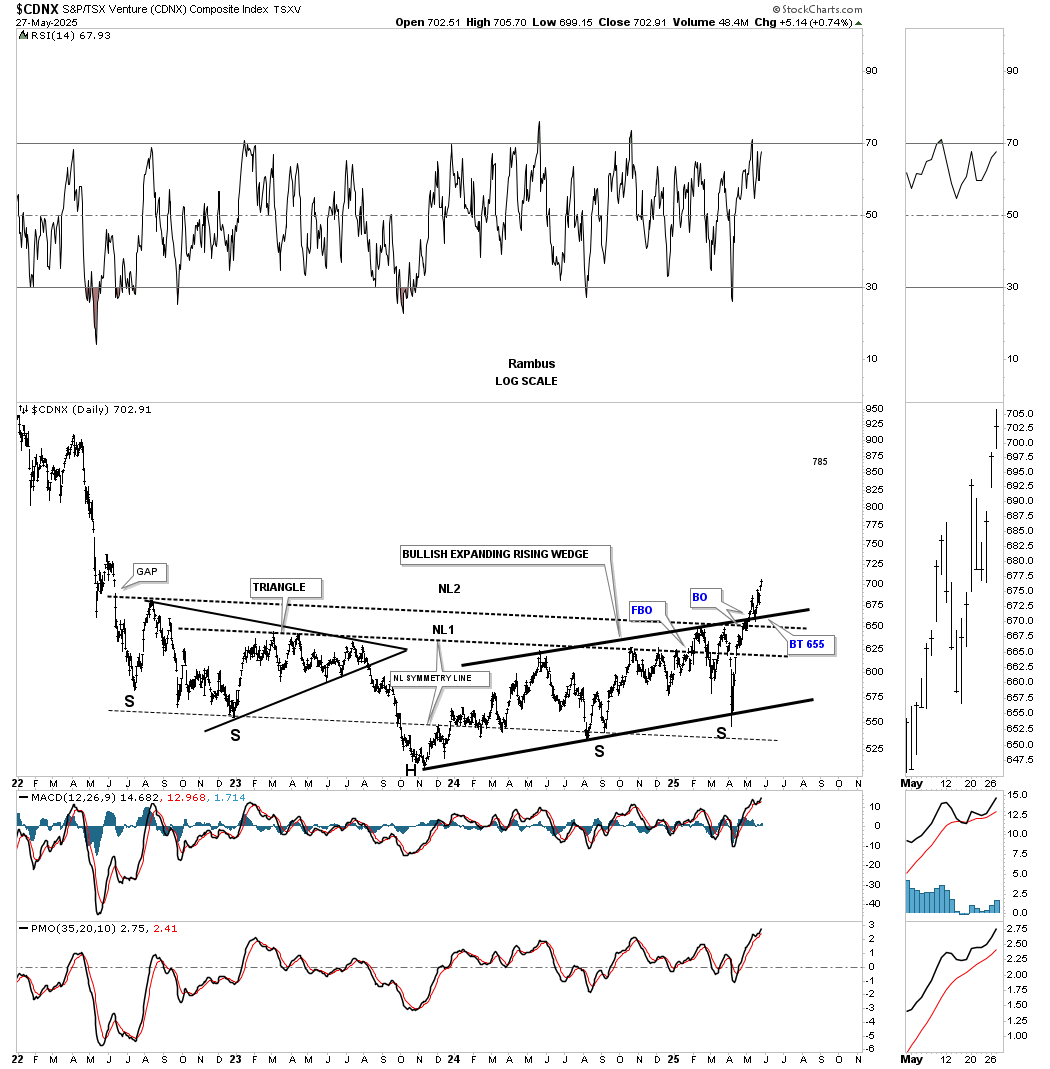
This daily chart puts the bullish expanding rising wedge into perspective, with the double breakout above the top rail of the expanding rising wedge and NL2 with a clean backtest on NL2.
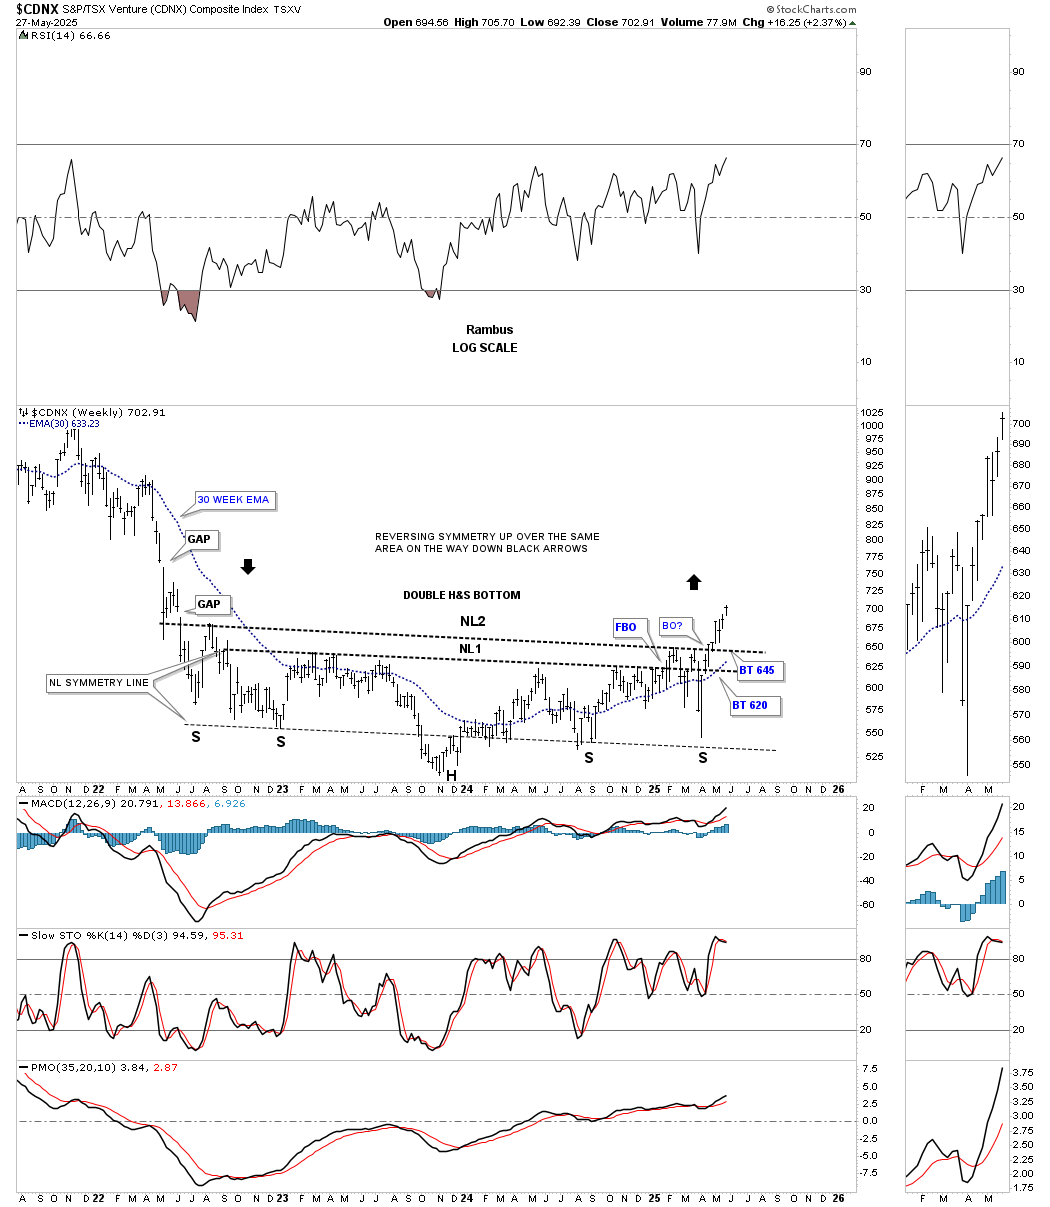
I call this weekly chart the “clean” double H&S bottom because of its clean and simple look, which is also very symmetrical, as shown by the neckline symmetry line. This chart also shows how we could see reverse symmetry to the upside over the same area on the way down, as shown by the black arrows.
Note how today’s weekly bar opened above last Friday’s close, which technically would have been a gap if it weren’t for the intraday high made last Friday.
This monthly history chart shows that the month of May has been very good for the CDNX, continuing its breakout move. It’s always possible we could get a backtest, like in 2012, but there’s no way to know. Looking at the other trading ranges, with the exception of the 2012 backtest, most don’t show much of a backtest, if any. Once the breakout occurred, it was off to the races.
The last time we looked at this history chart, I suggested that when the current inverse H&S bottom broke out, we should expect to see volume begin to rise, which has happened to a small degree so far.
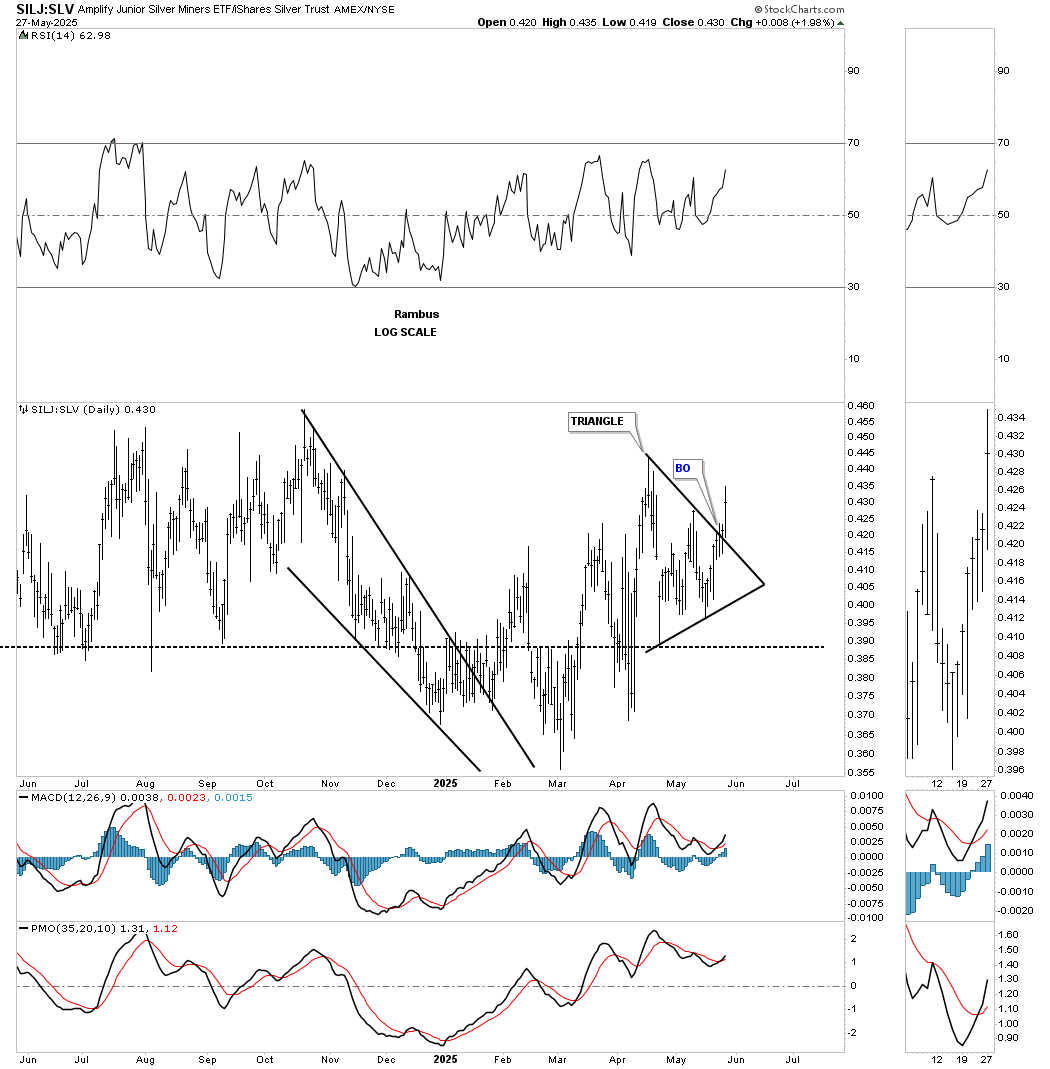
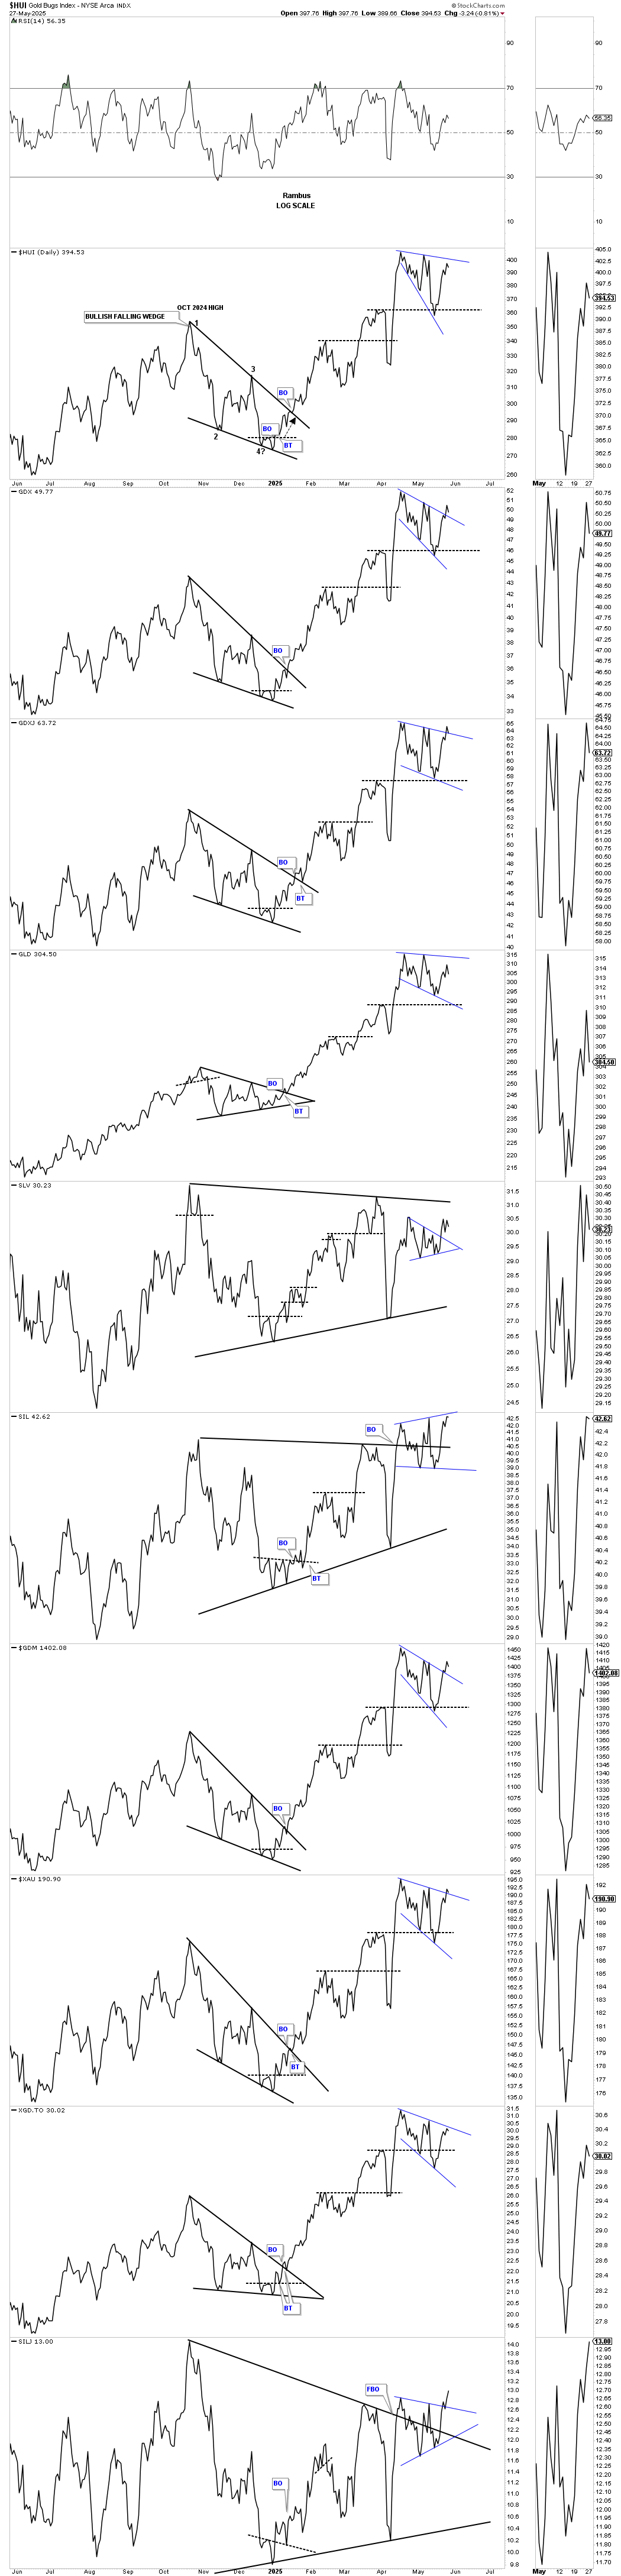
Now I would like to focus on the SILJ, silver juniors ETF. SILJ has formed the black triangle consolidation pattern, which experienced a weak breakout, which then formed the smaller blue triangle as the backtest. We’ve discussed many times in the past how a backtest of the breakout can form a small consolidation pattern just below, just above, or right in the middle of the top trendline. As you can see, the blue triangle has formed in the middle of the top trendline, with a breakout and small backtest, with today’s high slightly higher than the high of the blue triangle on this daily line chart perspective.
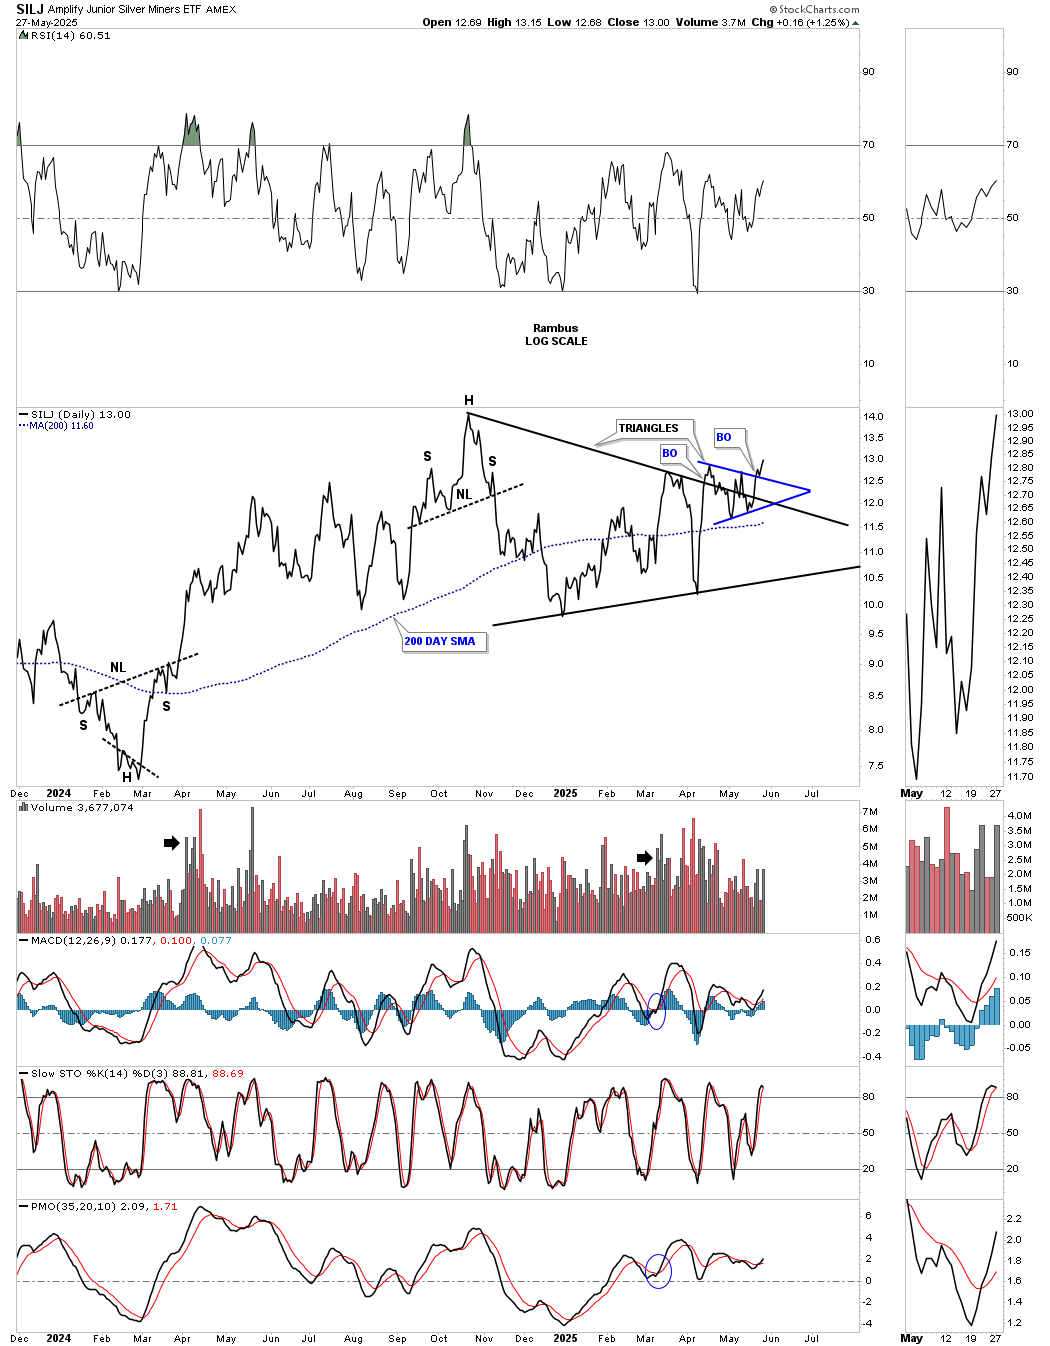
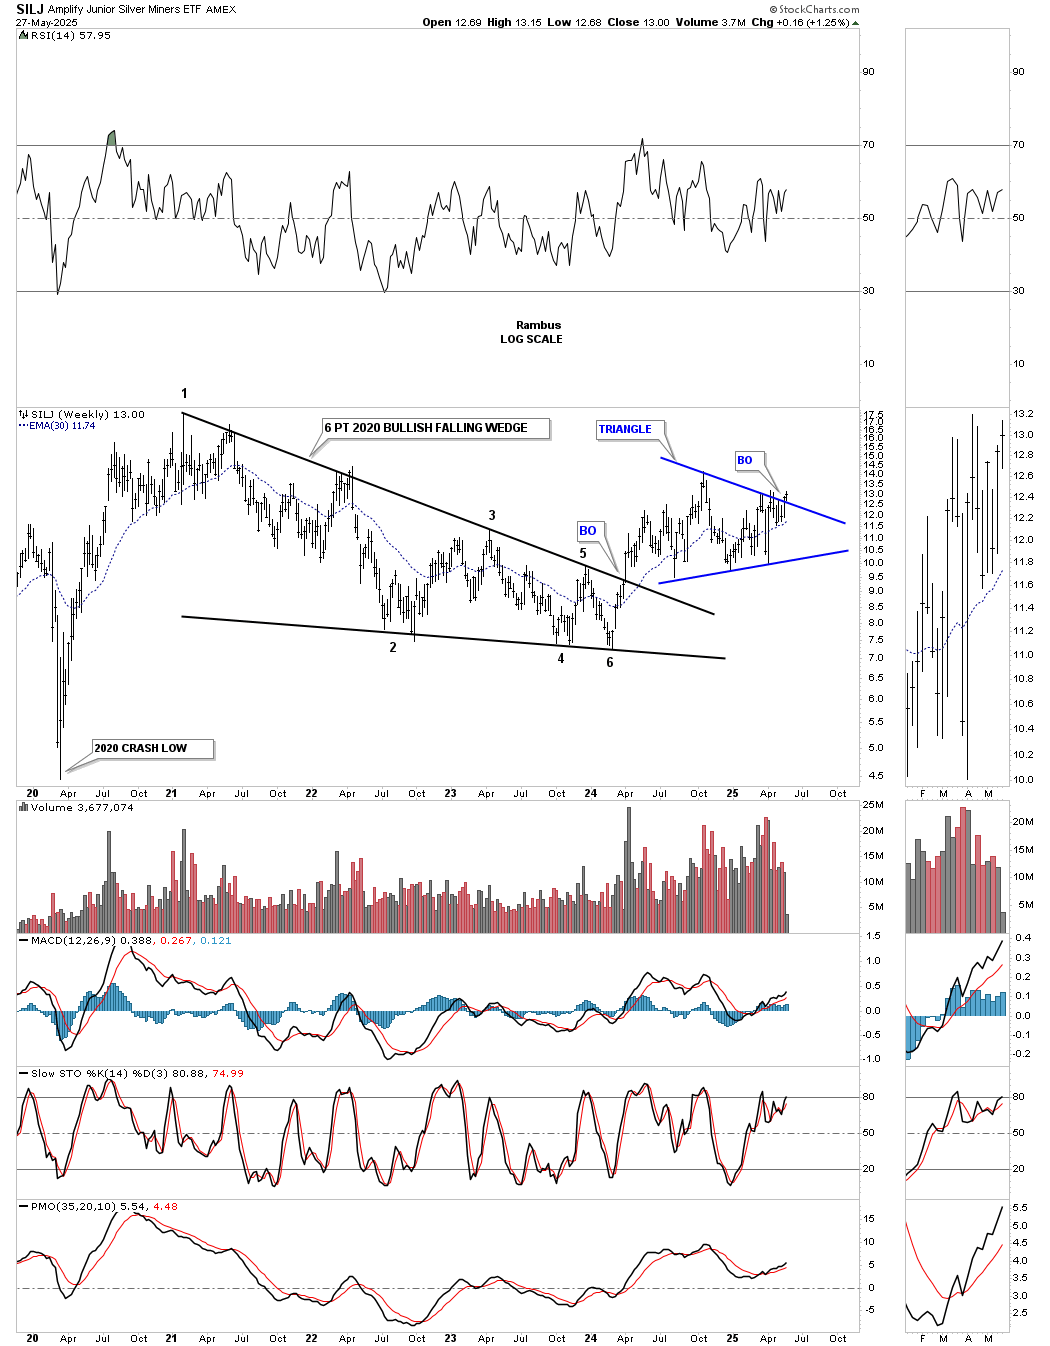
The bigger triangle on the daily chart above has formed above the breakout point of the 2020 bullish falling wedge as the first consolidation pattern.
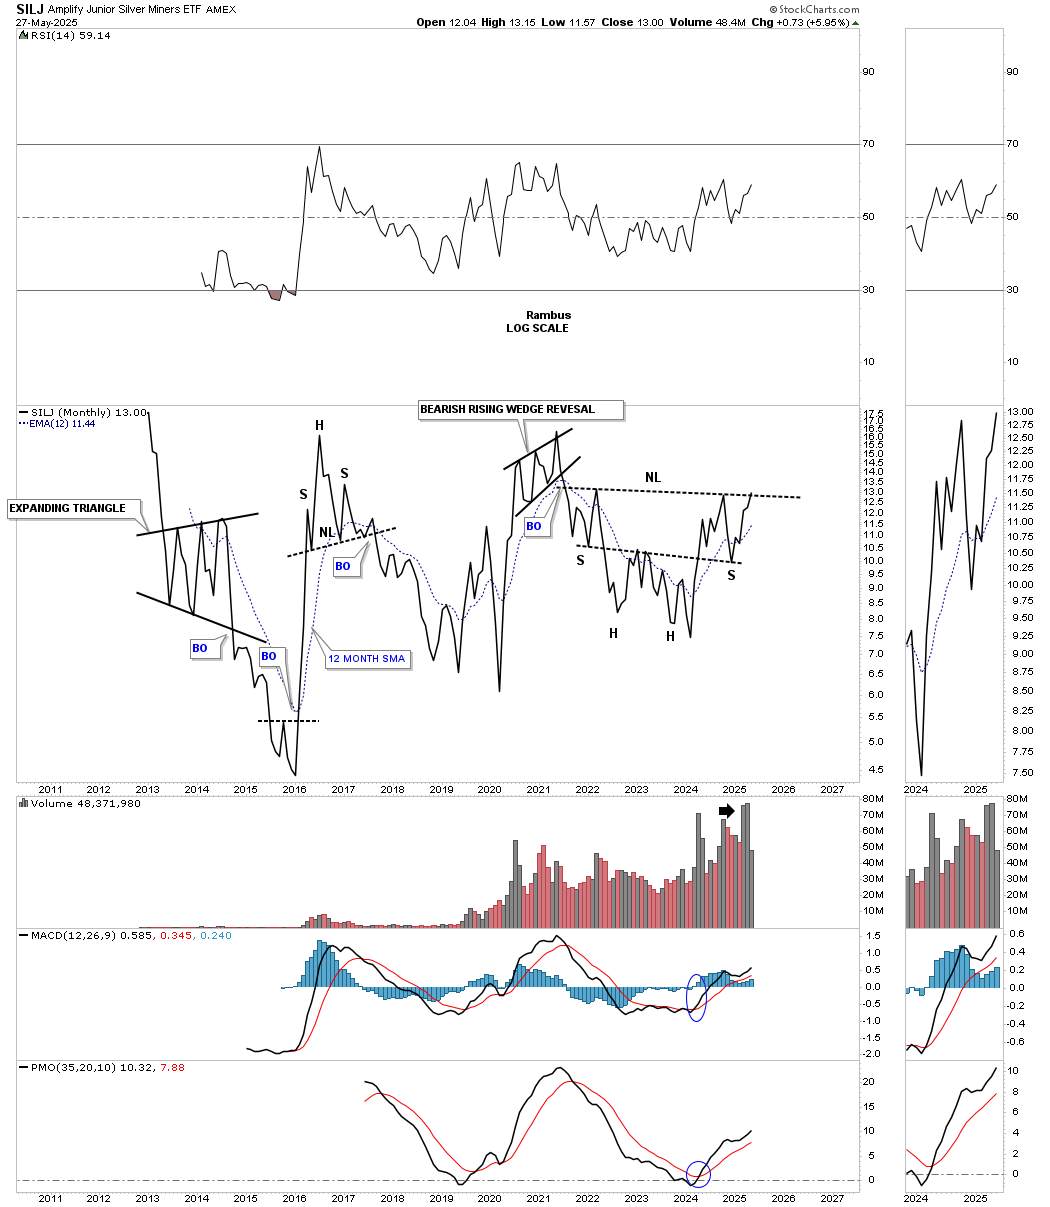
What’s really intriguing on this monthly line history chart is the double headed H&S consolidation pattern, with the price action now testing the neckline. Note how the volume has been rising off the right shoulder low, which suggests interest in this sector.
I mentioned at the beginning of this post how many of the junior and micro-cap silver stocks outperformed silver in a big way today. Below is a one-year daily ratio chart that compares SILJ:SLV. Note the very long daily bar formed on the breakout from the April triangle today. The silver juniors really outperformed silver today.
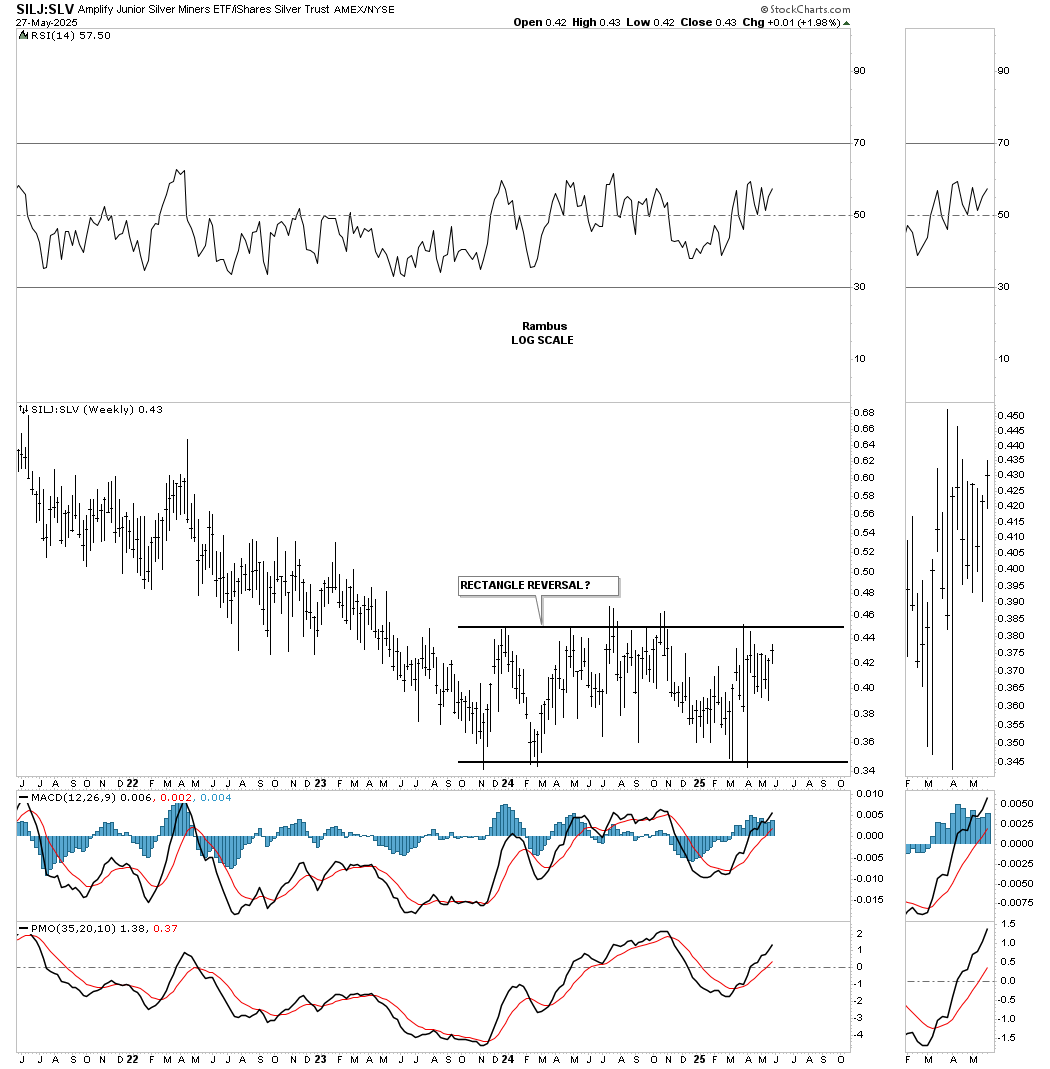
The SILJ:SLV weekly ratio chart shows a large rectangle forming since the end of 2023, which currently has an odd number of reversal points, which will be confirmation that the rectangle will be a reversal pattern if the top rail is taken out.
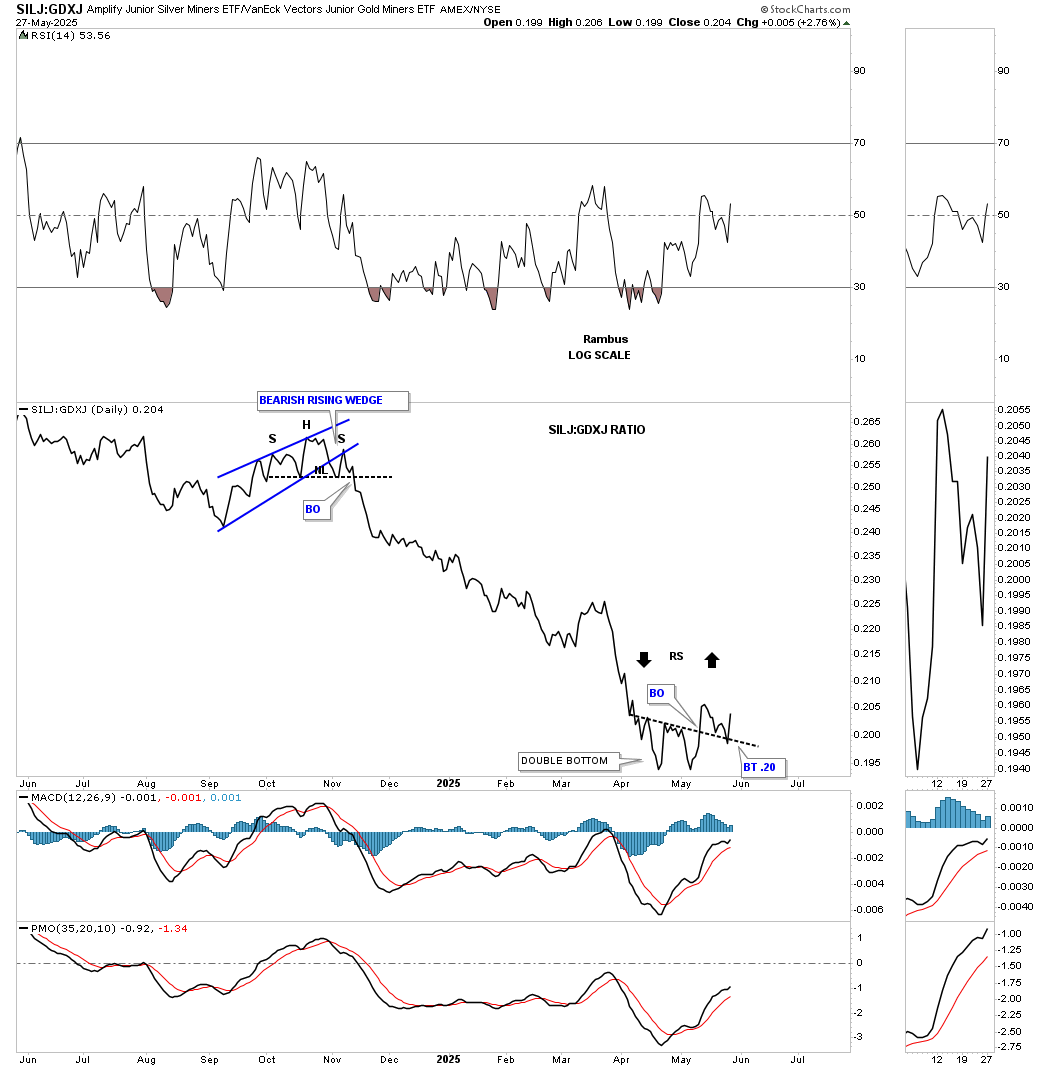
Below is a one year daily line chart which compares SILJ:GDXJ. As you can see the SILJ has been massively underperforming the GDXJ until the double bottom formed in April and May. There was a breakout and a clean backtest to the double bottom trendline and then the big move higher today showing the SILJ outperforming the GDXJ.
Since the decline into the double bottom low was very strong there is a good chance we could see some reverse symmetry to the upside over the same area on the way down as shown by the black arrow.
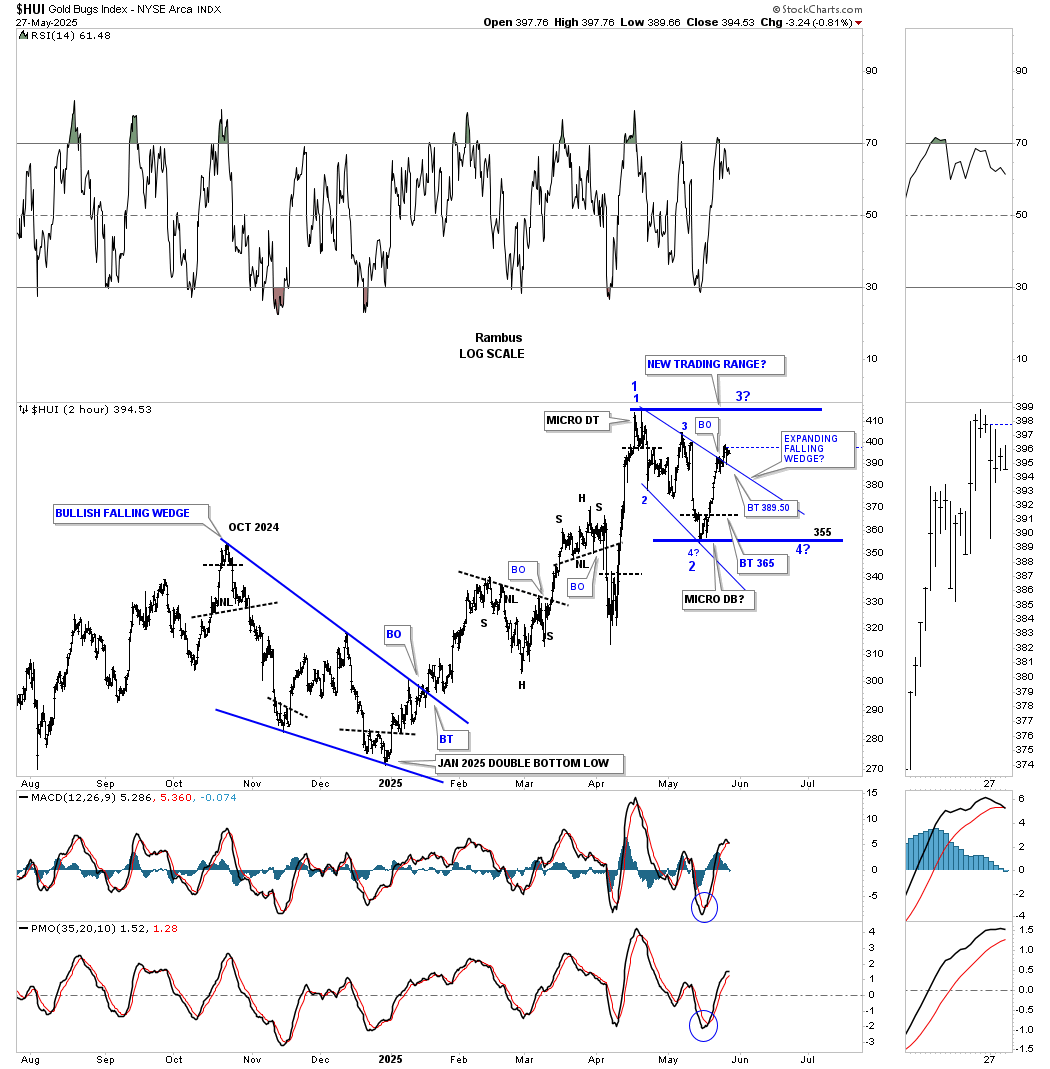
After breaking out above the top rail of the blue expanding falling wedge last week, the HUI was in backtest mode today. The two questions that still remain are: Will the small expanding falling wedge be a standalone consolidation pattern that will lead to a new higher high for this move, or will it be the first and second reversal points in a bigger consolidation pattern? Whatever scenario plays out, both consolidation patterns are forming above the October 2024 high of the bullish falling wedge, with one consolidation pattern forming above the previous one, which is how bullish impulse moves work.
Below is a simple daily line chart showing the small April trading ranges. Note how SIL, and in particular SILJ at the very bottom of this combo chart, are the first two to trade above their April high, outperforming the rest of the PM complex on a relative basis.
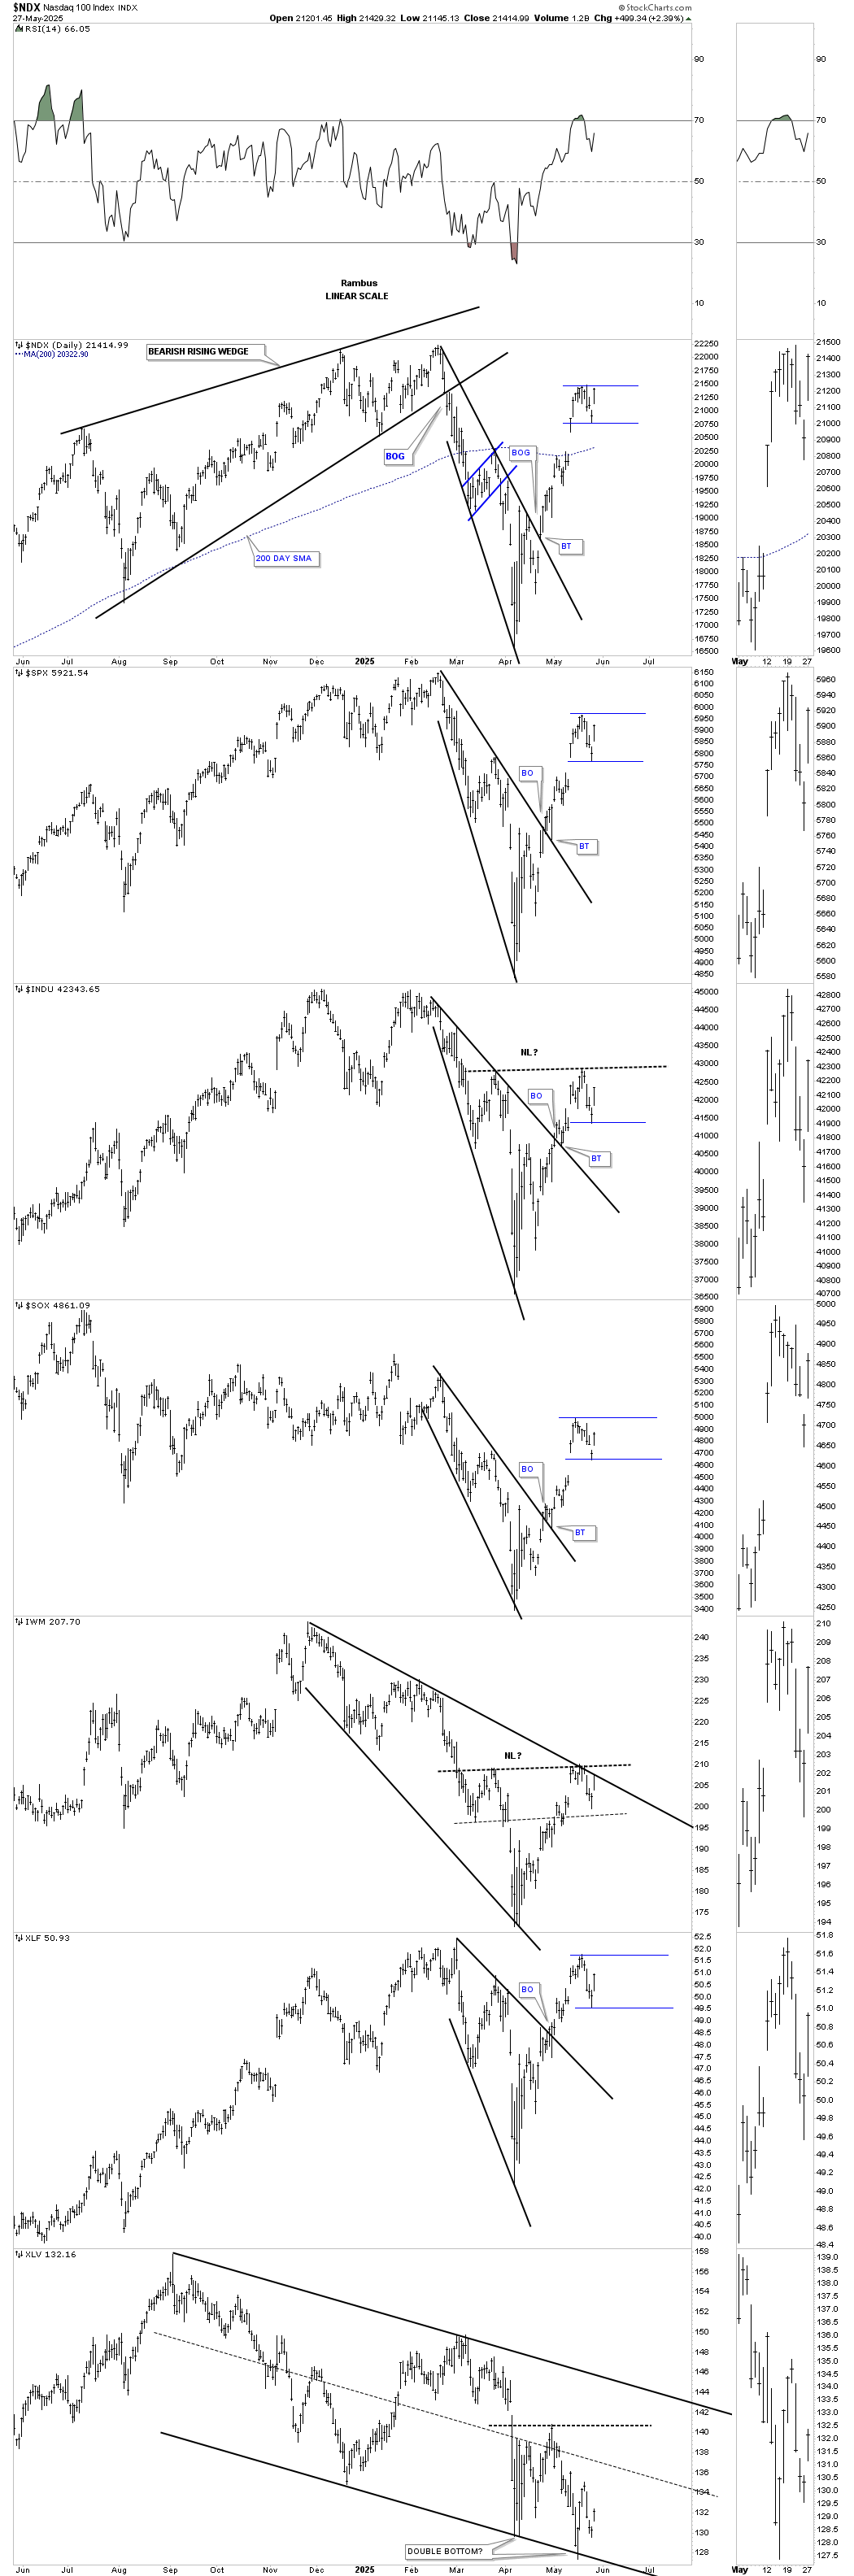
Moving on to the US stock markets, below is the daily combo chart we’ve been following very closely, which shows the price action testing the double top trendline and, in most cases, the bottom rail of the rising wedge. This combo chart can still have bearish implications, but I’ve built another daily combo chart from the bullish perspective today, which I’ll show you next.
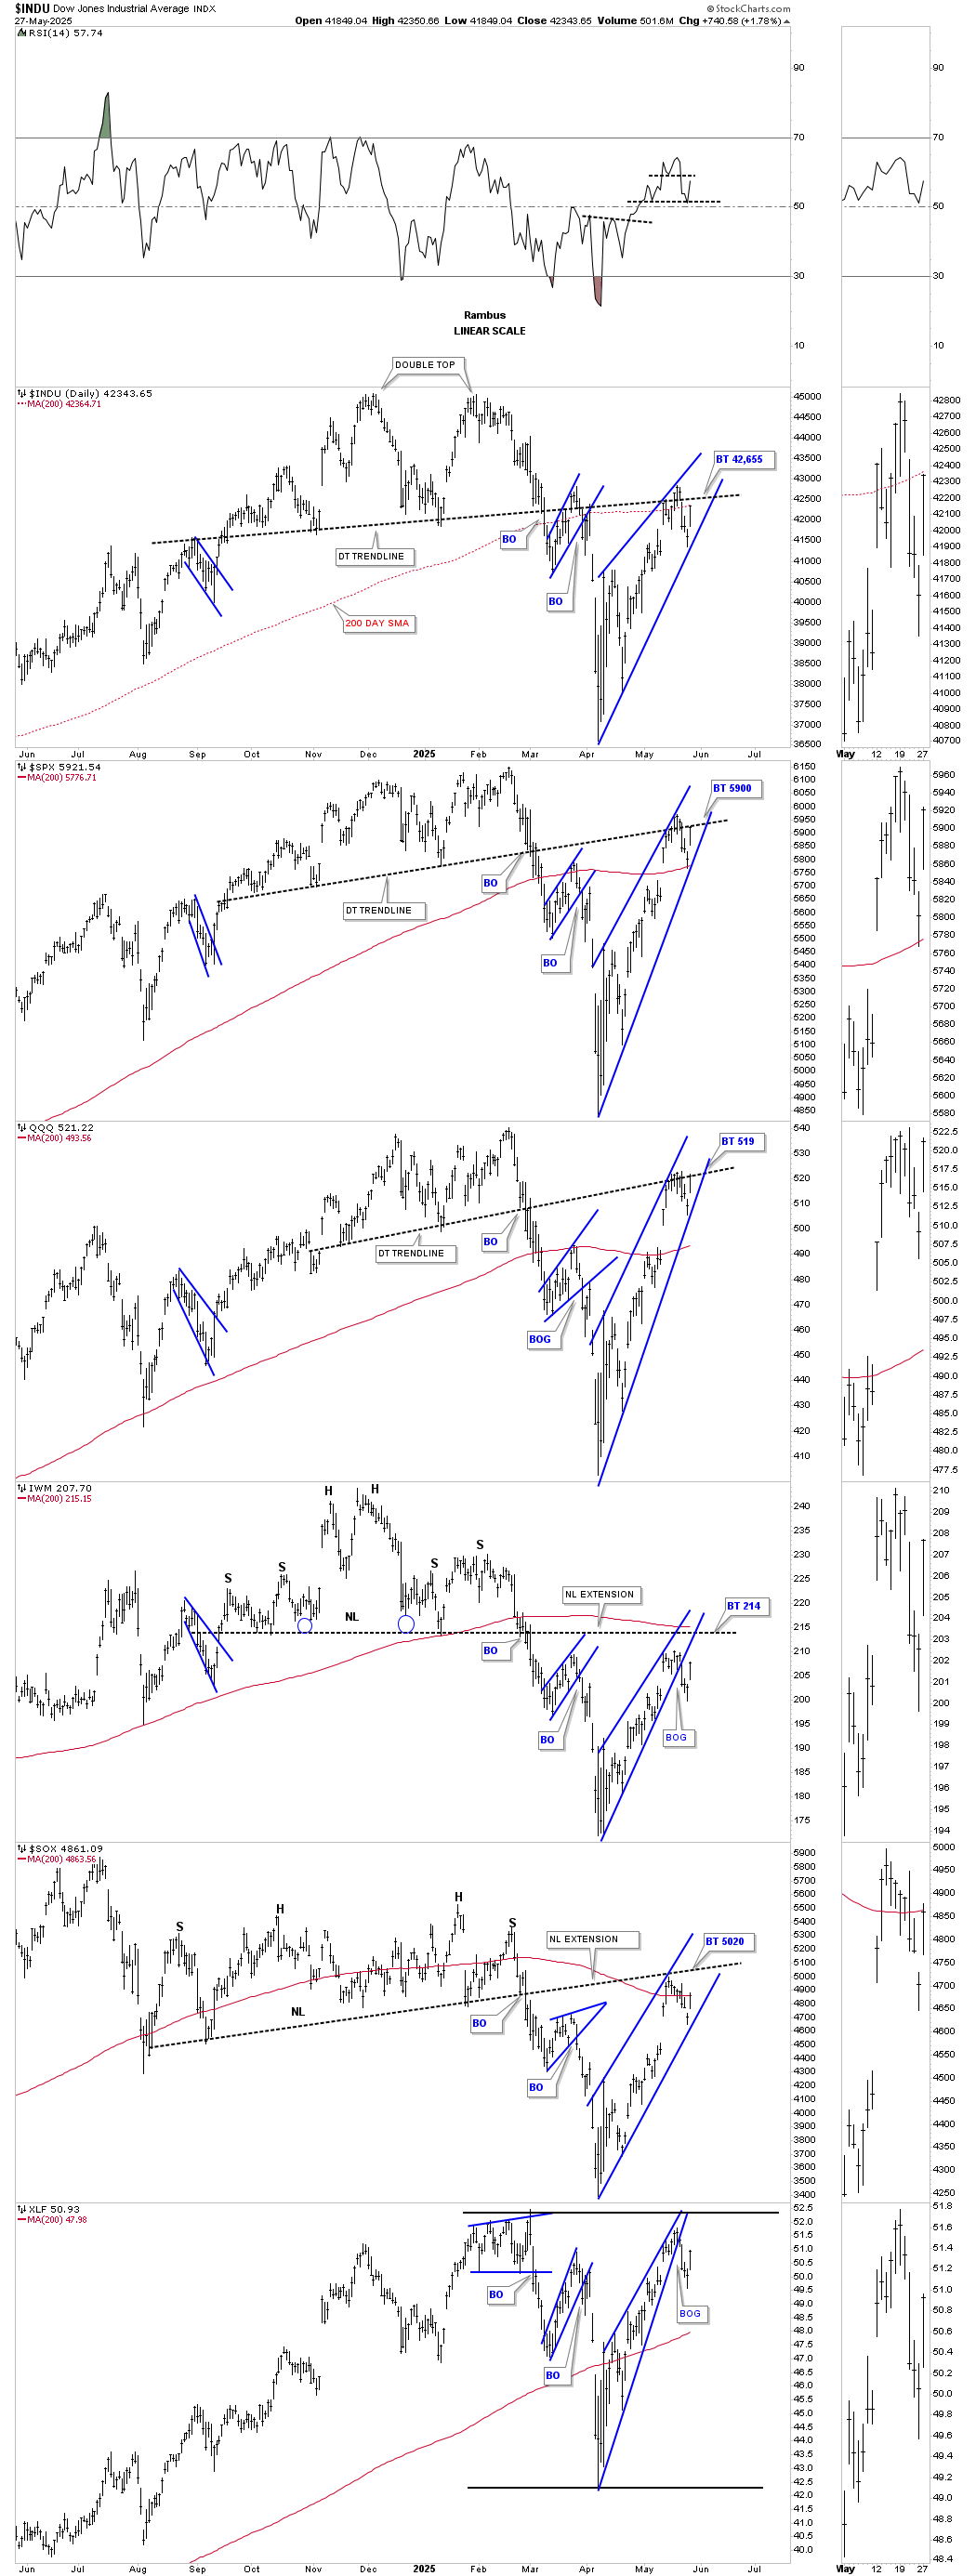
Below is the new combo chart I built today after the markets were up strongly, from the bullish perspective. As you can see, the big decline started at the all-time high reached in February and formed a bullish expanding falling wedge in most cases. When I drew in the top trendline, I immediately noticed some breakout gaps to the upside and then a nice clean backtest.
If the bulls are still in charge, what I’m looking for next is for a small blue consolidation pattern to start forming, which will need at least one more decline toward the bottom of the thin blue trendline. If a small consolidation pattern can form, this will be the first sign that the April low is a very important low, and we could be back to the melt-up phase we were discussing before this correction began. Also, notice how the INDU and the IWM could be forming the right shoulder of an inverse H&S bottom.
If the correction that began at the February high is just that, then new all-time highs are not far off, especially if the possible small blue consolidation patterns complete with one more reversal to the bottom blue trendline.
With SILJ now showing relative strength, I’m inclined to start a new micro-cap portfolio for PM stocks under $1.00, with maybe 5 to 10 positions strictly for speculation. Let’s see what the next day or two bring. All the best…Rambus.