
The clues are beginning to mount that the PM. complex may be in trouble. I don’t say this flippantly, but to just make you aware of what could happen as more clues become available.
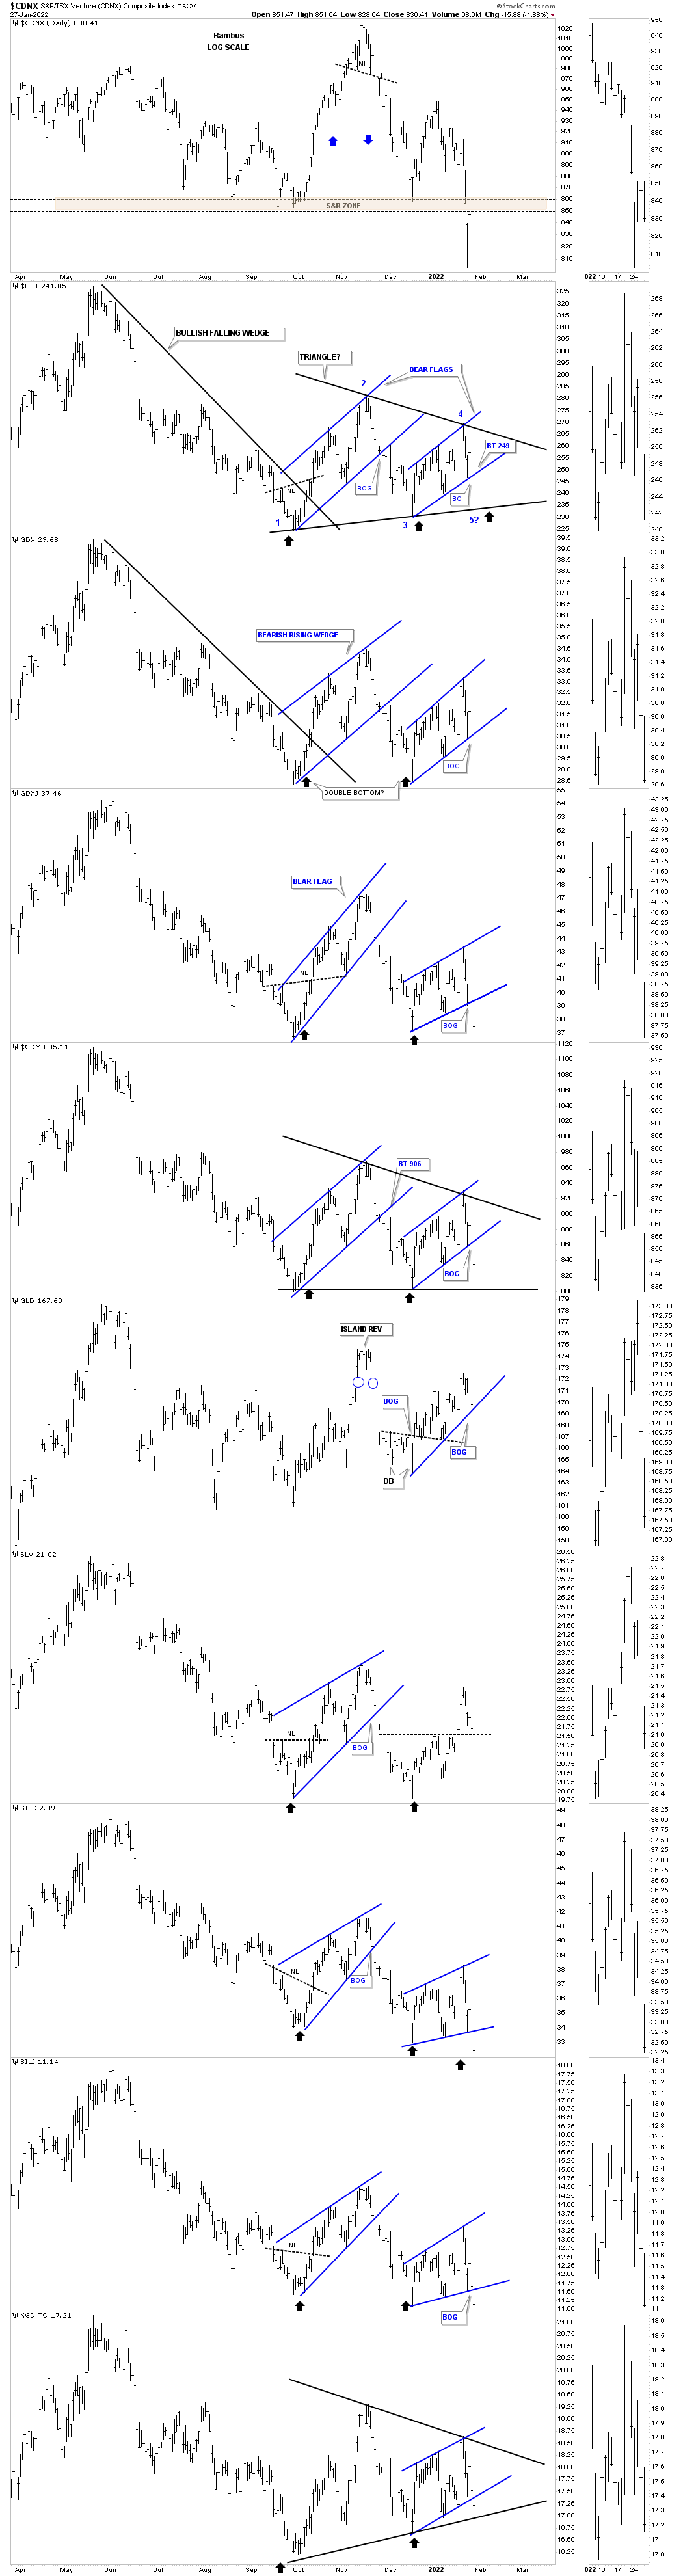
Today the small blue flags experienced a breakout gap below the bottom rail, which is step number one. Its very possible we could see a backtest to the bottom trendline and if it holds then the all important bottom rail of the possible black triangle comes into play.
This is where the rubber meets the road. I explained this week that if the price action touches the bottom rail of the black triangle that will complete the all important 4th reversal point putting the triangle into the consolidation pattern category. That will be a big deal whether we like it or not. If the bulls can’t save the bottom rail then the very minimum downside we could expect would be the width of the triangle added to the breakout point. On the other hand the triangle could be a halfway pattern to the downside taken from the June high. For now lets see what happens if the price action reaches the bottom trendline. I’m out of annotation so use the HUI as your proxy for the other indexes.
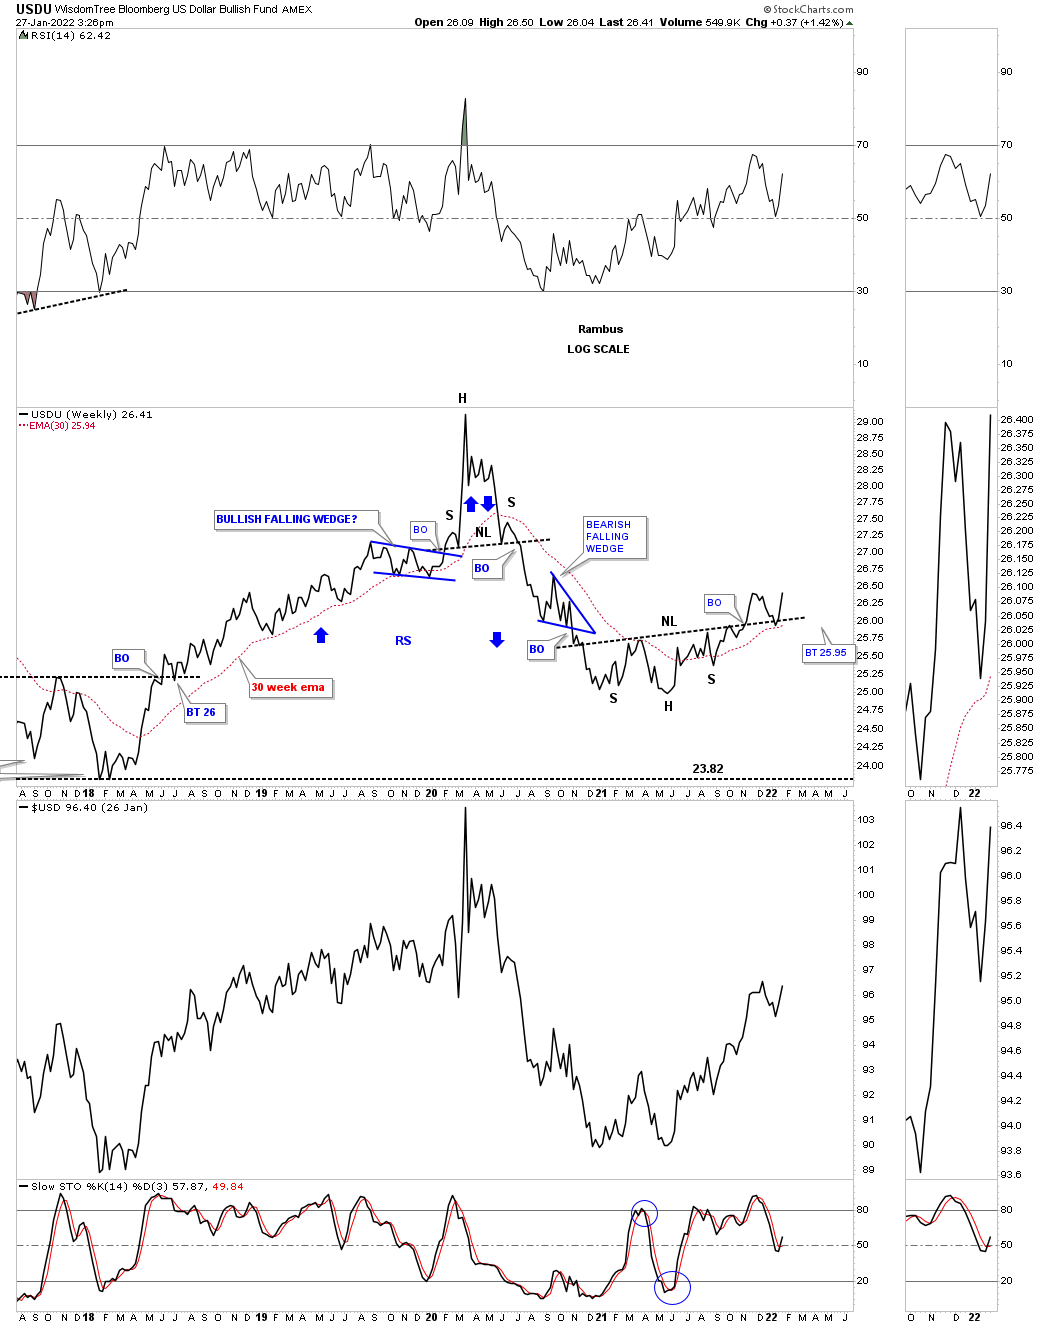
A very big piece of the puzzle happened today with the UUP which I will show you in a minute. First is the USDU dollar chart which is a more balanced way to look at the US dollar.
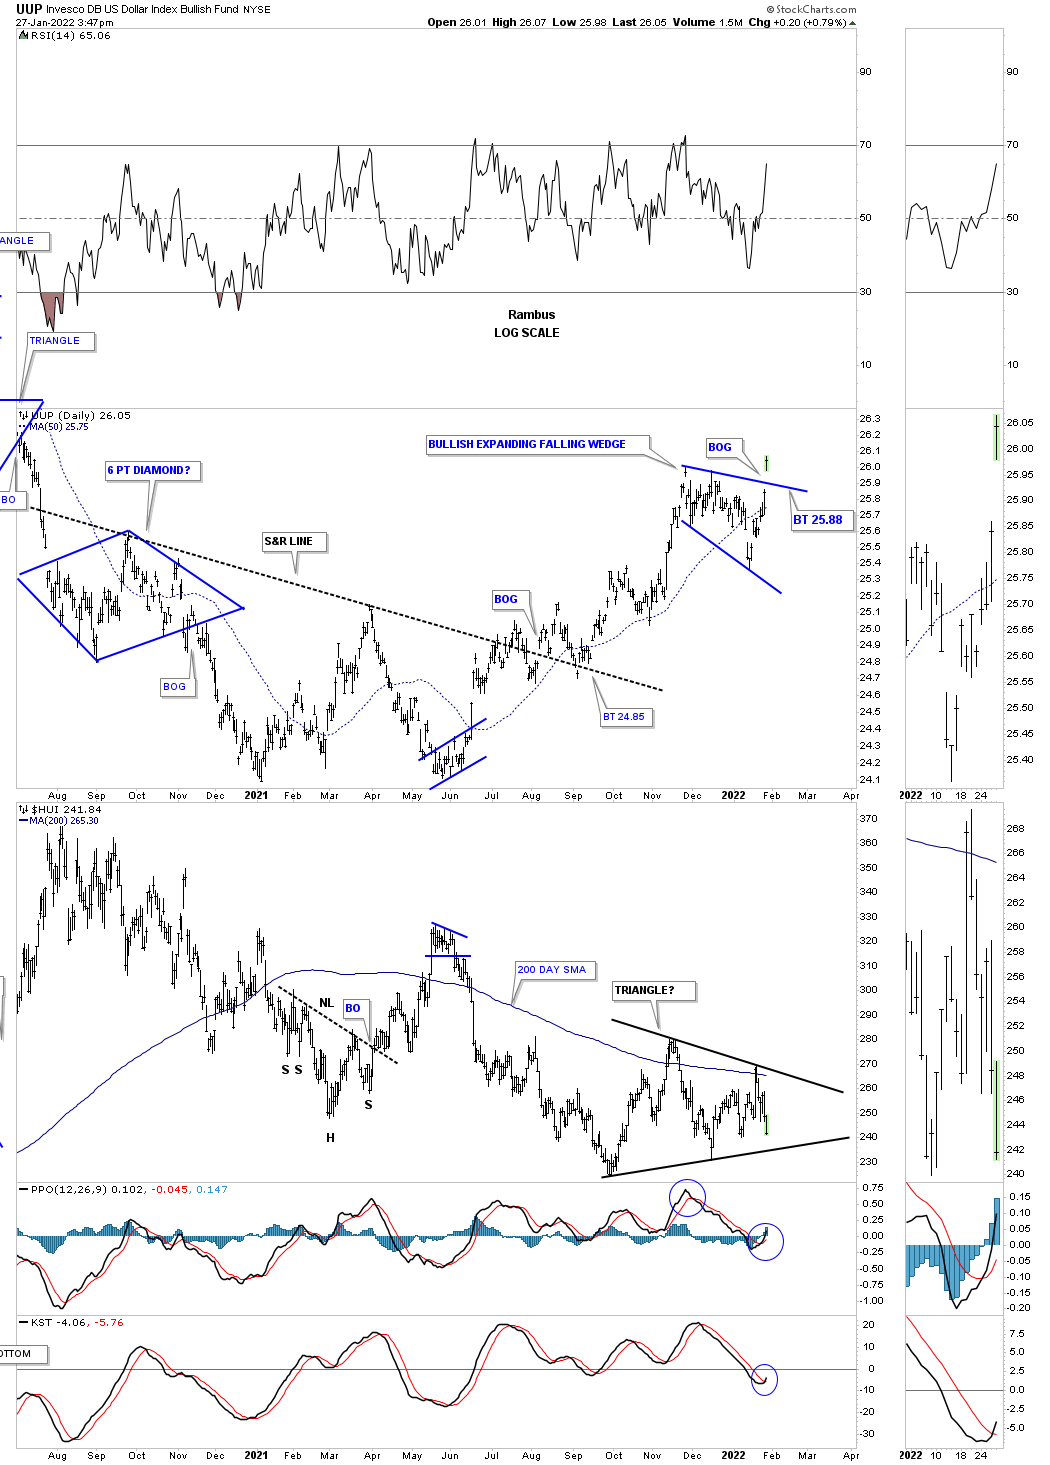
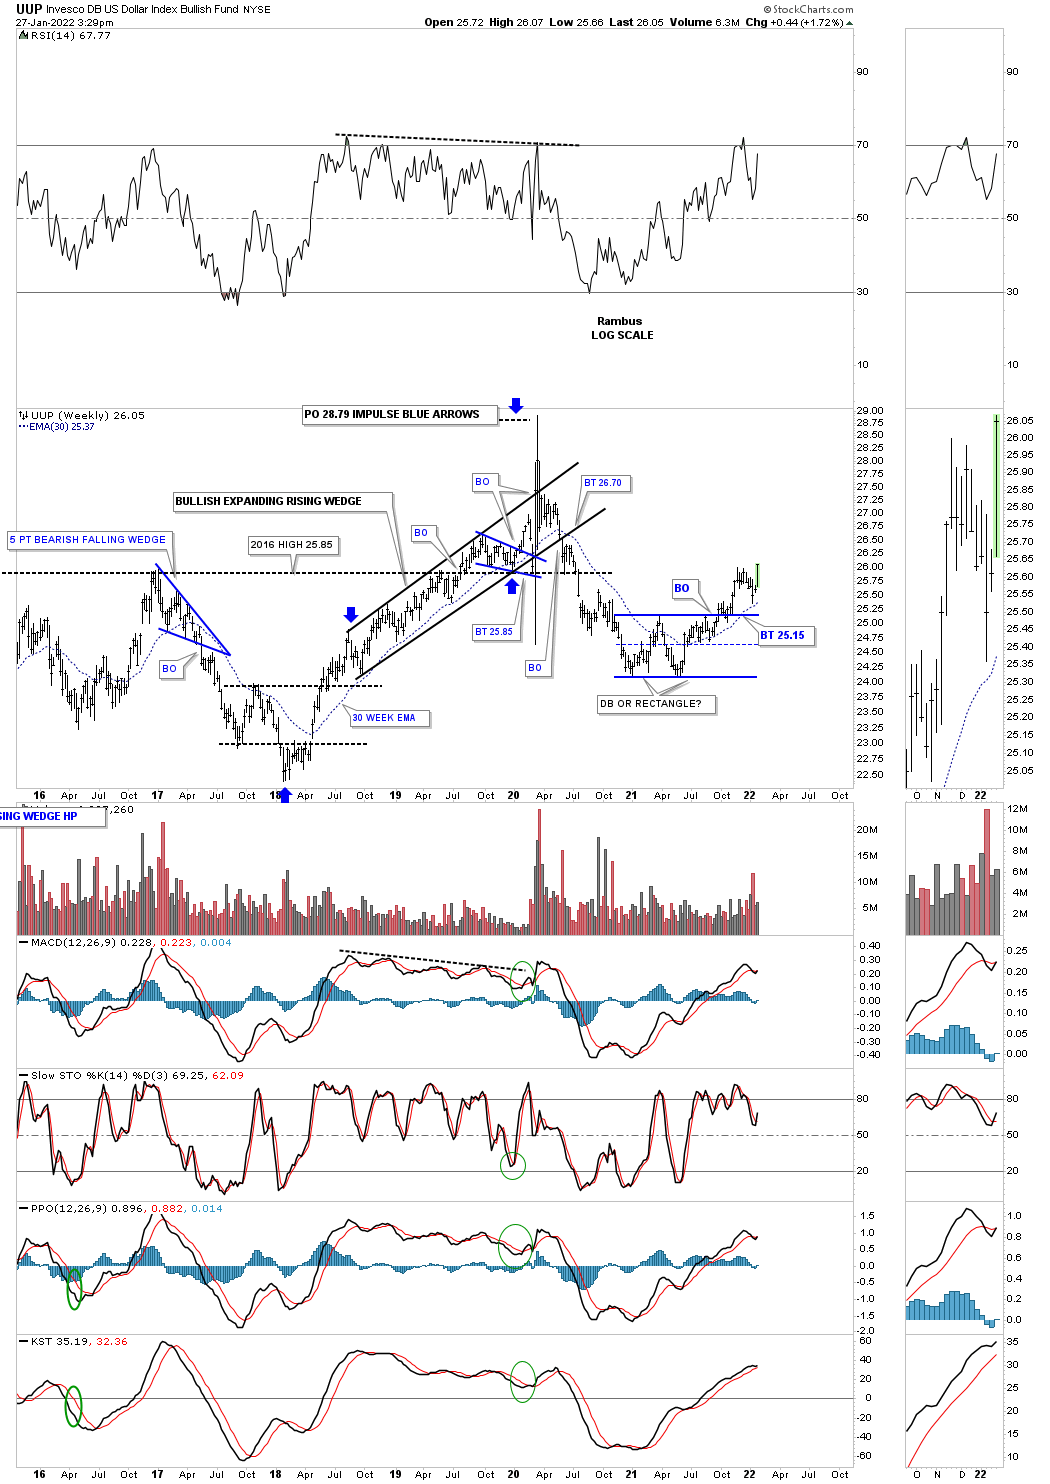
If you recall we were watching this combo chart in the fall of last year which has the UUP on top with the HUI below. At the time I said the breakout above the double bottom trendline was very sloppy, which it was, but the backtest finally held support. As you can see the UUP had a massive breakout gap today out of the bullish expanding falling wedge. At the bottom of the chart you can see the HUI which is forming that possible triangle which could be a halfway pattern to the downside especially if the US dollar remains strong.
At the time I was looking for either a double bottom or rectangle. Just before the breakout of the top rail the price action found support at the center dashed midline of what turned out to the the double bottom.
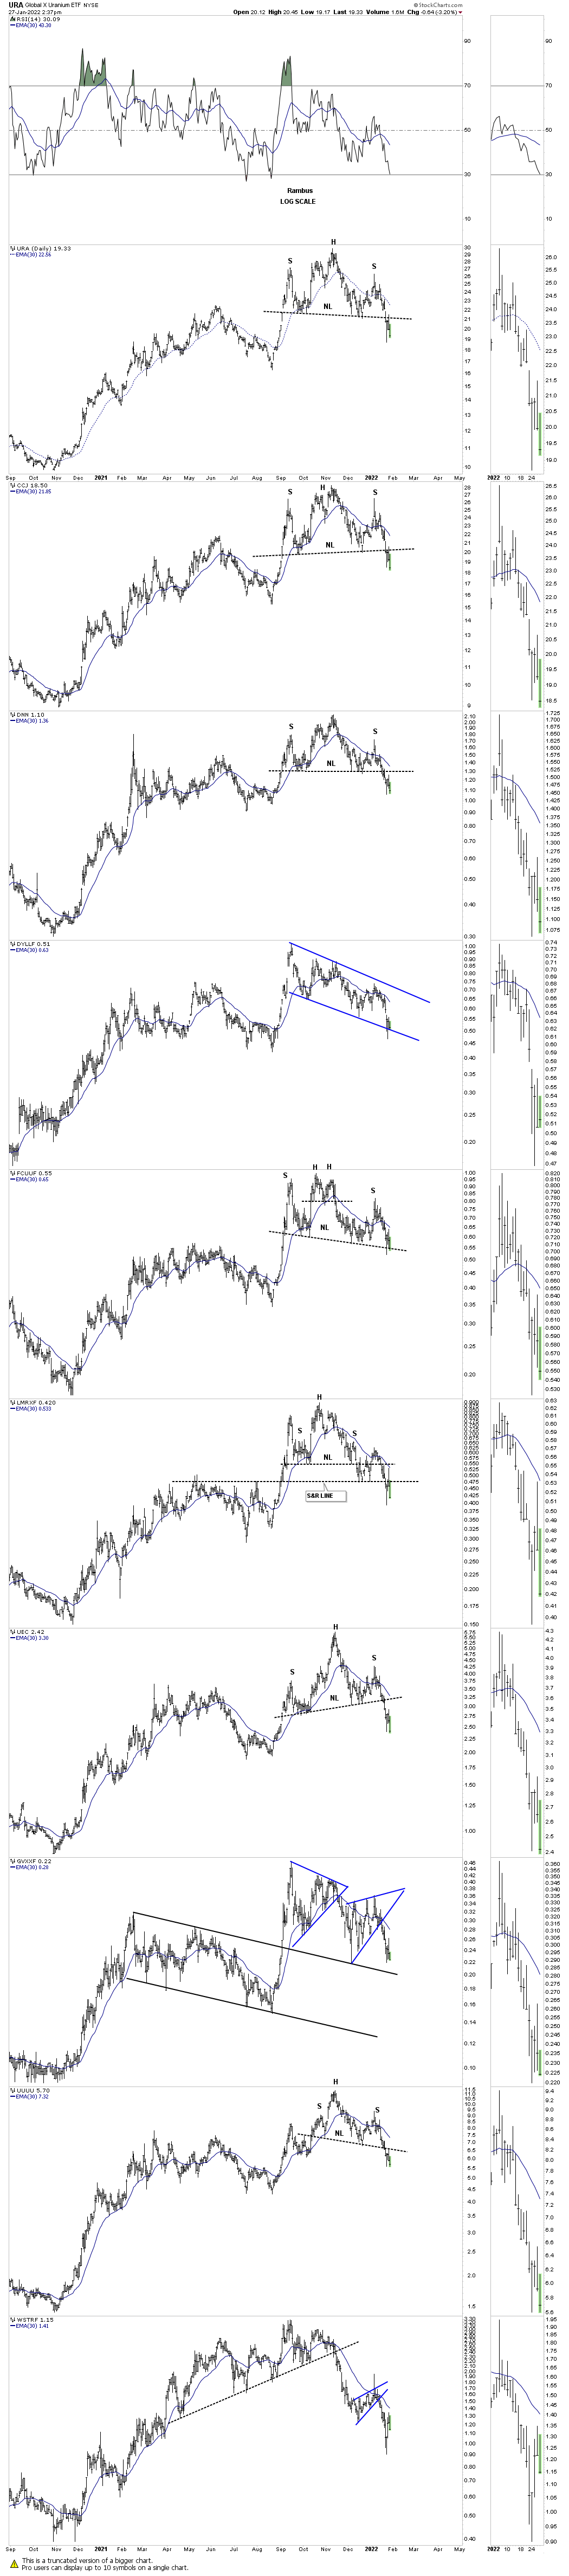
Another piece of the puzzle could very well be showing up in Uranium. I know it was a hot topic for quite a long time. This week we are beginning to see the 6 month H&S top necklines giving way with most completing a backtest.
I will finish up by looking at the stock market combo chart. I added a thin dashed horizontal line at the recent low to see if any of these indexes form a possible double bottom. This could also be an area to look for a small consolidation pattern to form which would lead to lower prices.
I mentioned yesterday that there were 2 types of oversold readings I follow. The oversold readings I’m seeing right now are similar to what we’ve seen since the rally out of the 2020 crash low. What I haven’t see yet, which is very possible, is the extremely oversold readings that don’t happen very often but when they do the selloff can be very brutal if one isn’t pay attention.
All in all there is a lot going on right now where just about everything seems to be at a critical inflection point. If I said this once then I’ve said it a million times, “the only rule when it comes to the stock markets is that there are no rules.” All the best…Rambus
