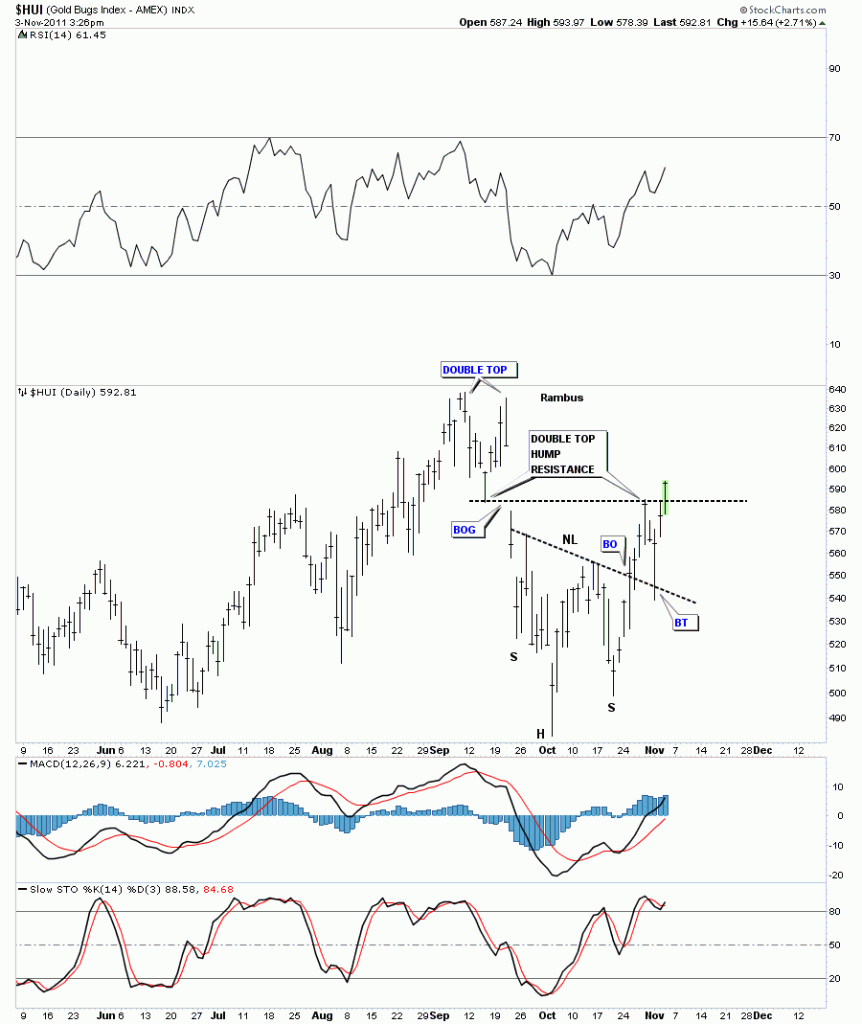
Below is a 6 month daily chart for the HUI showing our H&S bottom and how it has interacted with it’s own support and resistance points since the double top made in September of this year. Please note where the initial thrust was stopped on the breakout from the H&S neckline. The double top hump provided just enough resistance to stop the move and reverse the trend down. Now look where the move down stopped. Right on the old neckline that held resistance while the H&S bottom pattern was forming. Once the HUI was able to break the neckline to the upside the neckline has reversed its roll and now act as support. These types of support and resistance areas are nothing more than investor psychology. Meaning all the folks that bought below the neckline are still ahead of the game when the neckline is backtested from the topside. So there is not much selling just above the neckline. The buyers step in and away you go again until the next resistance zone is hit. As long as the bulls are in charge the corrections will be modest.
HUI 6 month daily H&S bottom with support and resistance points.

