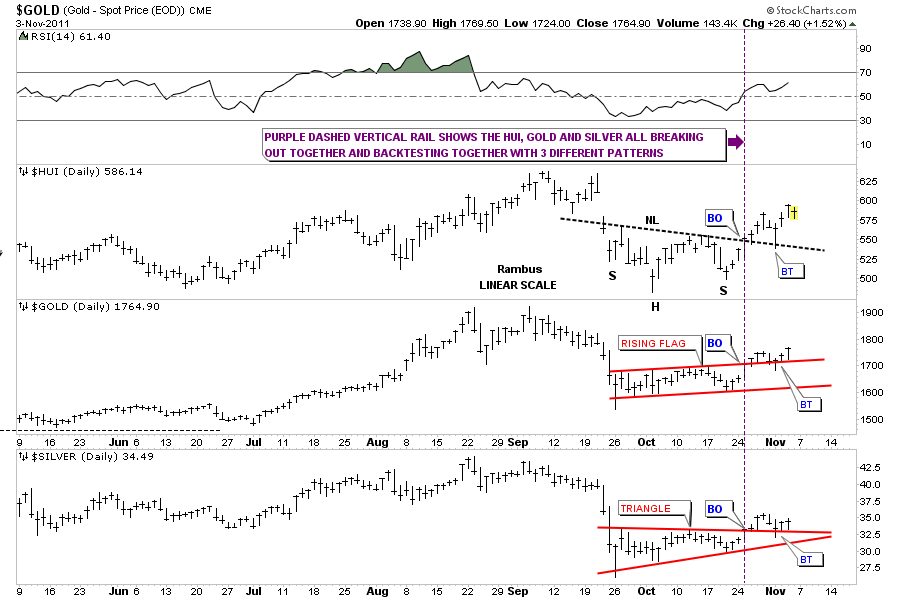
Below is a combo chart showing the HUI, Gold and Silver. This chart helps one to see how all three are preforming against each other. What I want to focus on is our most recent bottom and the 3 completely different reversal patterns that formed. The top of the chart is the HUI and it’s H&S bottom. Next is gold and it’s 5 point bullish rising flag and third is silver with it’s 5 point triangle reversal pattern. Even tho each has a different bottoming pattern they have all broken out and backtested together. The purple dashed vertical rail shows the breakout of the 3 reversal patterns. On Tuesday they all backtested their resistance rails, HUI the neckline, Gold’s top rail of it’s 5 point bullish rising flag and Silver the top rail of the 5 point triangle. What I’ll be looking for, from this comb chart, is who will be the first to breakout into new all time highs. Hopefully the HUI will lead the charge higher but its really to early to tell yet.
Rambus Chartology
Moving forward

