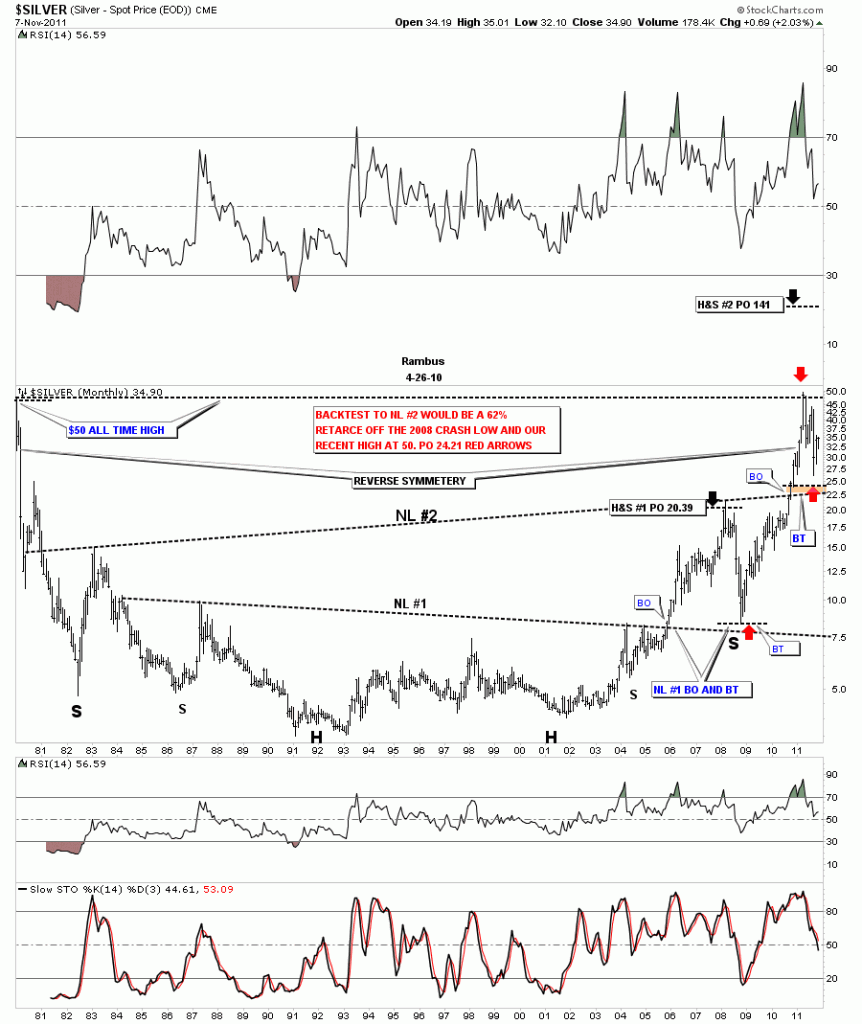
In the weekend report I showed a 30 year long term look at gold so you could see the big base that launched it’s bull market. Silver’s huge base is just as impressive as golds. On the chart below the first thing you will notice is the two H&S patterns that formed the almost 30 year base. I’ve labeled the two H&S patterns as Neckline #1 and neckline #2. The lower or smaller H&S base reached it’s price objective of 20.39 just before everything crashed in 2008. During the crash silver found support just above it’s neckline which qualified as the backtest. That crash low in 2008 also created the right shoulder of the much bigger H&S base, NL #2. The rally sliced right thru the NL #2 like butter until it hit 50. Again, like the smaller H&S #1, the price corrected all the way down to just above NL #2, close to the 62% retrace, red arrows on chart below. That also qualified as the backtest IMHO. The brown area on the chart shows where I was looking for the backtest to stop and just like the lower H&S neckline #1 the backtest stopped just short of a full test all the way down to the neckline. Close enough for government work. The big #2 H&S base has a price objective all the way up to 141.
Silver 30 year base with two H&S patterns

