
“The primary movement is the broad basic trend generally known as a bull or bear market extending over periods from less than a year to several years. The correct determination of the direction of this movement is the most important factor in successful speculation.”
–WILLIAM P. HAMILTON MARCH 1924
I truly hope the above quote doesn’t just slip by you without permanently imbedding itself in your investment psyche. It is the fundamental core of Dow Theory, that is knowing whether the great tide is coming in or going out. I continue to be in awe of the stock market theorists of the early 20th century. Frankly, I rarely see anyone today who can measure up to the ability these men had to understand the message of the market as they did. Their willingness to discern the market’s language and what it is trying to tell us is lacking in the analysts of today. Stan Drukenmiller has this gift, but he’s not talking as he holds his cards close to his vest.
Today, I would like to quickly highlight what I believe Dow Theory is revealing to us as to the state of the general stock market and then move on and apply these principles to the precious metals sector. Dow Theory principles can guide us in knowing what is the primary trend and what phase we are in the PM bull market.
The Stock Market- Bear Market Phase I
First off, these are my opinions only, based off of my interpretation of Dow Theory. I am a guest writer and it is not my intention to be in conflict with any trading positions this site has taken. I have been granted complete intellectual freedom so I will just call it as I see it.
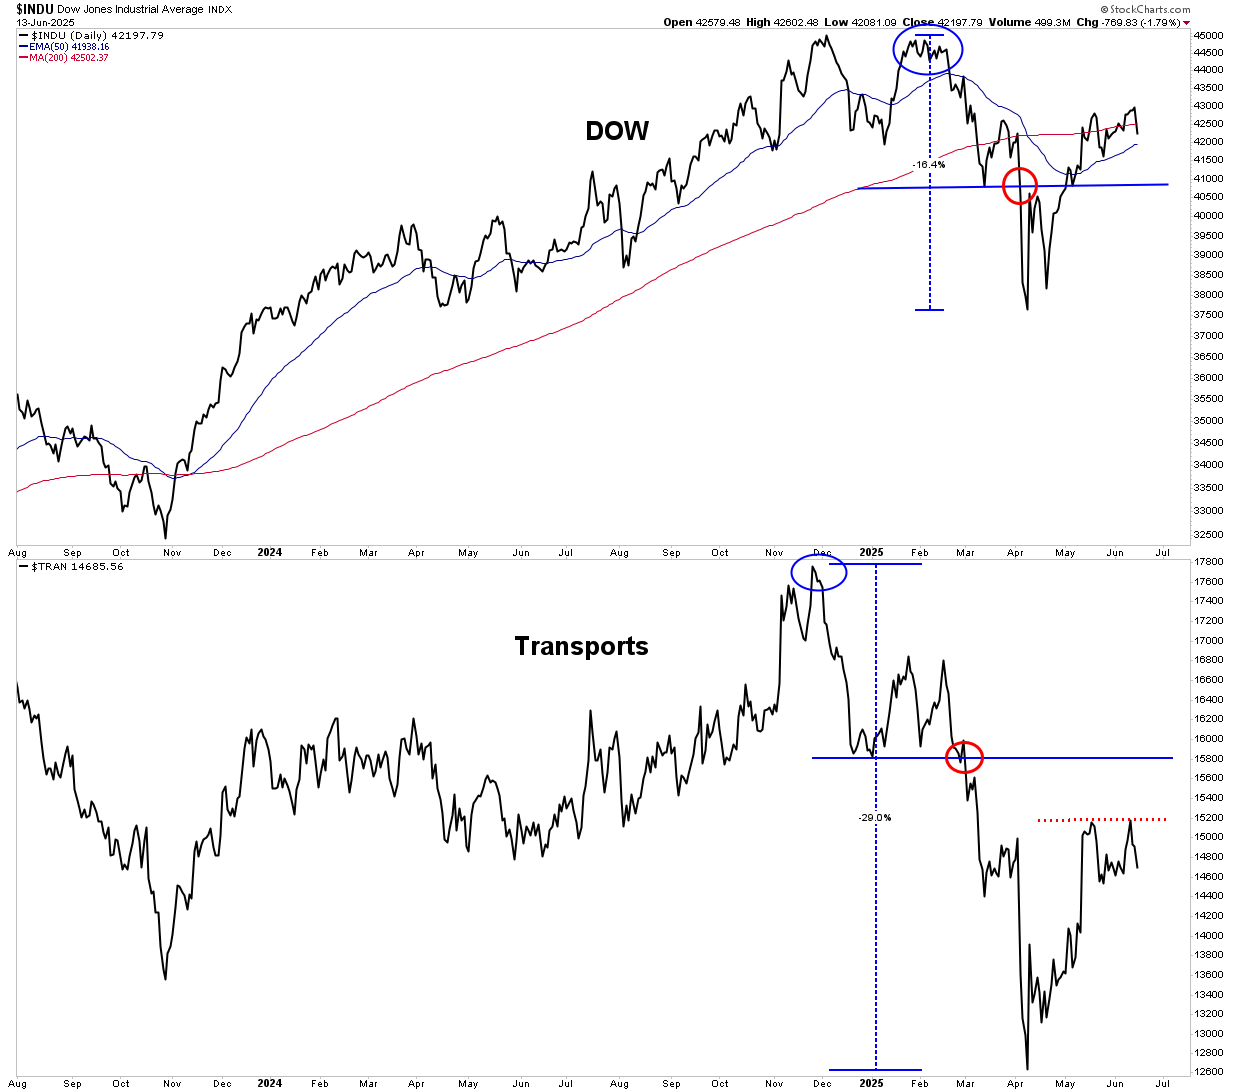
In the below two charts we see the DJIA and the Transports. It shows a very clear unambiguous Dow Theory Sell signal given on April 3 2025. This is when the Dow confirmed the Transports earlier violation of its reaction low. This occurred when both the Dow & Transports declined from their ATHs, found a bottom then rallied, only to roll over and violate those previous lows triggering a Dow Theory sell signal. This signaled a change in the primary trend. The red circles mark these points.
It is important to note that Dow Theory sell signals are only valid when they occur in Phase III. This signal was valid as the stock market has been in Phase III throughout 2024 up to the top shown on the chart. In order for this primary trend signal to be negated both the Dow and the Transports must rally above the red circle trigger points on a closing basis. We can see the Dow has in fact done this, however the Transports have not therefore the bearish signal remains in effect. One last significant point: Hamilton stated that once a bearish primary trend change occurs the bear market will not end until it transits all three phases of a bear market. This is an earth shattering principle because this bear market is still only in early phase I.
Bear Market Rallies (BMRs)
So let’s take a look at what has been going on since April 7th when the stock market bottomed after the “Freedom Day” collapse. We have experienced a 65 day 25% rally in the S&P 500. That’s right, a quarter of the entire value of the S&P in 65 calendar days. It has been enough to reignite the “buy the dip” conditioning of the average investor and to make him bullish as ever. Sure you may hear some occasional reluctance, but the tape doesn’t show it. Every dip Is bought hard then shorts are squeezed to oblivion. Few even consider this is a “bear market rally” rather it’s believed we’re headed to all time highs, buckle up!
But here is something I find kinda spooky: Here is a quote from William P Hamilton who was Dow’s understudy and wrote the Heard on the Street column for the Wall Street Journal for 25 years. “In bear markets, secondary movements (BMRs) averaged 66 days” Take a look at the below chart, Wednesday June 11th, the top so far was day 65. Tomorrow Monday June 16th will be day 70.
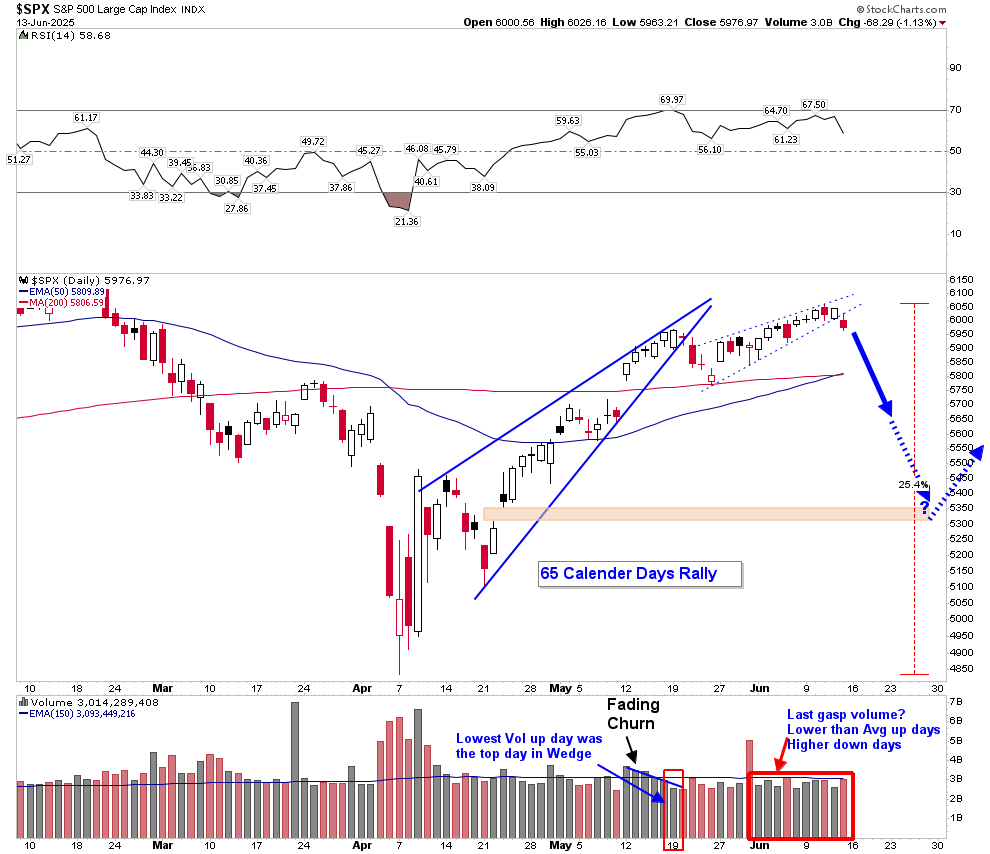
Now there is a lot one can read into this chart and please allow me some artistic license. I have chosen to diagram a classic bearish rising wedge with tight parameters (solid blue). As one would expect volume trails off as it makes itself up its narrowing pathway until it finally struggles to advance any further while volume puts on a final burst. This is called a churning top. It’s a form of exhaustion. We then see a breakdown out of the wedge with 4 down days finding support at the 200 EMA. Price now forms yet another bearish rising wedge lasting 3 weeks or 14 trading days. Volume again is somewhat anemic with higher volume on down days, but all days below average. I interpret this second wedge action as “buy the dip” backtesting of the original wedge. It is driven by conditioned investor sentiment. When one watches the daily 5 min chart this entire second wedge period was characterized by dip buyers and ensuing short squeezing. Friday for the first time we witnessed dip buyers get their comeuppance. The dip was bought, as always, but they got stuffed. If the market trends lower on Monday we could witness a certain level of exhaustion among the dip buyers.
General Market Conclusion
My read IAW Dow Theory is the stock market remains in Phase I of a bear market. We have just witnessed a powerful BMR, however initial signs are evident that it may now be over. It is yet to be determined if there remains enough loose money sloshing around combined with animal spirits to drive the indexes above the February highs. Just keep in mind the old Wall Street adage of “sell in May and go away”.
Remember that in Phase I of a bear market there is an abandonment of the hopes upon which stocks were purchased at inflated prices. Here we are 4 months after the market peaked, but people have not yet abandoned their hopes upon which they originally bought at inflated prices. It is my view that if prices were to fall lower than the April 7th lows these hopes would be abandoned and the bear would advance into Phase II. Perhaps we will see this in the autumn selling season or even not until next year.
The Great News- There is a bull market out there
I know, that last section was a bit of a buzz kill, but it’s based on just the facts Ma’am! The good news however, is that the precious metals are now solidly entering into Phase II of a bull market. I will show that this cyclical bull market will likely run for another 2-3 more years. If you play your cards right you will be able to put yourself into a different economic class. You’ll be able to move on up to the East side!
The markets are in the early stages of a Capital Rotation Event (CRE) that’s happening right now. Assets are in the early stages of rotating out of financial assets and into physical assets. These cycles typically last 20 years or so. The CRE is what is driving this bull market, but it won’t run steady for 20 years, instead it will likely have 2 or 3 cyclical runs within the 15-20 year period. This is likely the grand finale of the post 1971 fiat cycle unraveling.
From what I have seen so far this is going to be a bull market for the ages. It’s going to blow your socks off. Gold and silver stocks have been so orphaned and abandoned they are like massive compressed springs. ESG investment rules have directed all institutional money flows away from this sector. Everything is now changed. The US Govt now wants capital directed towards mining and resource extraction and permits have been streamlined. Every day now there is a news item demonstrating this change. Was it on your bingo card this week that a crypto company with $10b FCF would buy half of Elemental Gold Royalties?
Big Money Now Moving In
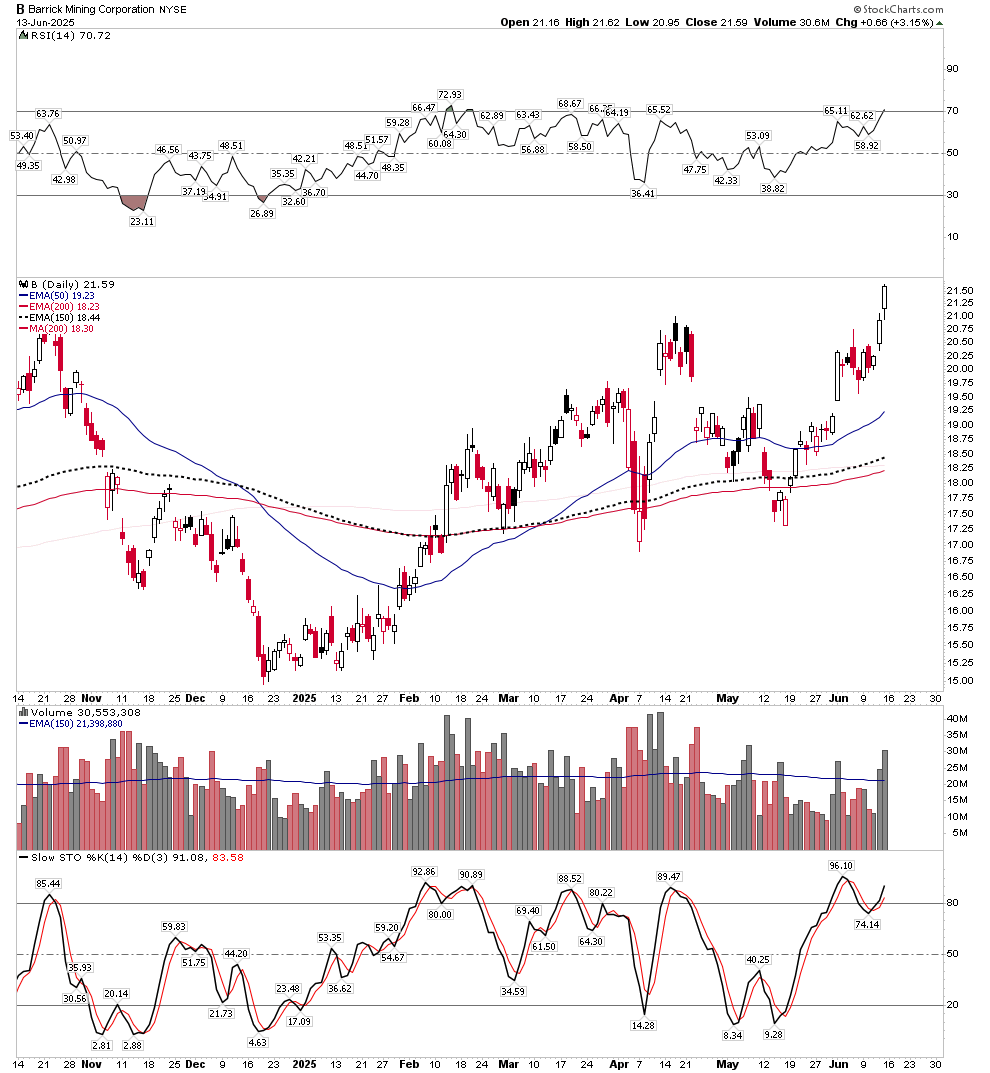
Take a look at the big cap mining stocks that have been pariahs for years. They just recently began attracting institutional money flows. Over the past few days they have exhibited urgency gaps with big volume. Urgency gaps are the result of just that… urgency. No longer willing to wait around for the pull back that used to come, big money just woke up and are now chasing.
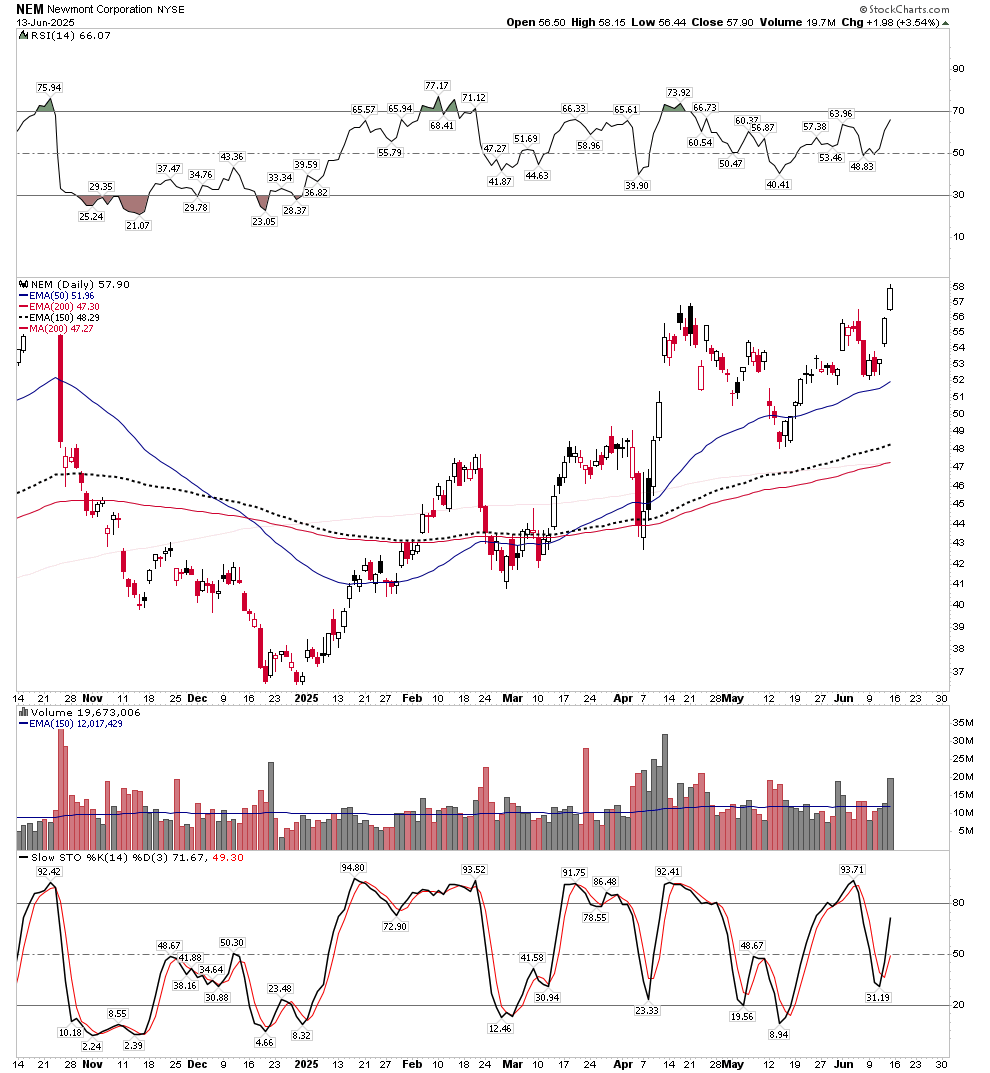
It was just about one month ago I looked through about 50 hedge funds first quarter list of stocks they bought. Literally only one fund bought some gold stocks and they were all big name companies NEM,AEM,B,AU etc. This single fund that bought gold stocks stayed with the familiar names because they know nothing about this sector.
How will this bull market unfold?
This current bull market in the gold stocks began the last week of September 2022. I have heard many say it started in late 2023. They are simply wrong and it’s important to know why. Back in 2022 I posted this chart below indicating distress selling that signaled the end of the bear market in the gold stocks. How could I say this? Because I had never seen this level of distress capitulation selling in the gold stocks. We see it here:
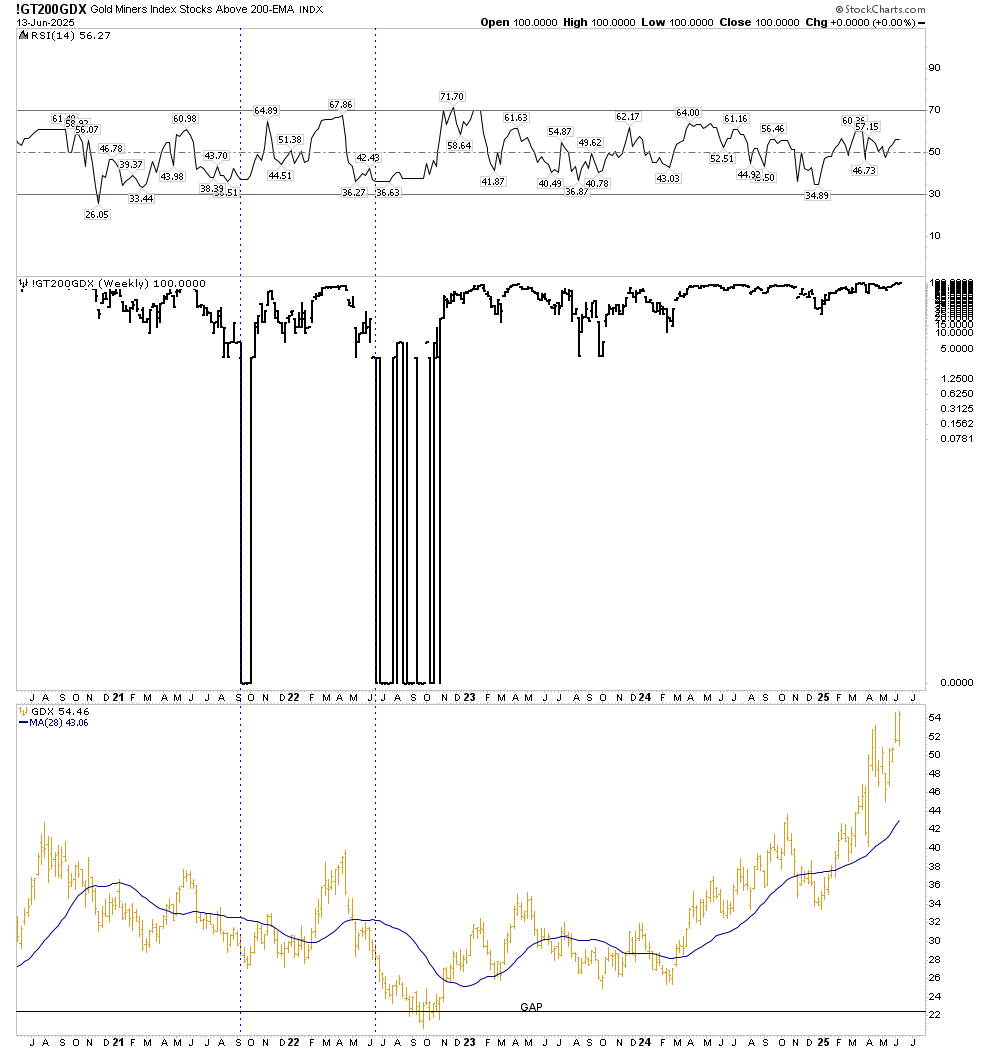
What we are seeing here is the percent of gold stocks below the 200 SMA. For 5 months running 100% of gold stocks were below their 200SMA. This was relentless and unprecedented. We saw it for a month in 2021, but in 2022 the rain beat down on gold stock holders unceasingly for 5 straight months. They couldn’t take it any more, it became a full flush out capitulation. I remember my Sprott broker telling me he would get 5 clients a week blow out and close their account, You might remember those times, it got pretty old. So when you hear people say the bull started in 2023, no that was just the one year later retest of the 2022 bottom. What we saw there in the fall of 2022 was a classic bear market Phase III bottom. Large scale distress selling of sound securities, regardless of their value.
Gold Stock Bull Market Phase I/II/III
Bull markets in Phase I exhibit a slow revival of confidence in the future of business conditions. Stocks over time return to known values. It is my interpretation that Phase I went from September 2022 until January 2025. That’s a long time, almost 2.5 years to get out of Phase I. This long interval however, gives us a clue as to the eventual length of this bull market. Hamilton and Robert Rhea emphasized that Phase II is the longest phase. During Phase II stocks rise over the improvement to corporate earnings. So according to the classic Dow Theorists, Phase II should run at least 2 years, let’s say to winter 2027 as a minimum.
One caution about Phase II. It is the most confusing of the three phases. In Phase II we will witness violent corrections where you will think the bull is over. The sector could lose 20-40% over a 2-4 month period. This is why the use of margin in the PM sector results in investors not making any money despite operating in a bull market. Ultimately it works against you due to volatility.
Phase III is when the general public and unwashed storm the sector and prices climb relentlessly higher. It will be driven by outright fear and FOMO. It could last a few months to a bit over a year. We just witnessed a mania Phase III in MAG7 stocks which lasted about 12 months. As a seasoned investor it’s one of the harder things to do, but one should disengage from the mania and sell into strength all the way up.
Markers to look for within Phase II
Let me emphasize first that 80% of PM investors would be better off to just buy a managed fund or ETF, stay off margin and hold their position until unmistakable signs of Phase III become evident. At that moment sell it all and go to cash. Don’t trade, enjoy your life, avoid stress. Over the next 3 years or so you will probably get a 300-400% return on your portfolio.
For the other 20% who are willing to do the work and competently manage their portfolio much higher returns will be achievable in my view. One method to do this would be to follow the crack of the whip. To achieve maximum torque in your portfolio occasionally position yourself into the sector of the market that is going to receive money flows as the bull market progresses. One must understand how money will shift to different asset classes each step of the way and arrive there before the crowd gets there. Let me explain.
The flow of money follows a predictable path. First the metal itself will attract money and drive the price higher, we have already seen this. This results in the major producers increasing their free cash flow (FCF). As the general stock market begins to decline or at least no longer rises, institutional money will notice and begin to buy familiar names that have large market caps because they are generating increasing FCF. That is right where we are at this moment in its early stage. Note we have already seen over the past 2 years the metal price rise, now it’s time for the big caps to perform.
Next, will be money flowing into the mid-cap producers. This is because the majors will need to replace their reserves and they will be flush with cash from higher FCF. They will do this through mergers and acquisitions because it simply takes too long to find your own reserves and develop them. The mid-cap producers and near to production developers will move up as a group.
This is the time, I believe, that the general retail investor will begin entering the sector which brings in fresh money to drive it higher. Another way to identify this point is this would correspond to the illusive Point of Recognition (POR). PORs come around the mid point of Phase II. I clearly recall the POR in the 2002-2011 bull market. It distinctly came in October 2007 five years into the bull market as gold rose through $700. There was a phase shift in investor psychology as the masses come to accept that it’s not just a flash in the pan, but it’s actually a trend that is going to continue. Since many now think that $3,300 gold is a peak and won’t hold over time, when gold rises above $4,000 it could ignite a POR.
When the general public enters the PM sector another significant event occurs. This is the time that silver shifts into high gear. Supposably this is because silver is more affordable than gold so retail investors want the cheaper asset. Silver stocks will already be trending higher due to informed investors positioning themselves for the anticipated move, but once retail enters the stocks will launch higher.
Throughout Phase II secondary reactions or “corrections” can always strike. They arrive when investor sentiment gets highly elevated. It is the markets way to tamp down enthusiasm. You should determine ahead of time if you are going to ride it through or try to mitigate your draw down, because they will come and they can be painful. Plan accordingly and stay off margin.
Phase III Entry
Some point after the POR, perhaps 6 months or so the sector will go into a sharp prolonged decline. This will be the correction prior to Phase III. There is no way to know precisely how long it could take, however once over and the excesses have been purged the final raucous price action will begin. The classic PM Phase III was the period of 1979-80. In that episode a handful of explorers went from 40 cents to $200+. I can’t tell you if we will witness this level of mania in this bull market, but I would say silver stocks are a candidate for this type of action. But perhaps it might have to wait for the next bull market in the early 2030’s.
Gold Stock Bull Market 1970-1976
Gold in the US was illegal to hold until 1975 so the gold stocks were not a developed asset class in the US for the first half of the decade. To track that bull market we can use the Barrons Gold Mining Index, but the real action was on the Johannesburg exchange. I have read stories of how investors would call their US broker and ask to trade these stocks. They were told promptly that they were crazy fools and should instead buy IBM. The 10 year 1970’s bull market was divided into 2 separate cyclical bull markets. Here was the first one from 1970-1974 as traded in Johannesburg.

The price action displays clearly the 3 Phases of this bull market. Phase I was 1970-1971, just over one year. Note the major correction between the phases, around 40%. Phase II was the longest phase lasting about 2 years from late 71-mid 73. It is also pretty easy to spot the POR coming in half way through Phase II at the turn of the year starting in 1973 just over the 200 level. Total returns for Phase II were about 5X. As expected a major correction occurred between Phase II & III of about 30% which lasted 4 months. Then came the raucous Phase III which lasted just under 6 months and was up almost 300%.
But then came the destructive 2-year bear market which also underwent 3 phases to the downside. You can see how critical it is NOT to ride through a bear market, they will destroy you. I think this analog is a reasonable template to model the bull market that we are presently in. This information is a good start to help you manage what lies in front of us.
Financial Leverage vs Operational Leverage
As more PM stocks become listed on US Exchanges investors will be tempted to magnify their returns by using financial leverage, that is the use of margin loans or options. I highly discourage this because the end result for the retail investor will be to likely lose money in a bull market. As stated violent pullbacks come when least expected and being on margin magnifies the loss. The investor finally sells out and is slow to reenter since he is so traumatized from his loss. Final result is he actually loses money despite the uptrend.
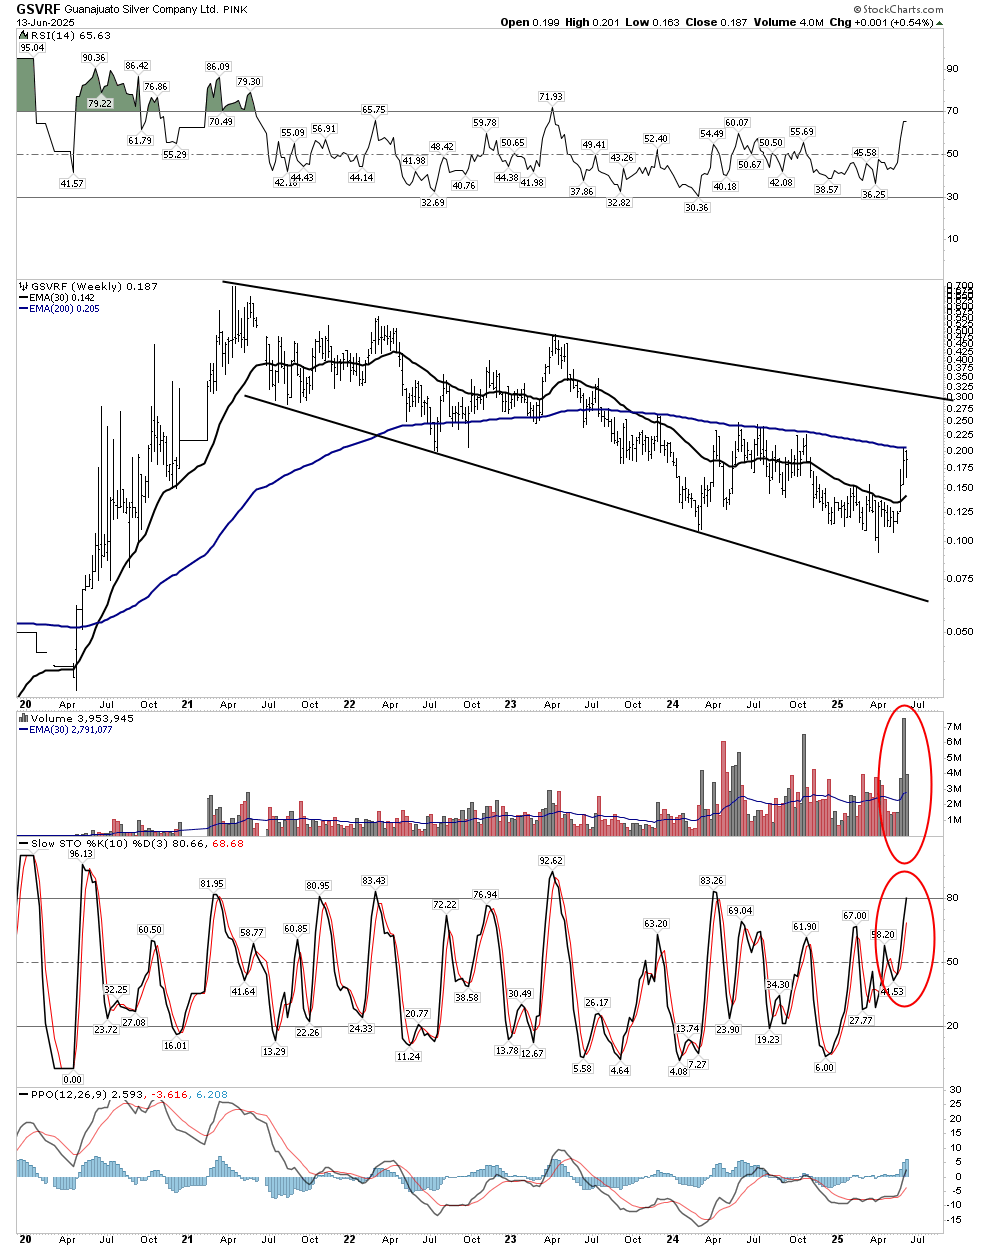
The mining stocks themselves provide more than enough leverage in themselves, but in the form of operational leverage. This is especially the case with the silver stocks. This is not a recommendation, but let’s use Guanajuato Silver as an example. This is a producer made up of several consolidated bankrupt assets. It is considered risky because they have several small operating mines and a relatively high AISC of around $24. Many things could go wrong, but let’s just look at their operational leverage.
They will produce 4m Oz of AgEq in 2025. Within a year they hope to be producing 5m Oz AgEq. They presently have a market cap of $88m USD. Using conservative estimates of a profit of $5/Oz they could make a FCF of $20m/year. In 2 years from now if silver trades for $60 and costs stay the same (costs have been trending down) and they could produce 5m OzEq that would equate to a FCF of $175m USD. At $100 FCF becomes $350m. That is some serious FCF for such a small company. If we assigned a very conservative PE of 8 to the stock because it is so “risky” that should translate to the following stock prices: $30Ag=35 cents, $60Ag=$2.9 USD, $100Ag=$5.88 USD. This is based on the 472m Shares on issue and 5m Oz production. (Note the S&P500 presently trades at a PE of 31) We will just have to see what the market prices these shares at but these are very conservative reasonable assumptions. This demonstrates how operational leverage delivers plenty of leverage, you don’t need to wreck your portfolio using margin.
Final Thoughts- How High Can We Go?
No doubt you have seen the seemingly ridiculous gold price projections that stretch credulity. I am not even going to offer a guess myself, because it’s pointless. Those crazy numbers will probably come in the second cyclical bull arriving in the 2030’s, however in the meantime anyone hanging around for those big numbers will have gotten crushed in the bear market that comes before the final bull market where these numbers will be achieved. Our job is to focus on the next 2-3 years then get out. But for the next 2-3 years I have no problem envisioning gold over $5,000 and silver up to $100. As I said before that will be enough.
But what I would like you to grasp is what is really going on here. That is, what is being corrected by this bull market in gold? Recall J.P. Morgan blurted out in a congressional hearing: “Gold is money, everything else is credit”. Dan Oliver, who by the way, is a director on G-Silver’s board is the most studied macro guy I know and he explains the big picture in his latest article. What gold is doing as the world’s best reserve asset is providing a counter balance to the US Bond portfolio. As Von Mises said all credit inflations are followed by a credit deflation. Since Greenspan’s 1996 credit infusion we have been in a massive credit expansion. The value of gold will now reflect the level of collapse of credit.
The below chart shows just how much the S&P 500 corrected (deflated) when measured in gold over the last 120 years. I will give you the numbers: 1929 bear-93.6%, 1967-1980 stock bear market- 96.7%. Year 2000 to present TBA, however so far it has been –65%.

The main point is that despite the massive rounds of money printing since 2000 (Y2K) through QE-V, it has failed to raise the S&P in real terms. With this much more credit created relative to the two previous super bubbles expect the S&P to decline over 97% relative to gold before this is corrected. So let’s use this 97% number even though today’s level of debt hints at more. When the S&P finally reaches its bottom and capital reverses its flow away from gold, then gold would be worth 33X the level of the S&P at that time. So pick a number for the S&P when this occurs, 1000/2000/3000/6000… your choice. As a reference if the S&P were to fall to 1,000 at that time then a 97% correction in gold terms would assign a price of gold at $33,000 according to this model. S&P at 10,000 I’ll let you do the math, but I don’t really think we will ever see those numbers based in the USD, we will be calling it something else.
Here is Dan’s article. It makes for good reading: