For those new members who likely arrived after this October 2nd Weekend Report
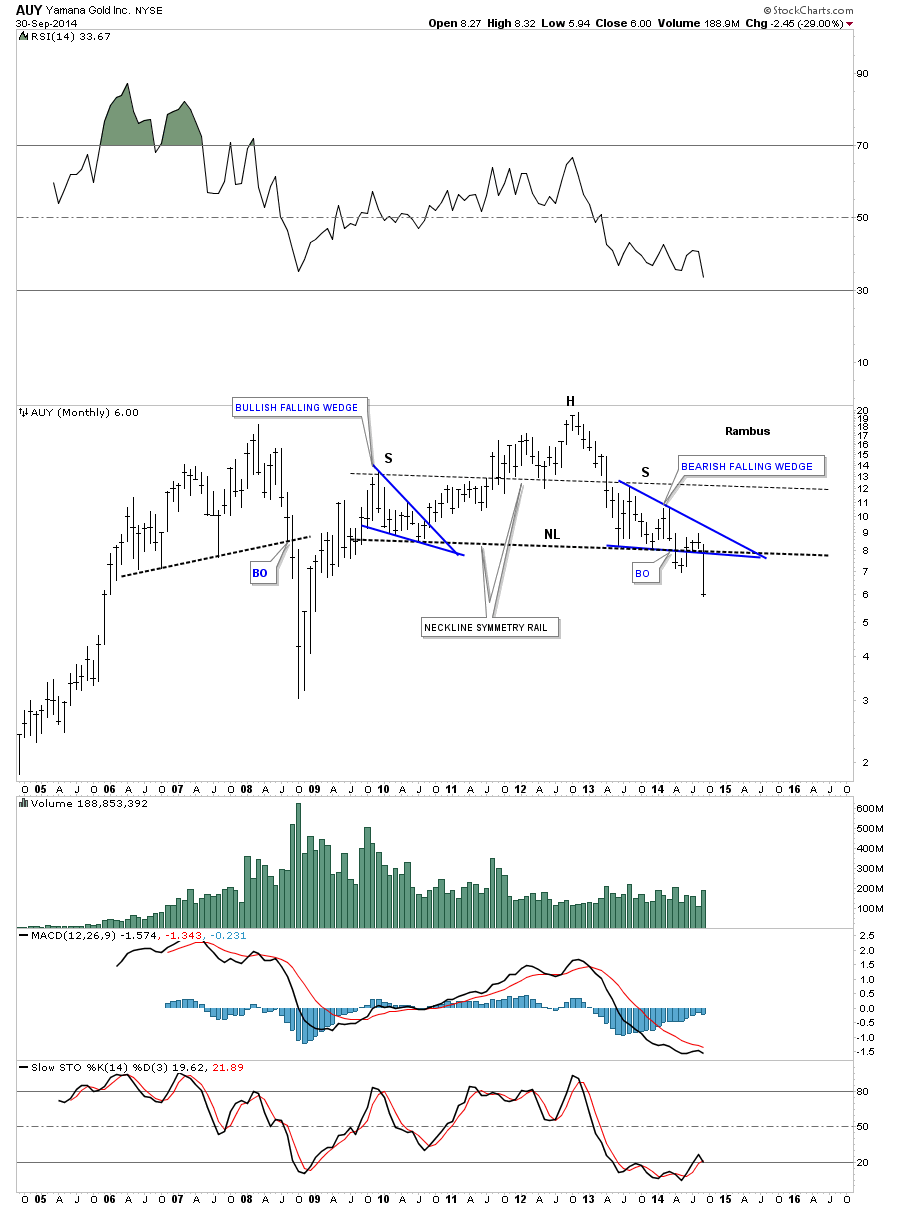
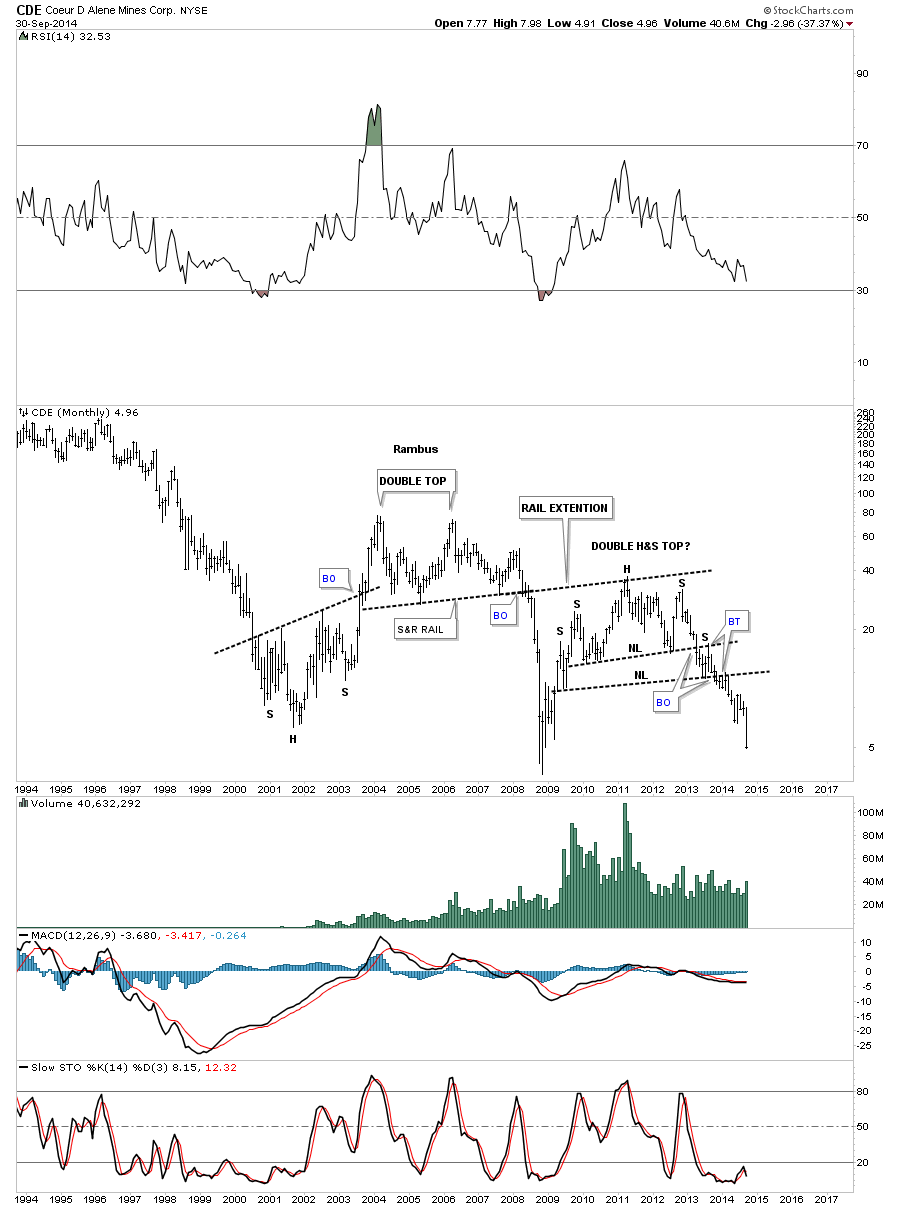
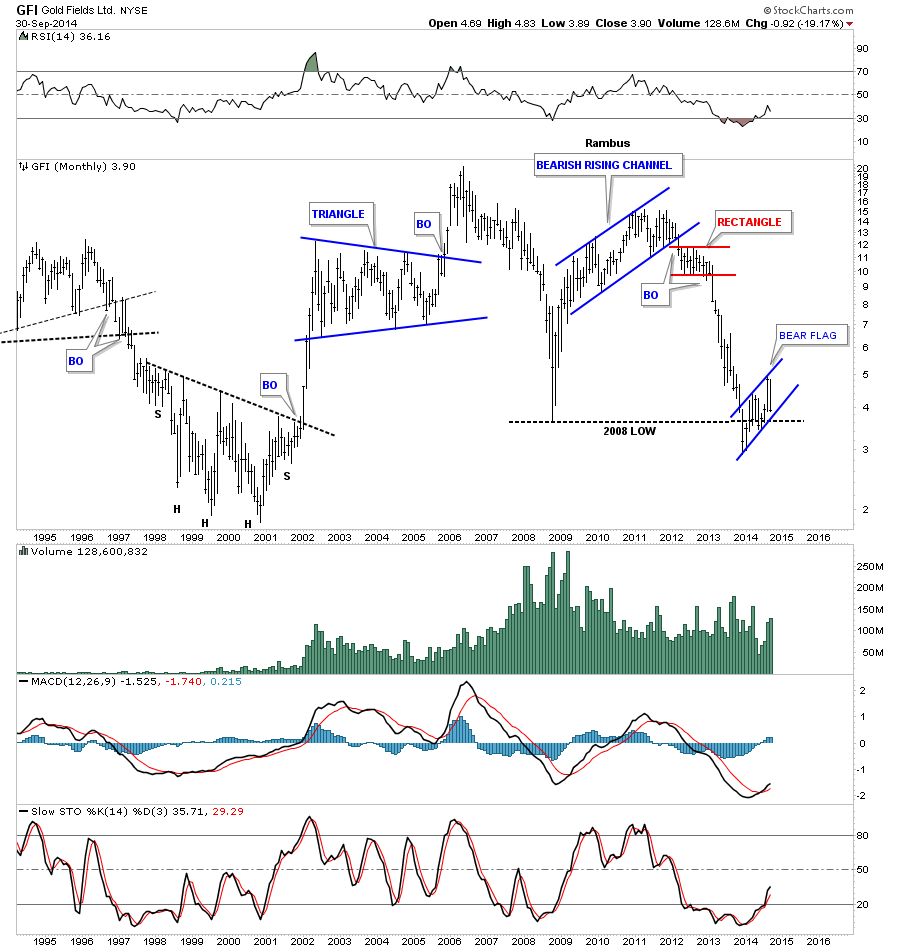
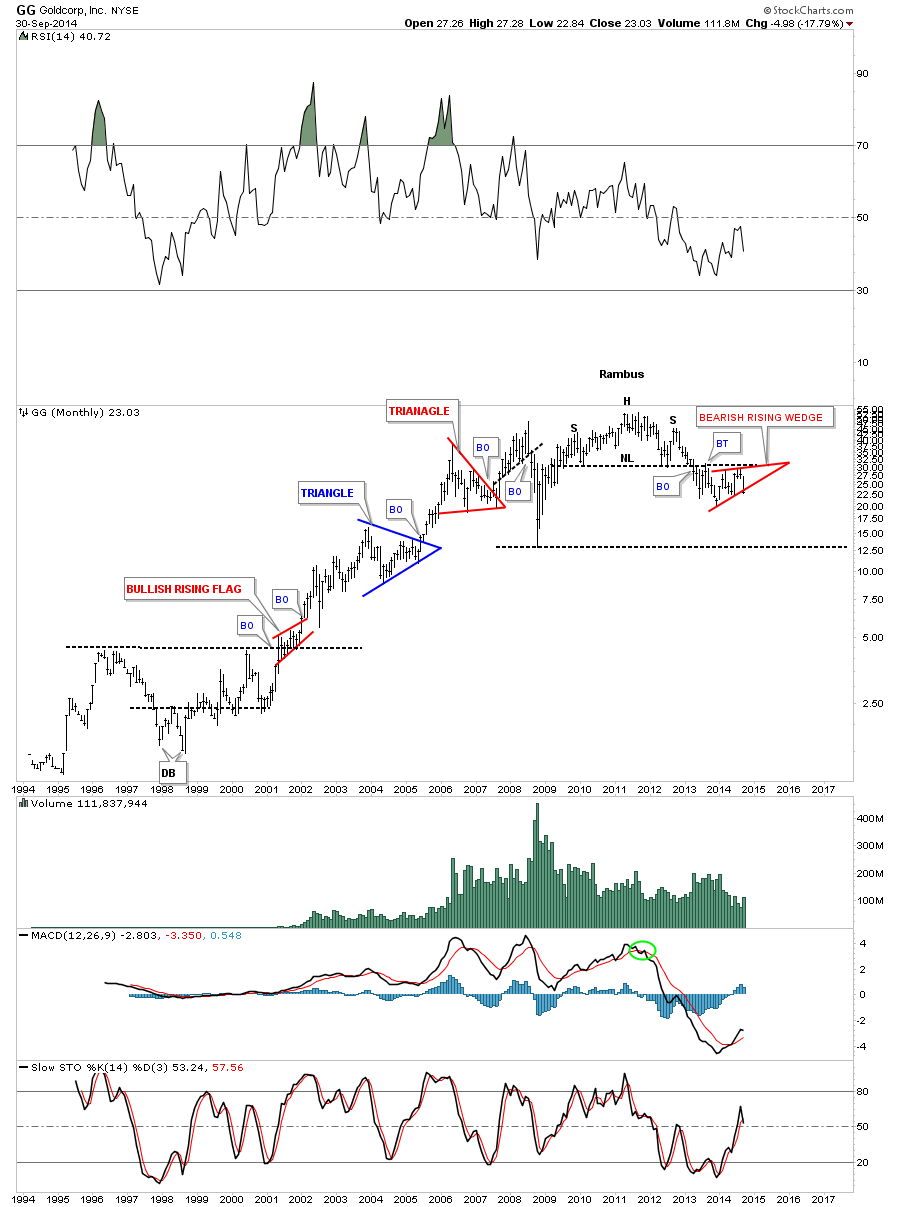
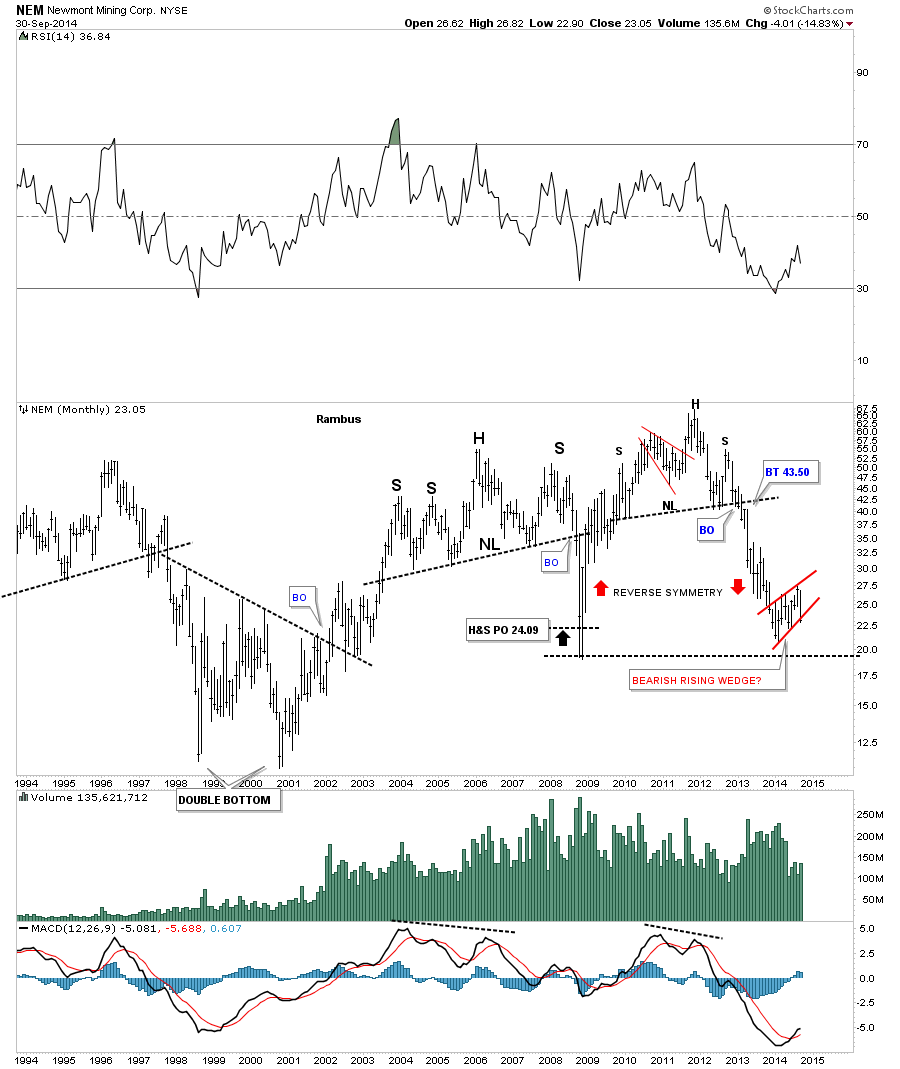
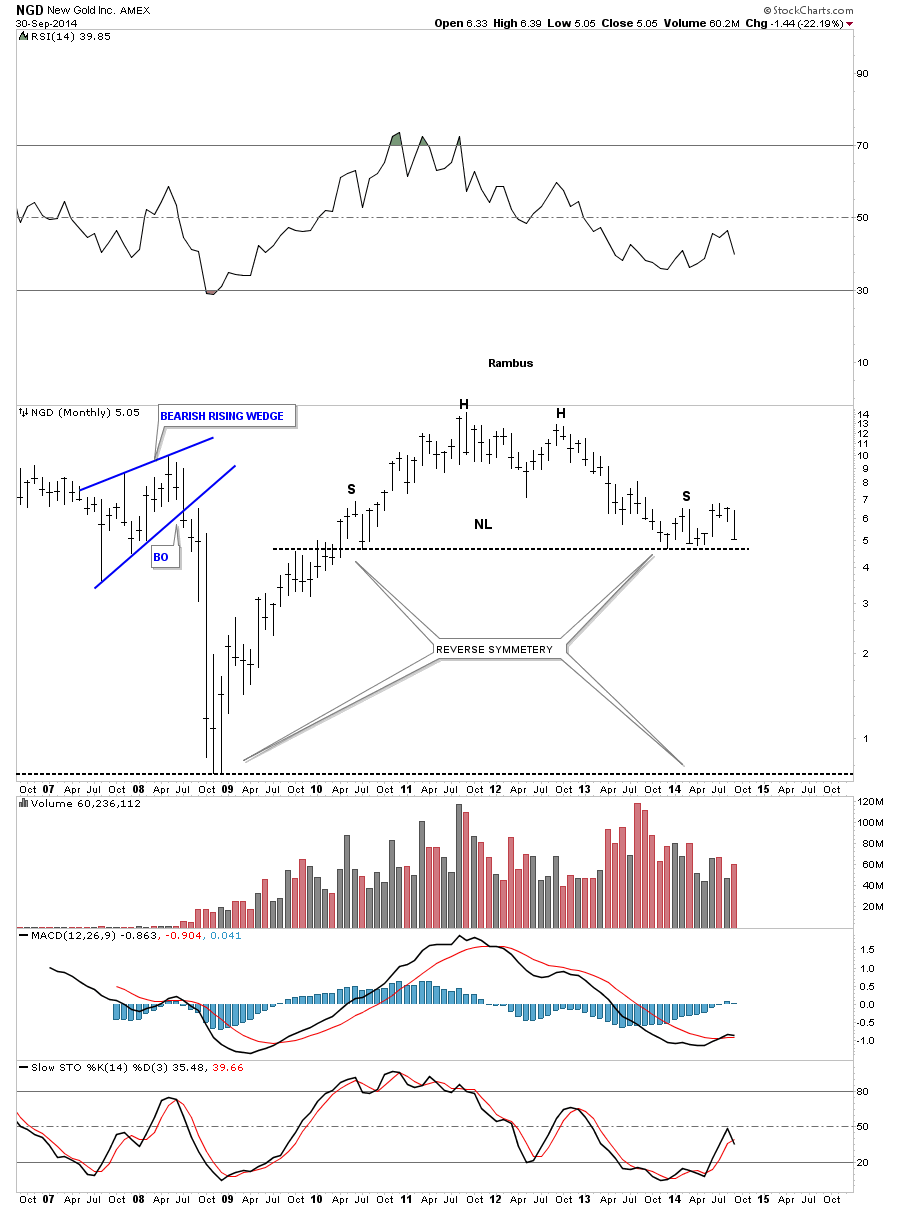
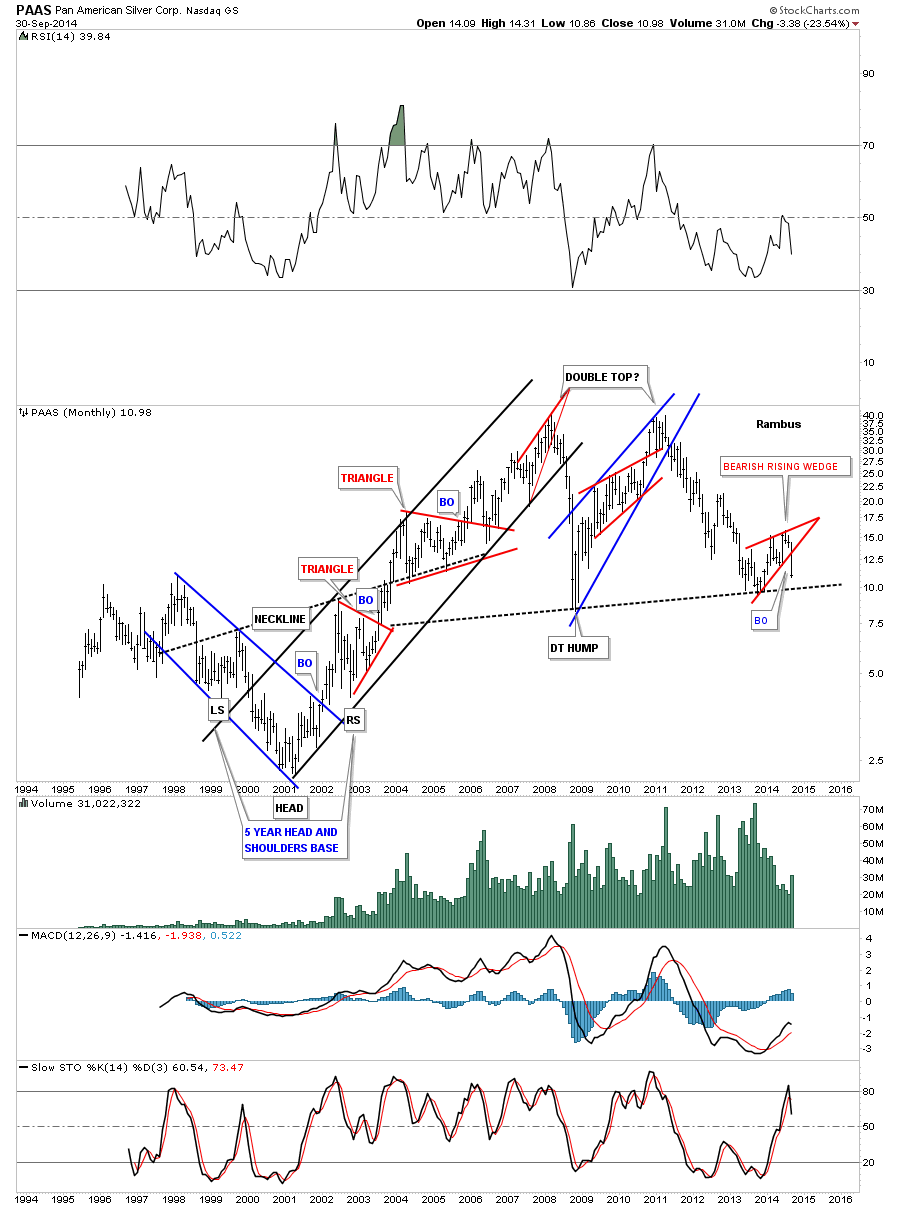
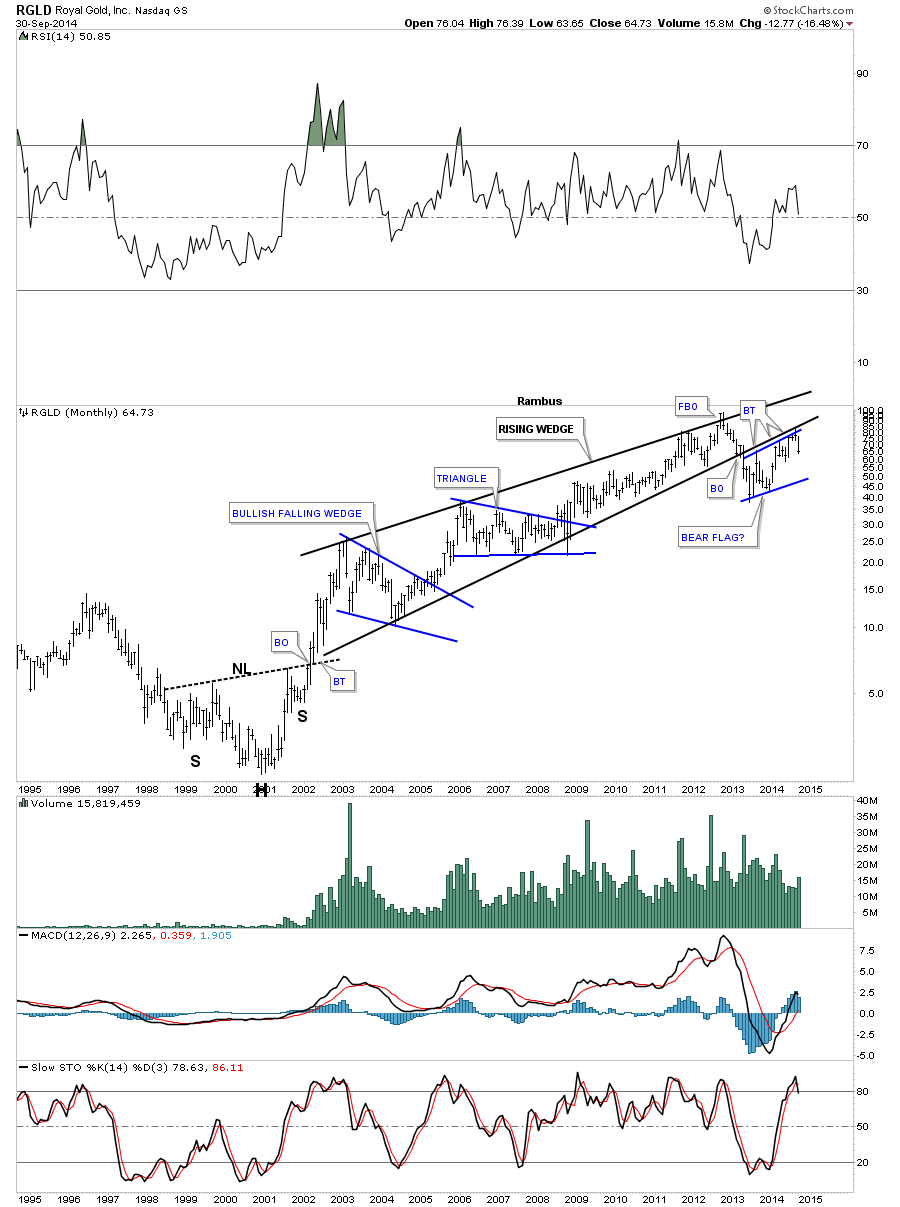
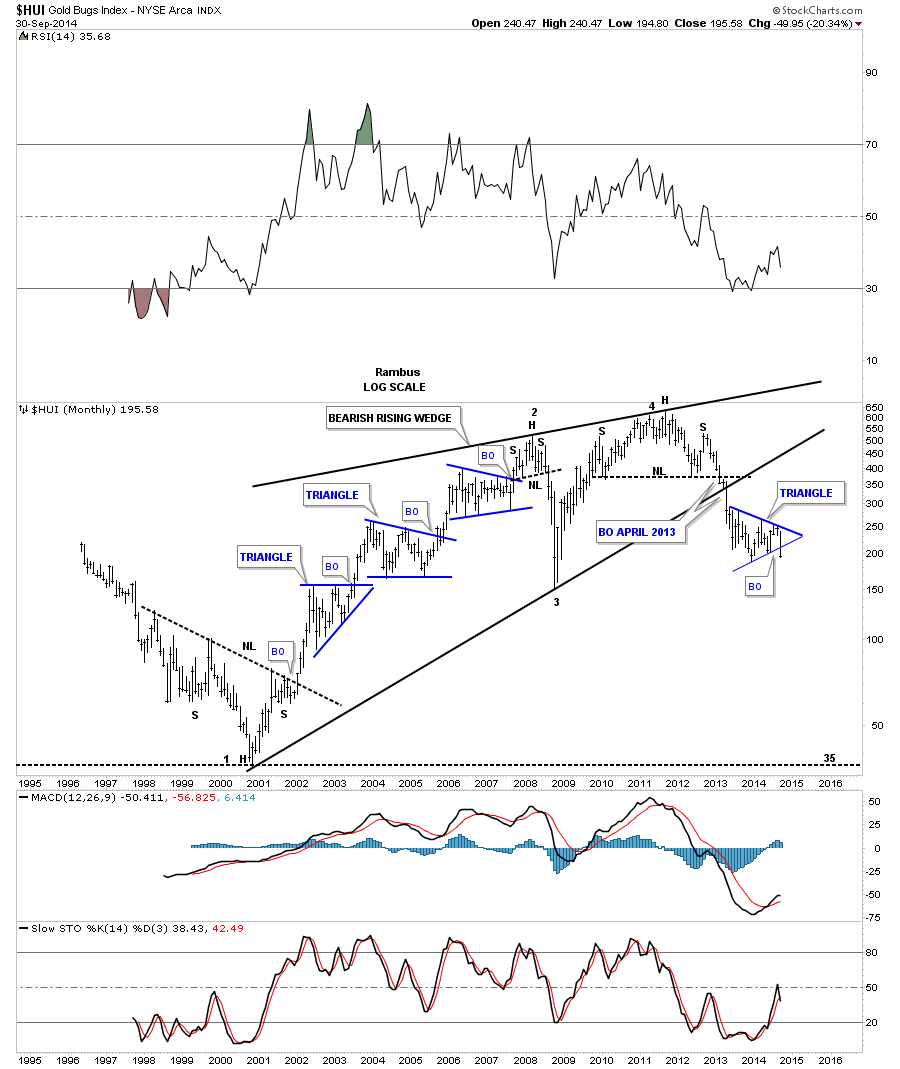
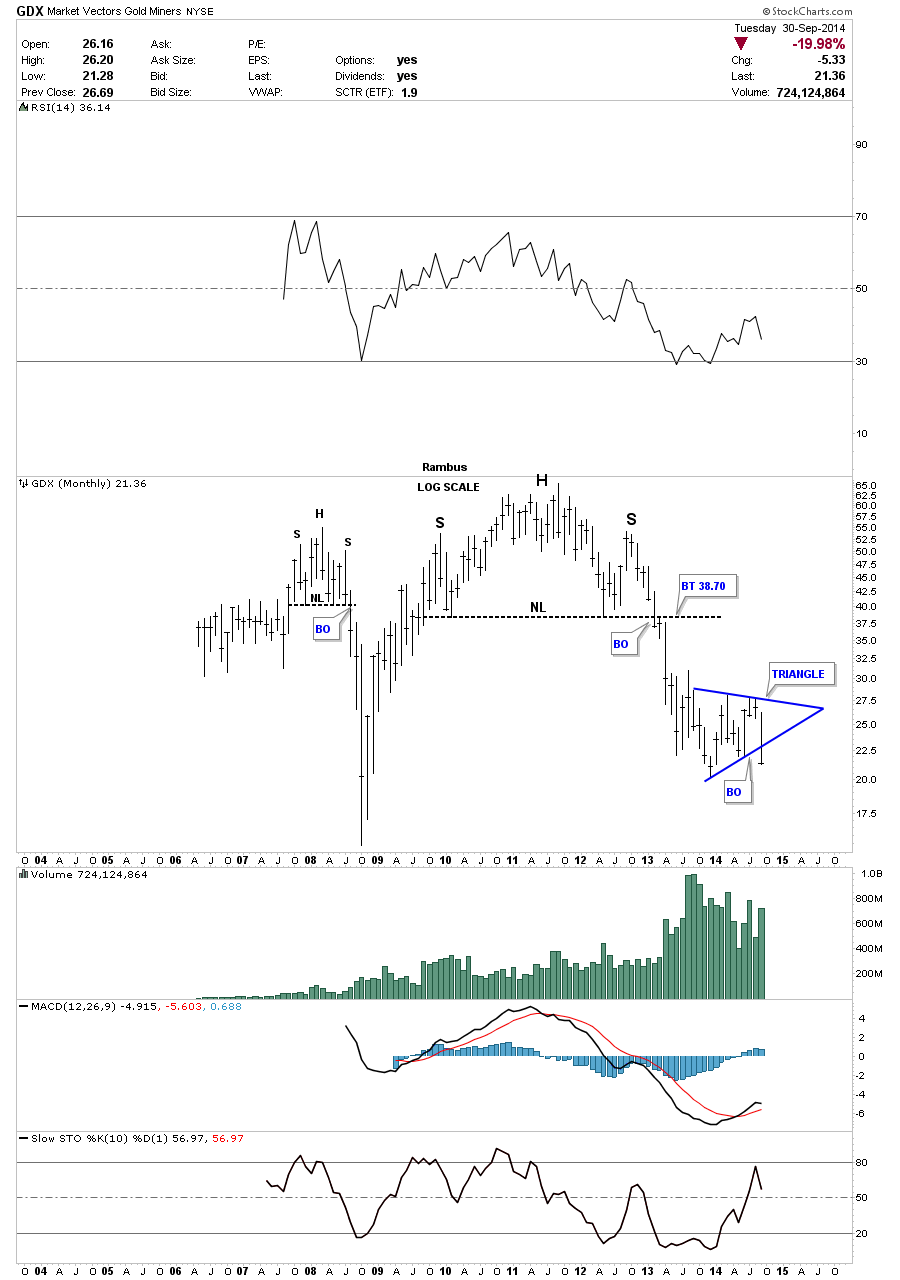
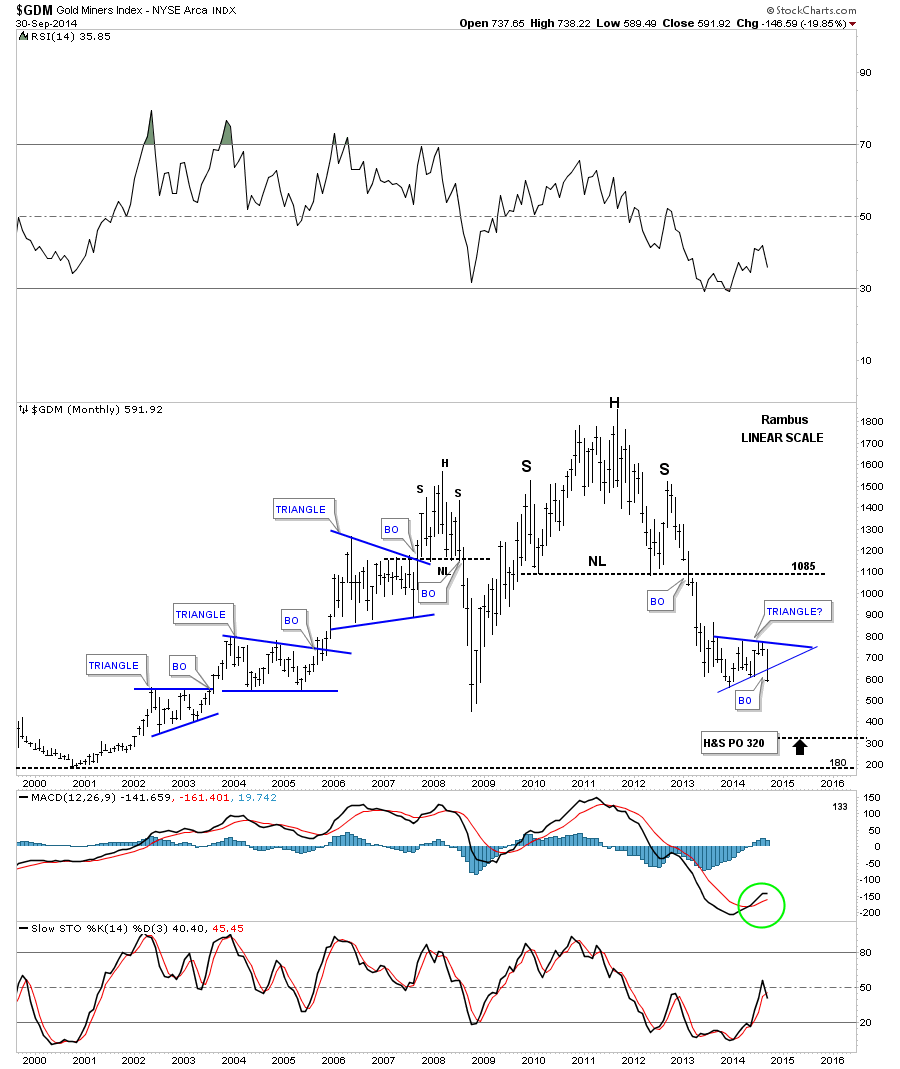
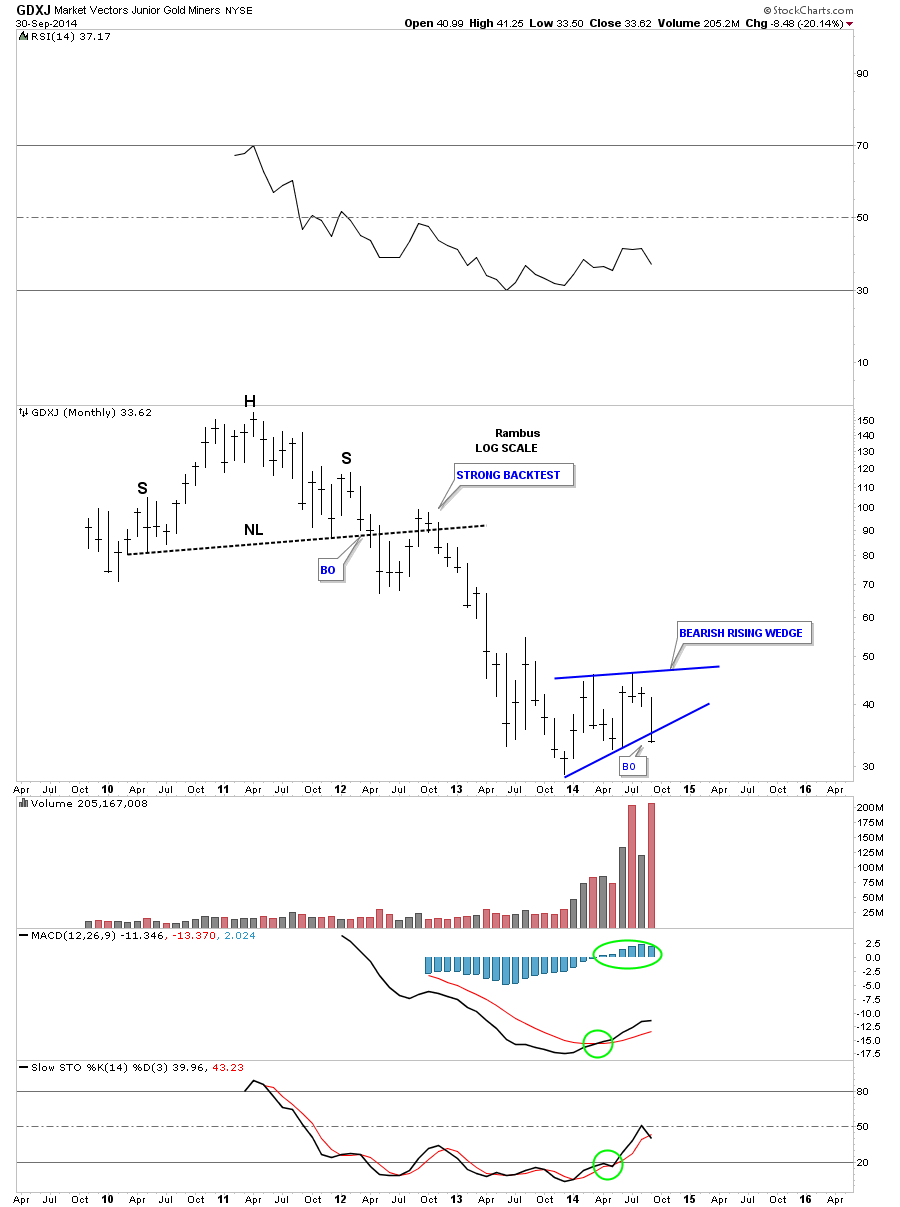
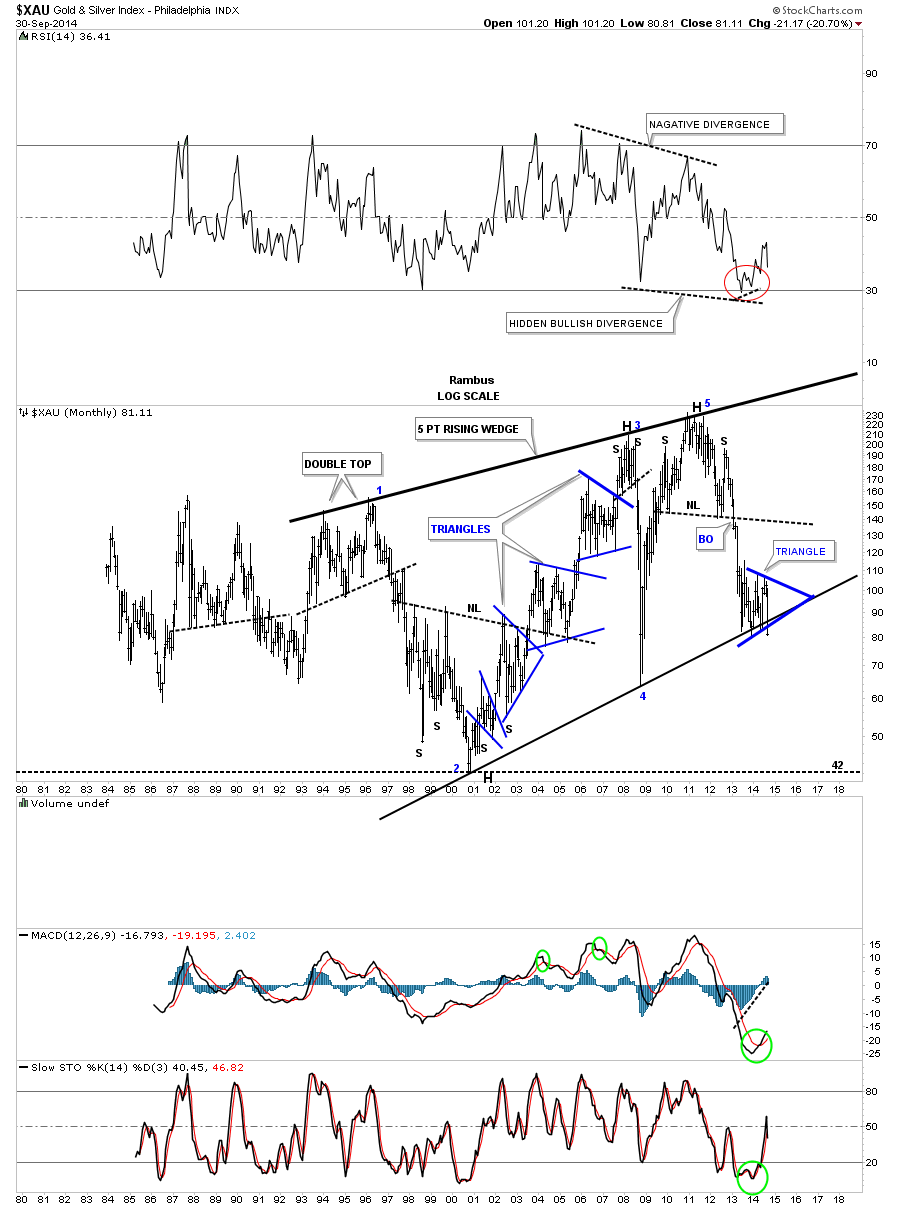
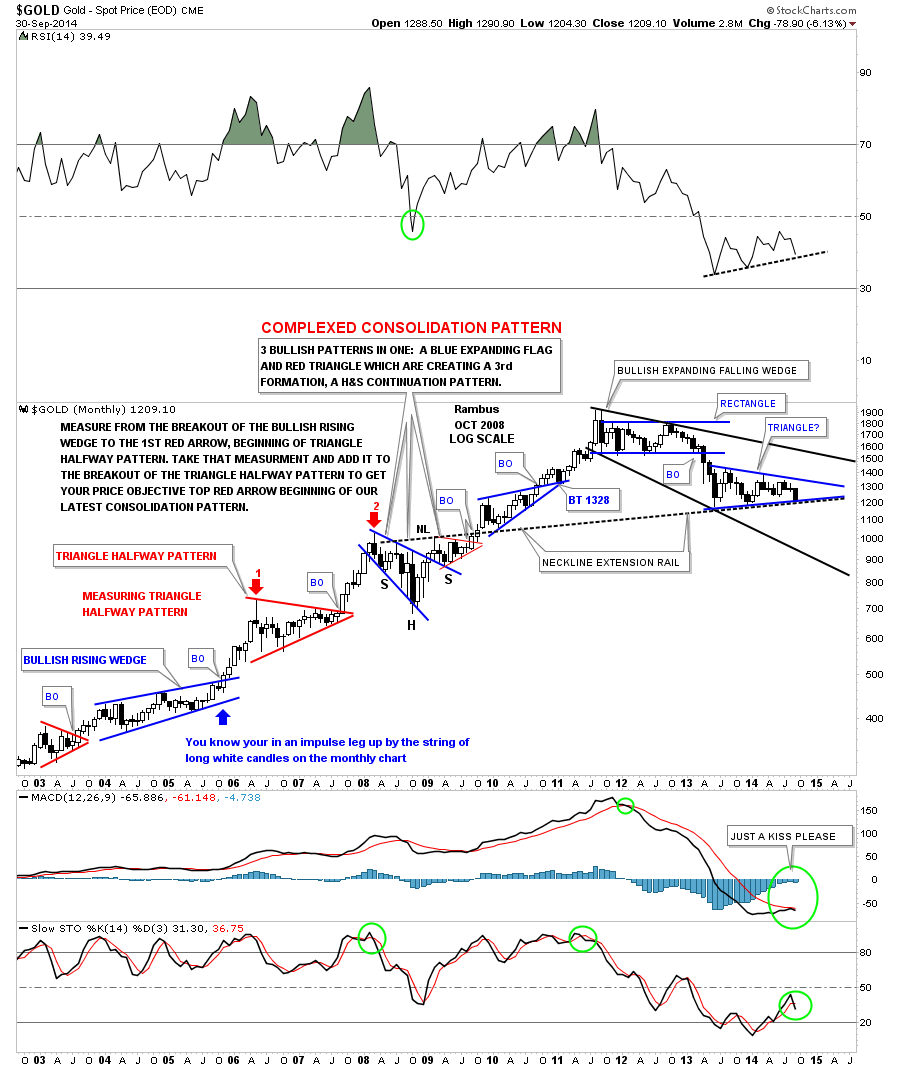
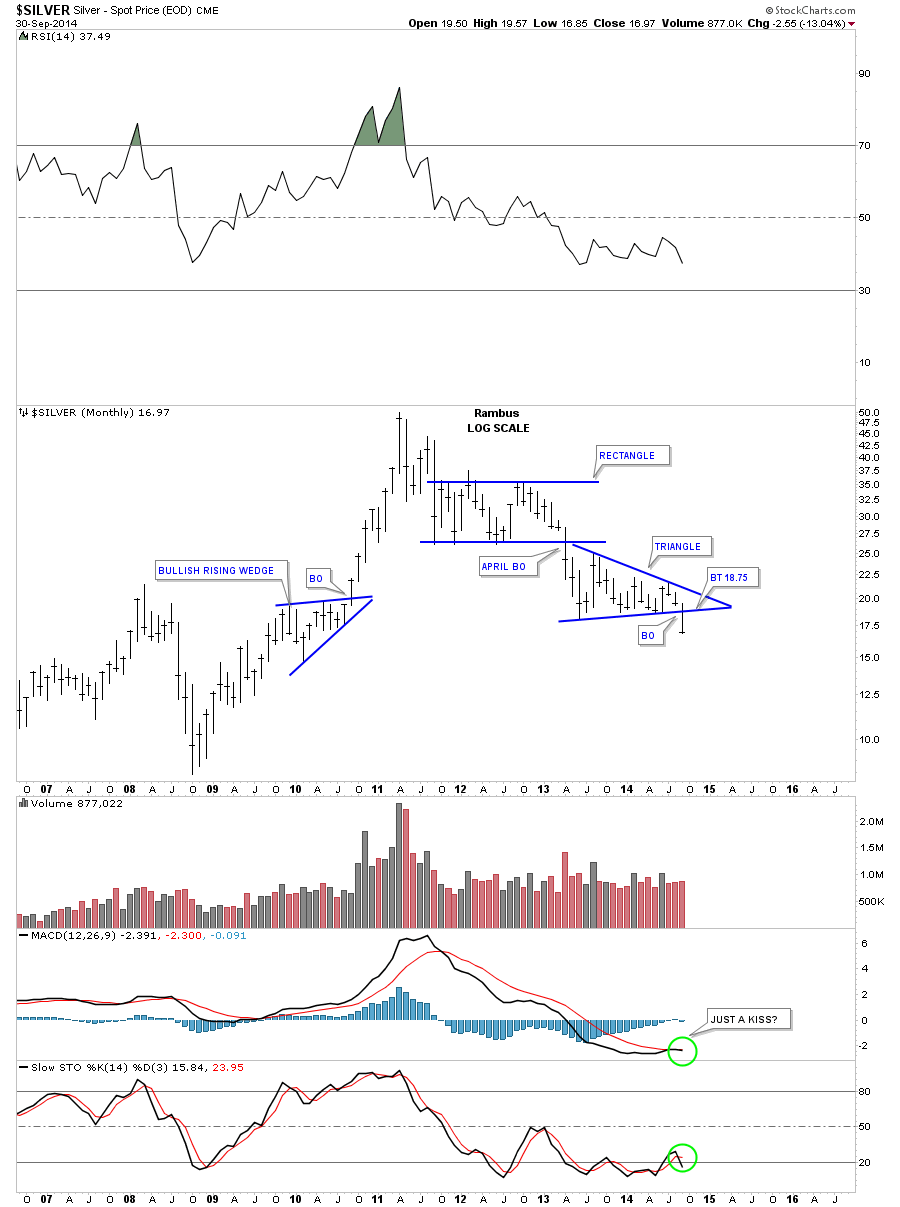
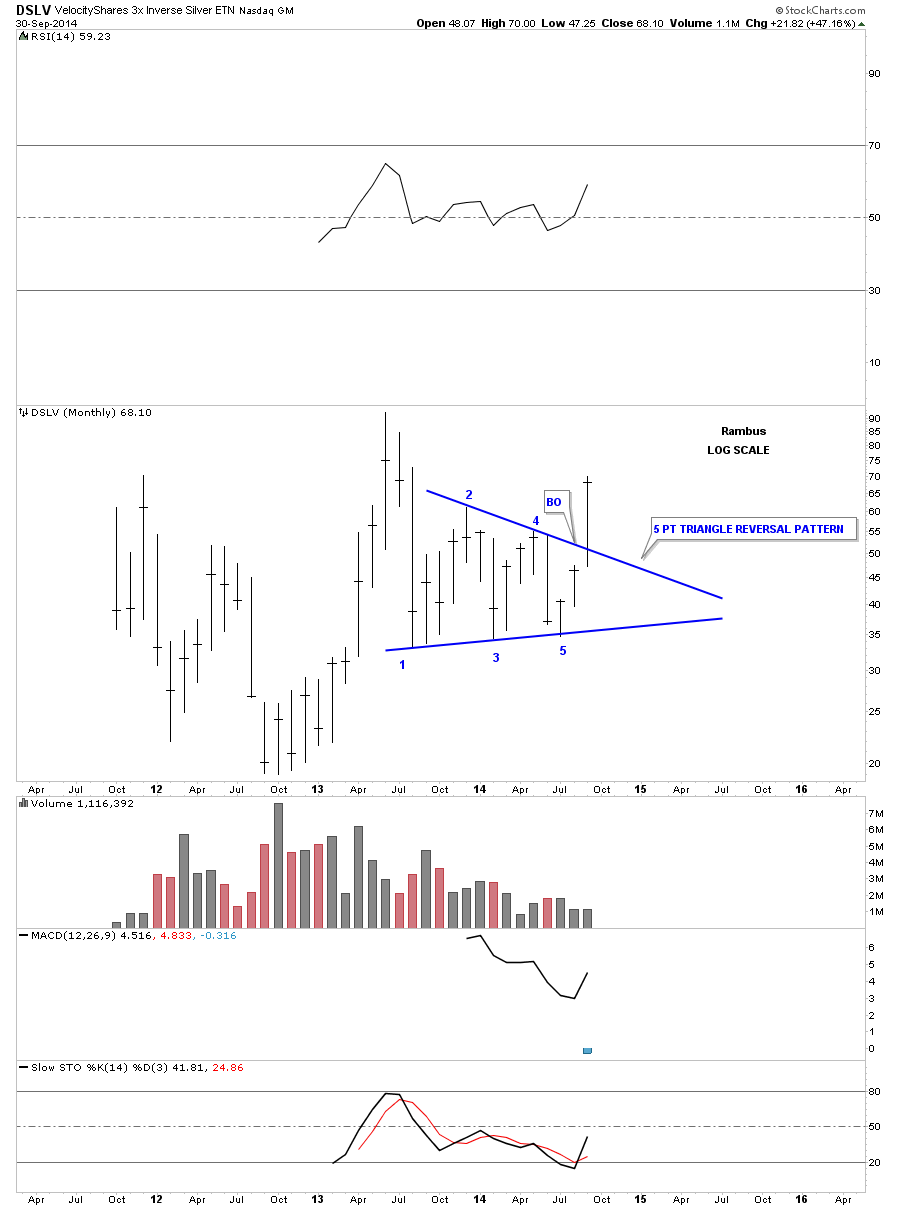
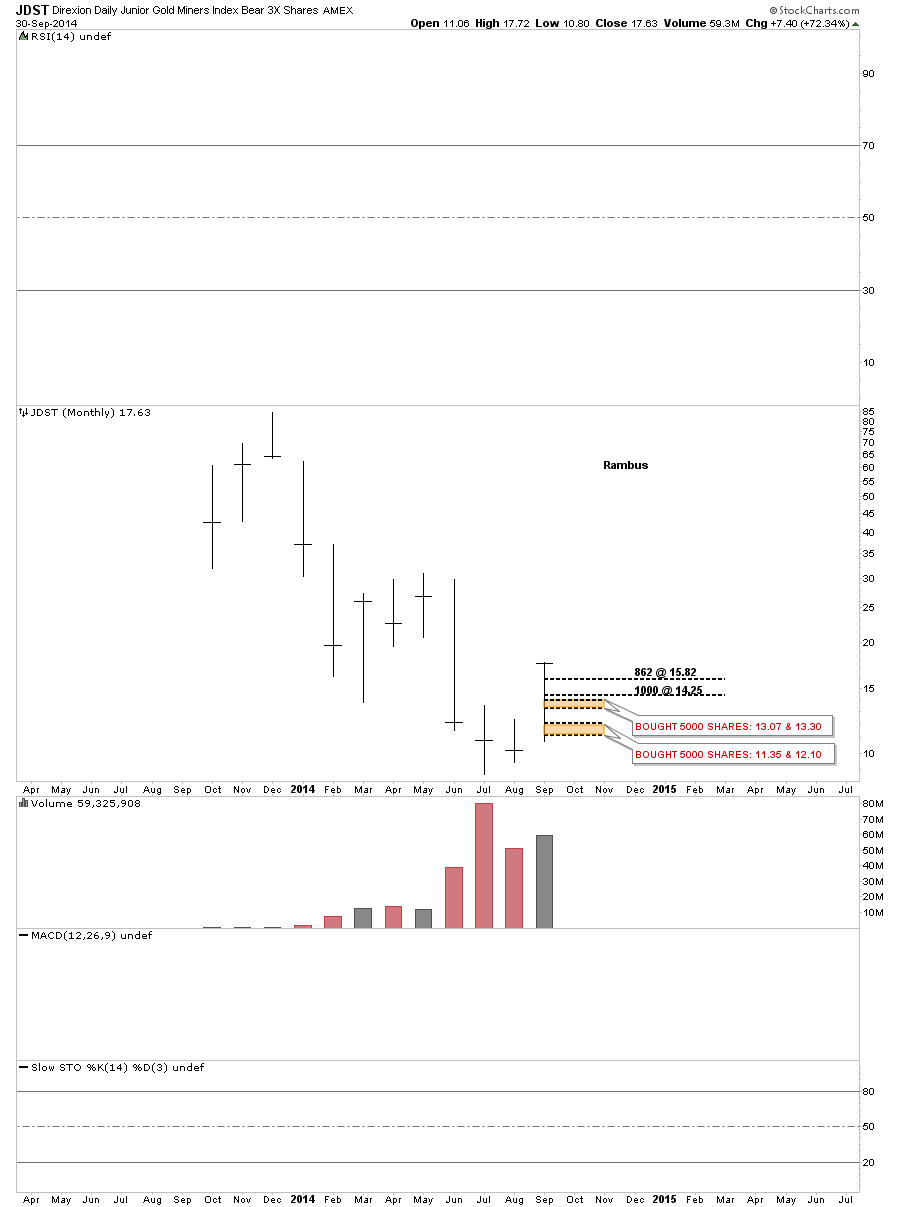
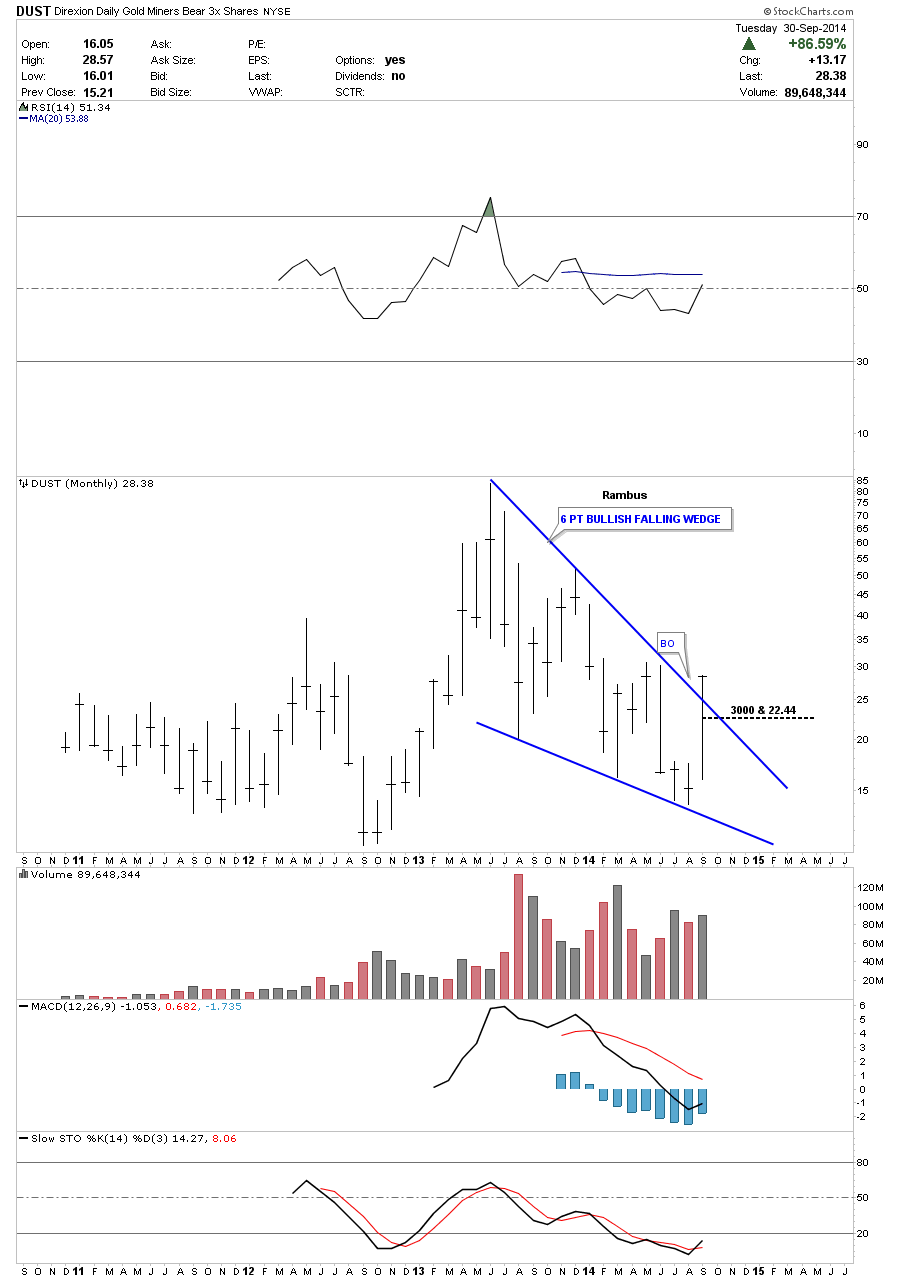
This is a Plethora of Monthly PM Miner Charts that Rambus Posted in preparation for what has transpired the last couple of days in the PM Markets . I think If you study these charts and then compare some of them to todays charts it would be a very constructive exercise .
.This is a Teaching Site first and foremost .We love nothing better than to hear stories from members who have embraced Chartology and improved their trading success as a result .
For those serious students we recommend reviewing the many posts at the Timeless Tutorial section of the right sidebar. Scroll Down .
Fullgoldcrown (town crier)
And Now Professor Rambus … Weekend Report..October 2 entitled
PRECIOUS METALS STOCKS…TURNING TO DUST
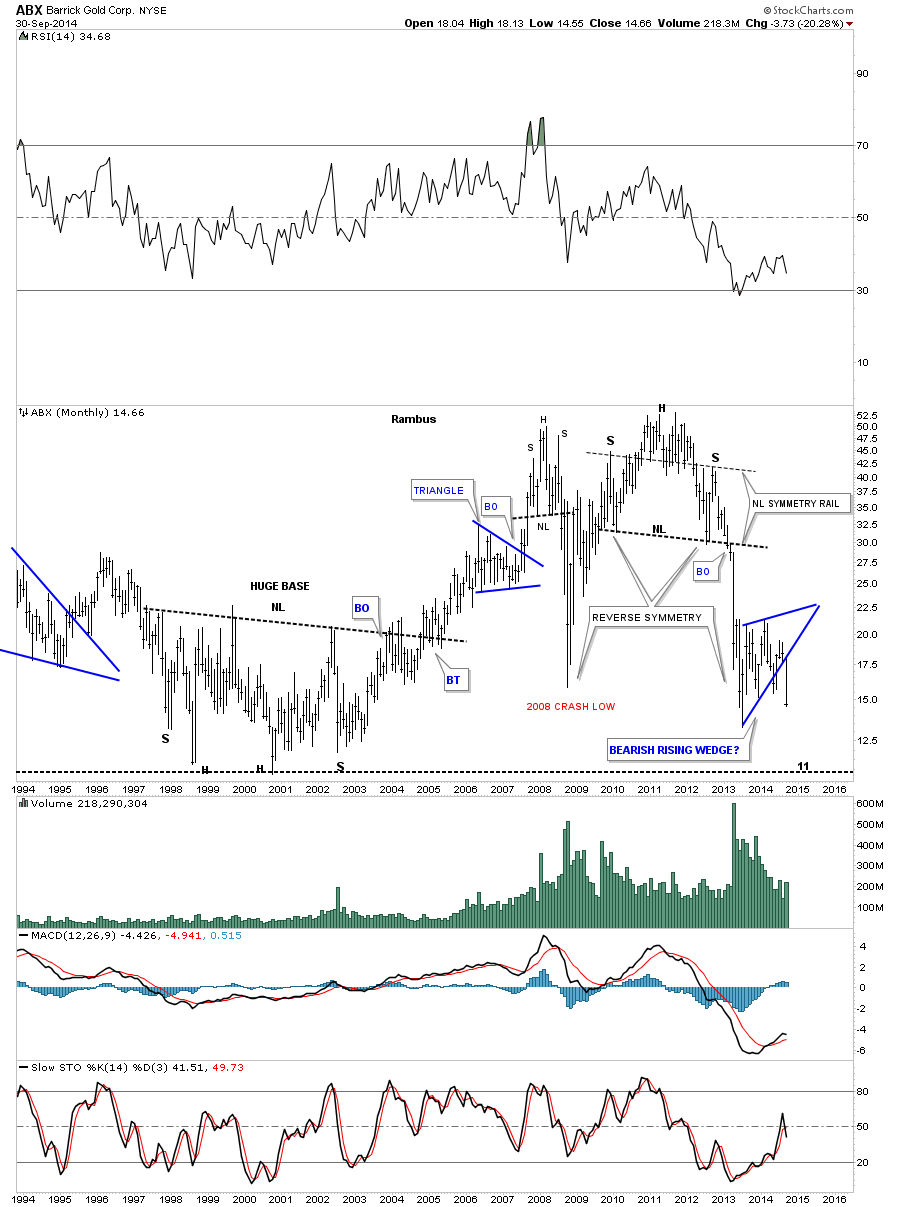
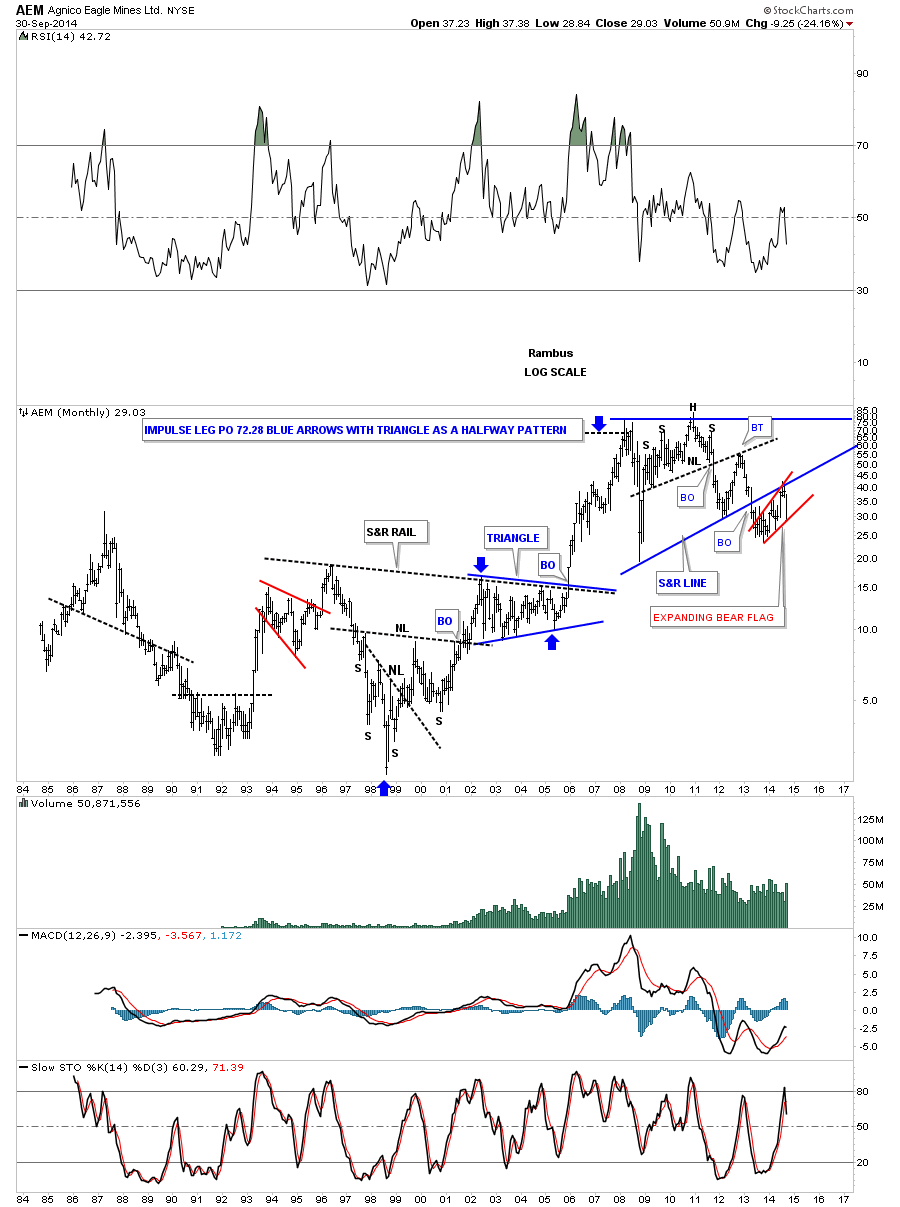
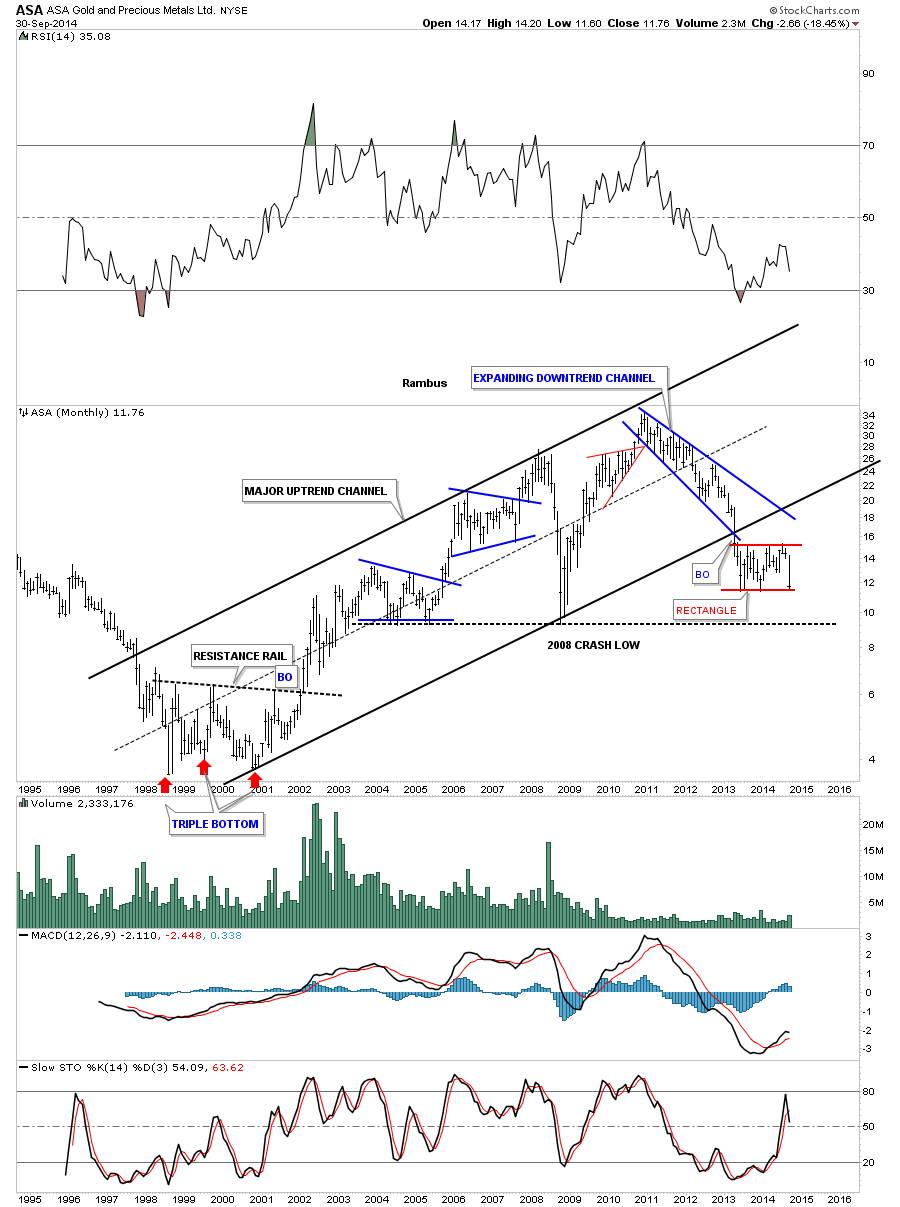
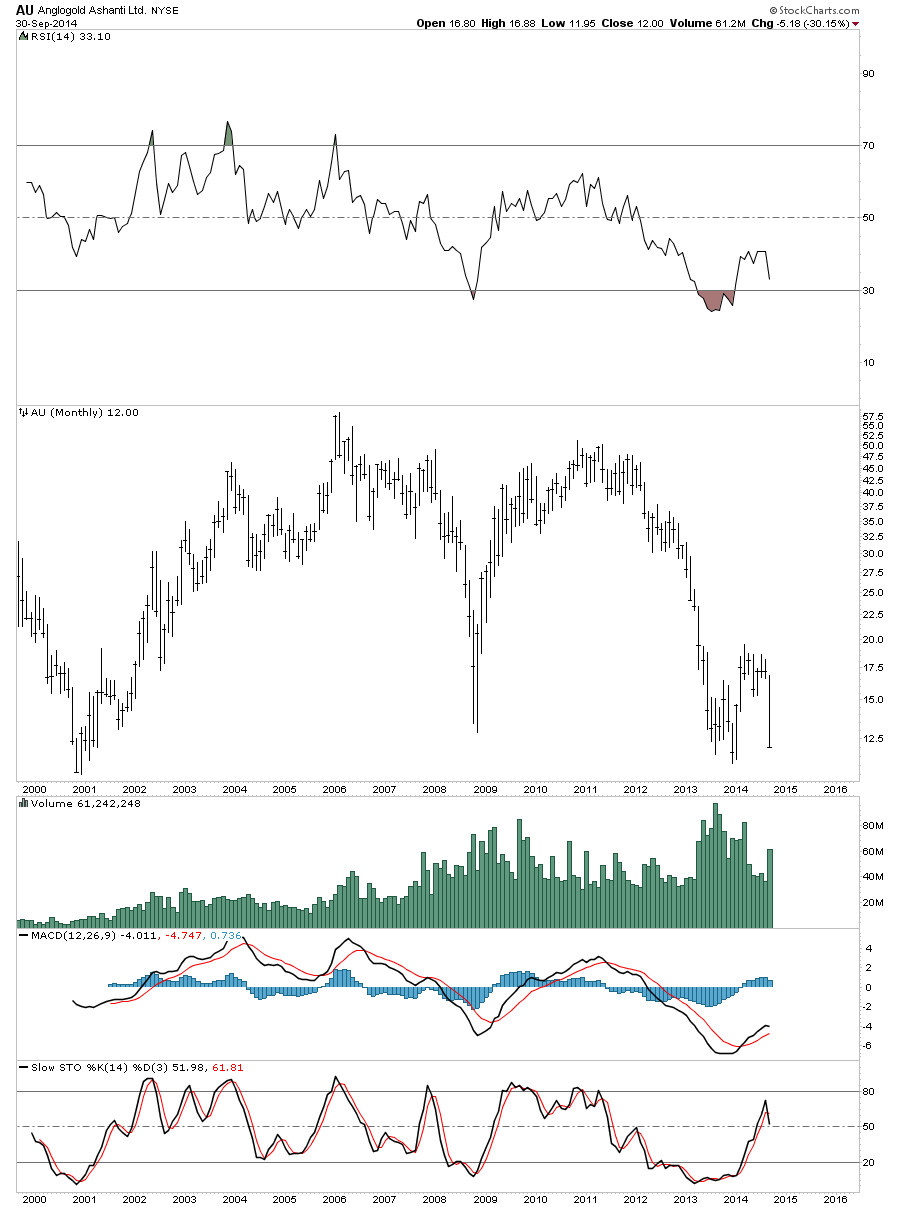
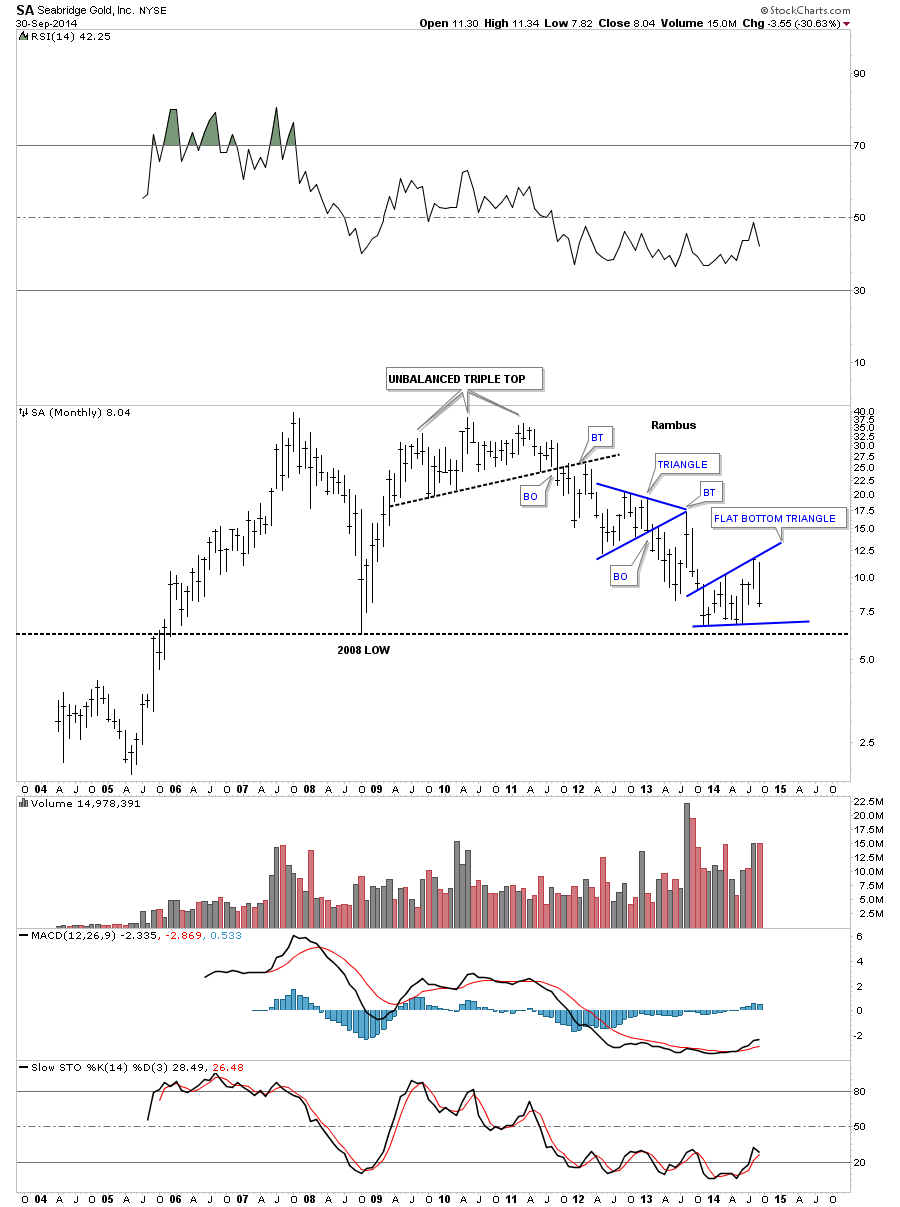
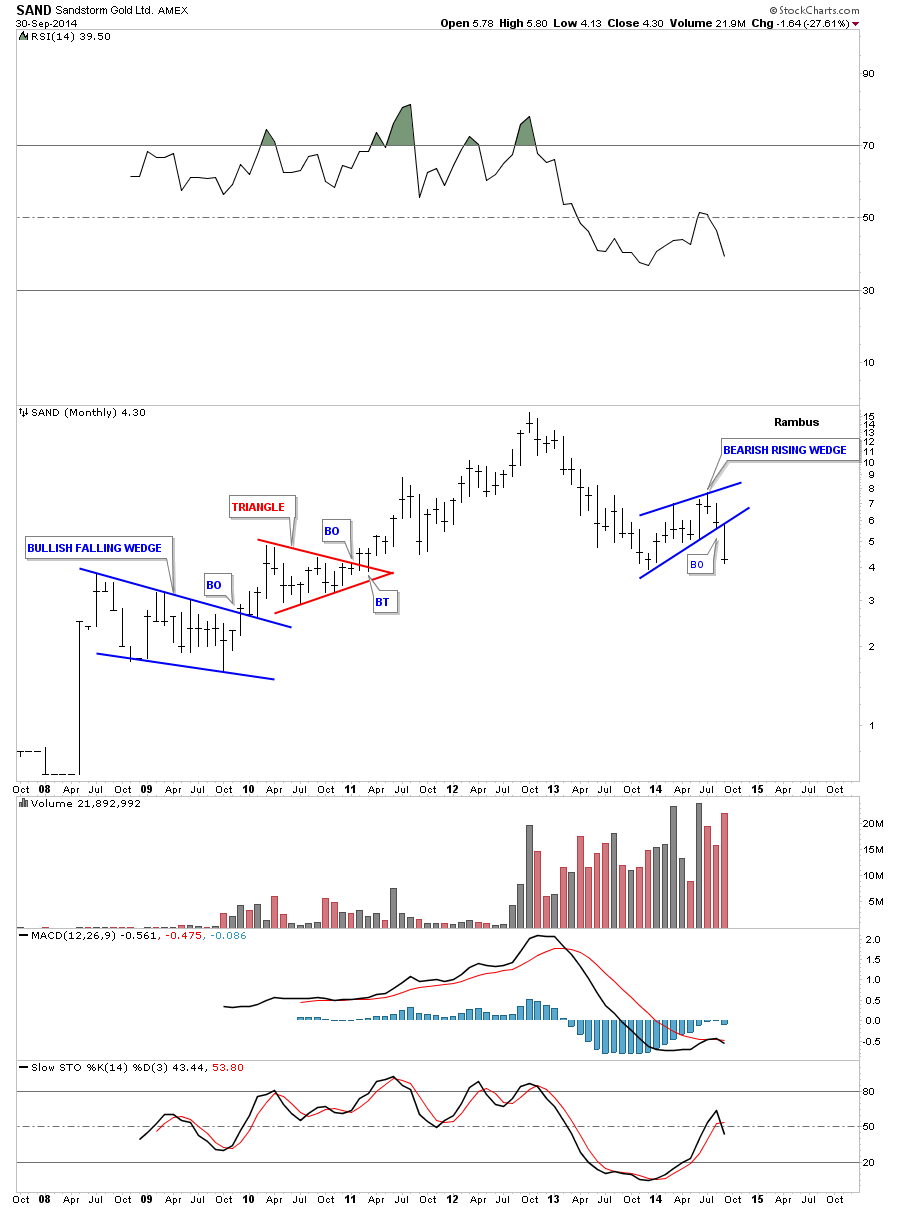
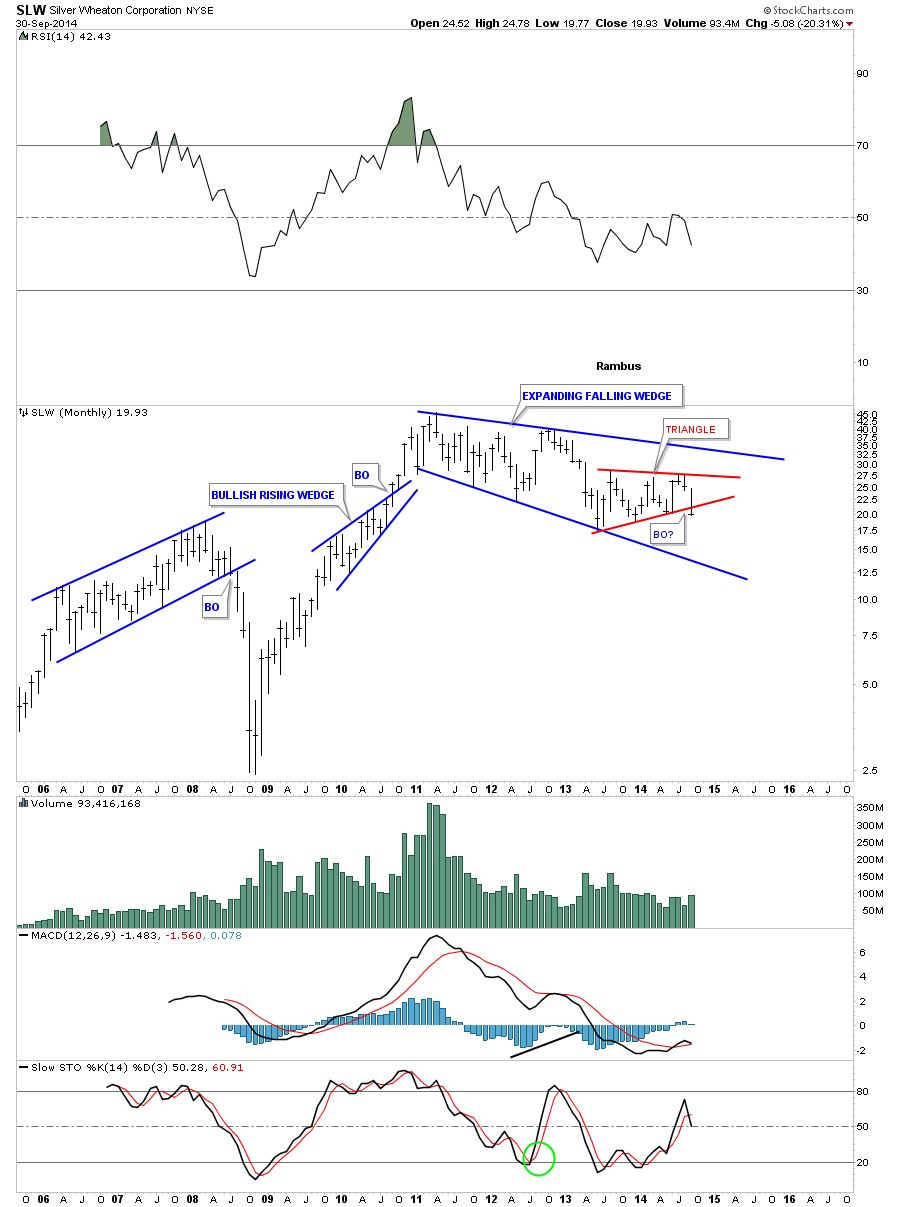
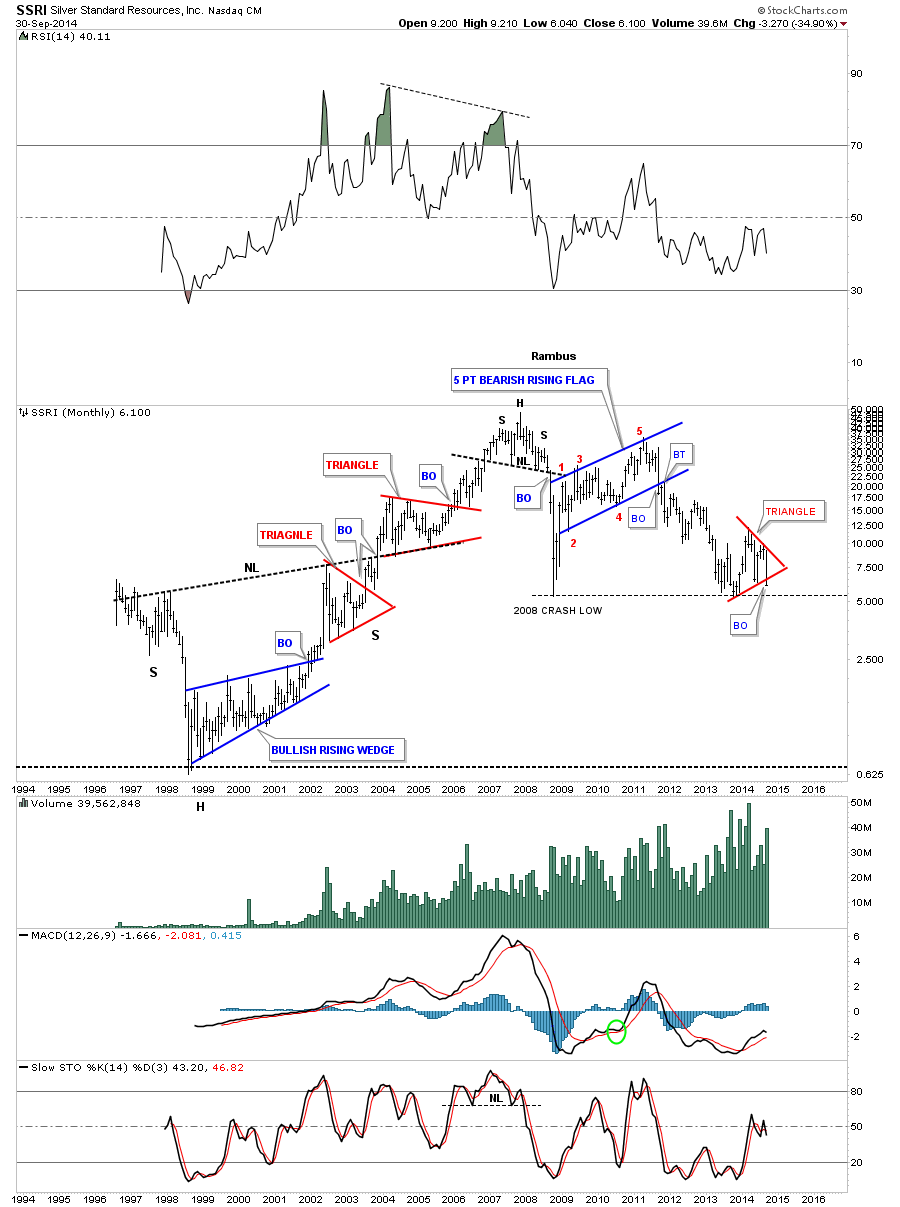
Last night I promised you I would post a bunch of monthly charts for the precious metals stocks that will show their monthly closing price and percentage loss for September. I think you will be surprised at some of the percentage losses that some of the big caps had as the decline has been kind of stealthy.
We took our first round of buys for the Kamikaze Portfolio on September 4th four days into September. When you finish looking at all these monthly charts I’m going to show you, go to the Kamikaze Portfolio Tracker on the sidebar, and see difference one month can make in a portfolio. I can only imagine the pain some of the staunch gold bugs are starting to feel because of their belief that gold can only go up and if it goes down it’s manipulation.
These chart will also show you why I have the confidence to be fully invested in the Kamikaze Portfolio at this time. If one only looks at the PM stock indexes and not at the individual stocks that makeup the indexes you’re missing a very important part of the processes in determining which direction the big trend is. As I showed you in last nights report the big trend is down in the precious metals complex regardless all the fundamental reasons why it should be up.
The charts you are about to see will show you the truth of what is really happening in the Precious metals complex based on Chartology and nothing more. Just look up to top right hand corner of each chart to see what they did for the month of September. These charts are pretty self explanatory so I will just post the charts without any commentary unless I see something that might be interesting.
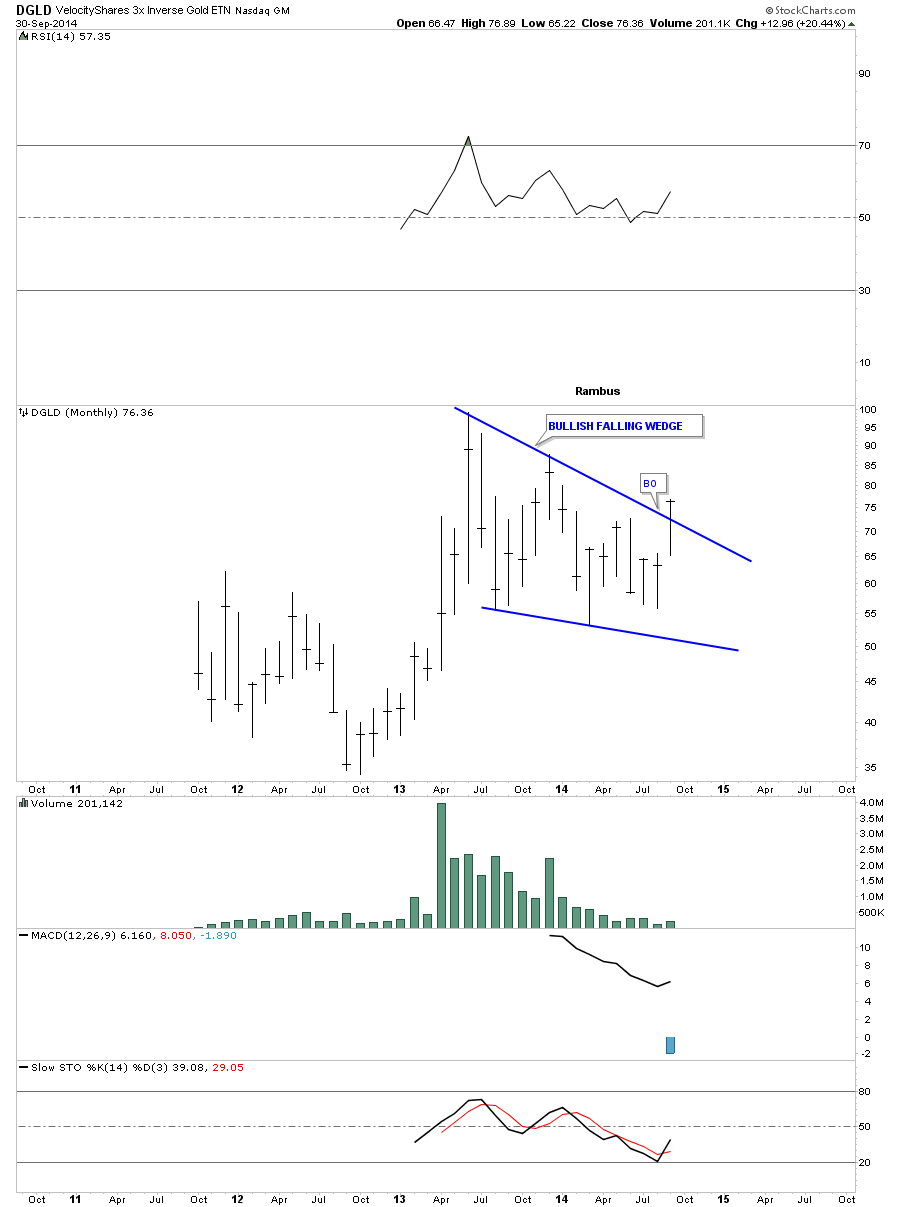
Now the 3 X short the precious metals complex stocks.
The grand prize winner for the month of September. All the best…Rambus
All the best
Rambus

