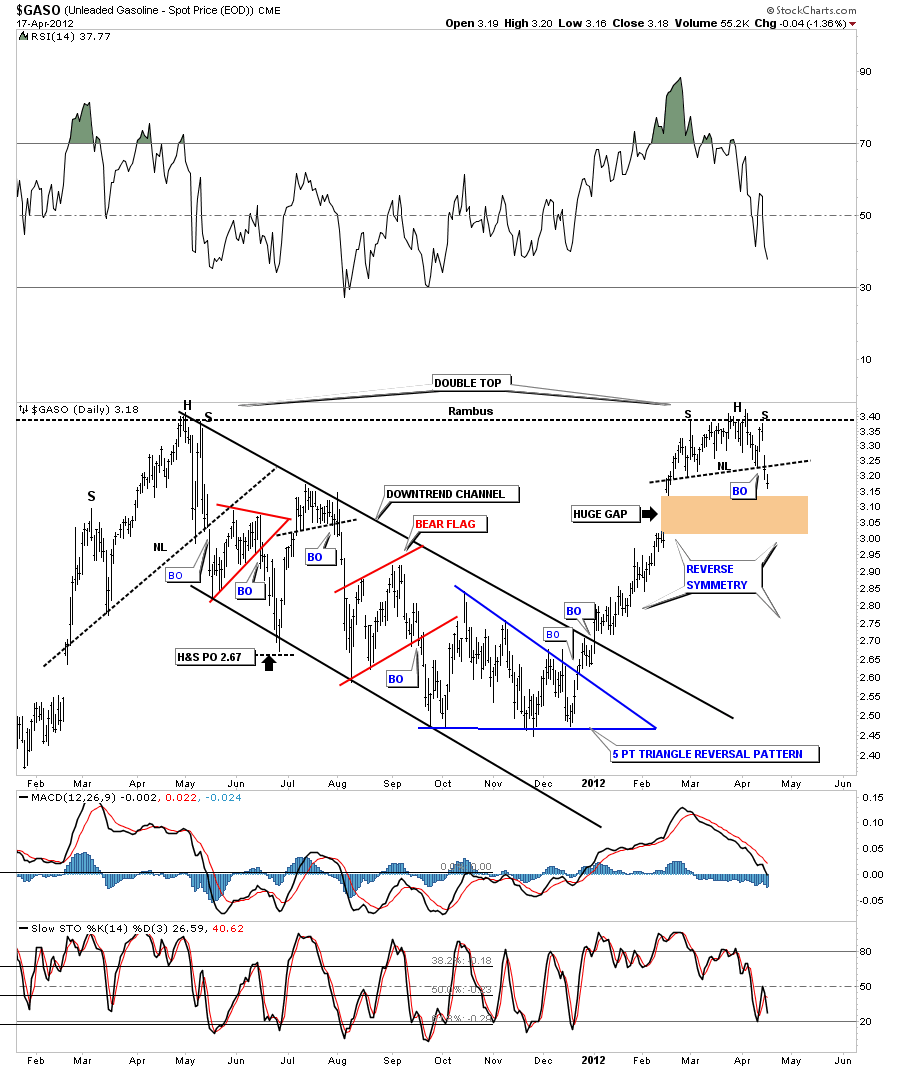
Last week I posted a chart on gasoline that showed we could be in a topping pattern, as part of the risk off trade. After putting in a right shoulder last week gasoline broke the neckline on Monday. There is also a much bigger pattern in play here as well and that is the big double top. The previous top was made just over a year ago last May. There is a good chance that the price of gasoline could fall pretty fast as the rally leading into this most recent top didn’t form much in the way of any consolidation patterns. So when the price starts to move down there aren’t many shelves of support to help stem the decline. I call this reverse symmetry. How it went up is probably how it will come down. Also notice the huge gap just below the neckline. This is an important chart for the risk off trade IMHO.
Rambus Chartology
Moving forward

