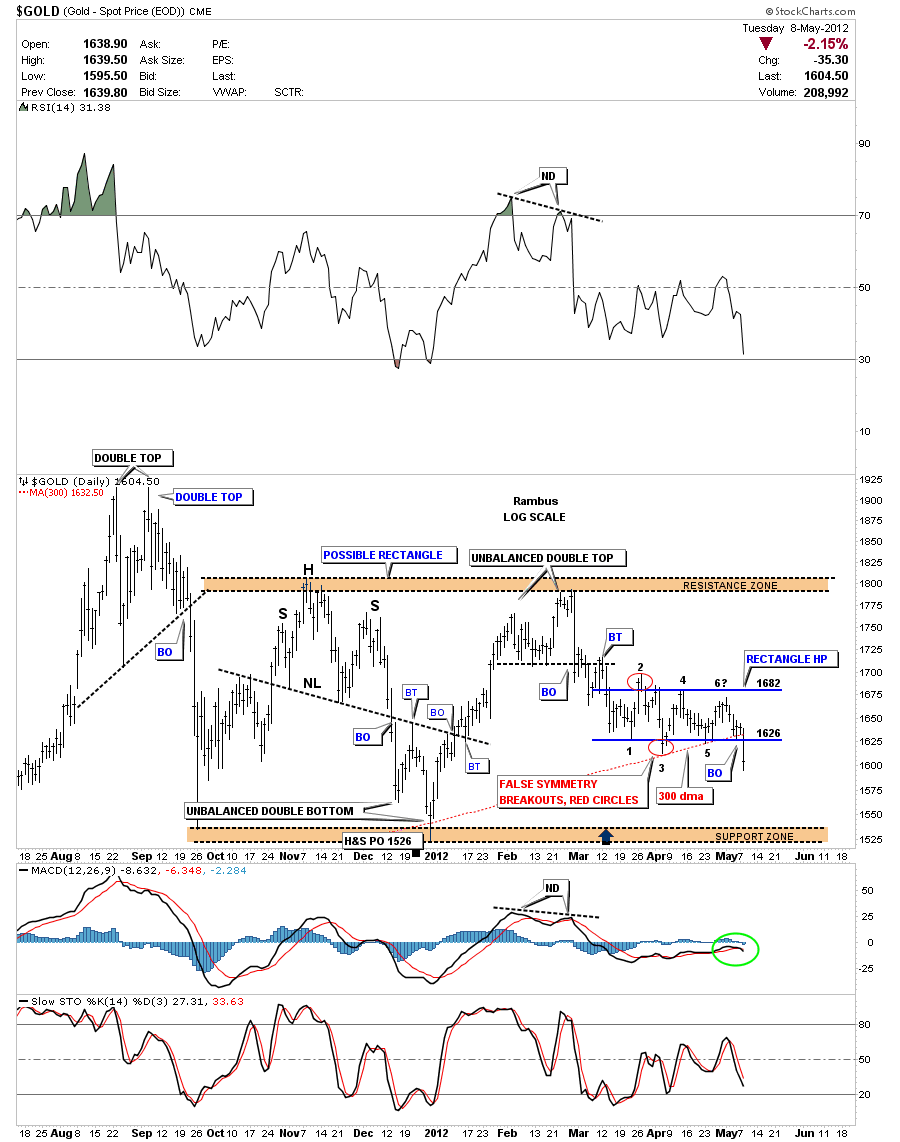
Below is an updated chart of the gold chart I promised you. I don’t see a gap but it definitely broke the bottom rail of the rectangle and also the all important 300 dma. The bottom of the rectangle will now act as resistance on any backtest at 1626. Notice how long today’s bar is vs the ones inside the rectangle consolidation. That’s what I like to see on a breakout, a nice long bar.
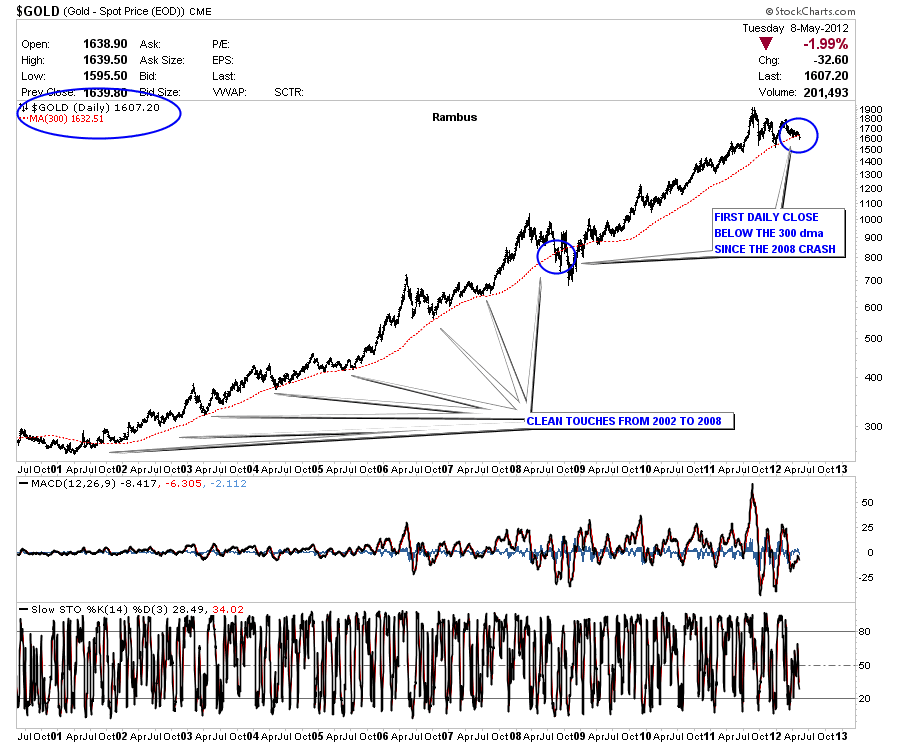
The chart below shows the 10 year bull market for gold and the 300 dma. You can see how impressive the 300 dma has been. Today’s move is out of character for the 300 dma and one should pay close attention to what it maybe saying.


