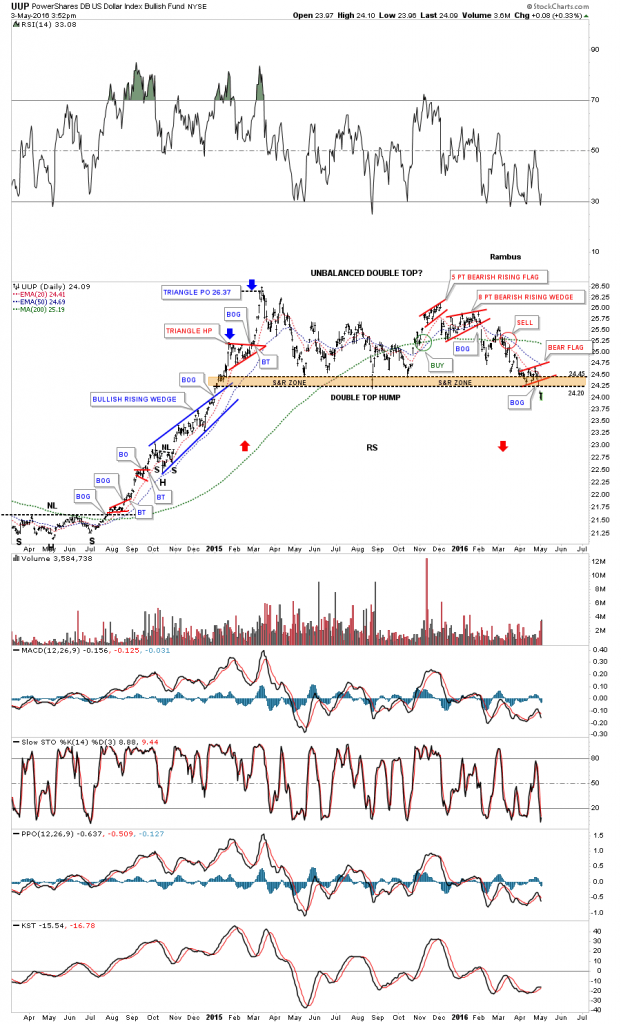
Below is the two year daily chart we’ve been following very closely. Last week the price action broke below the bottom rail of the small red bear flag that formed right on top of the brown shaded support and resistance zone. That little red bear flag has given the UUP the energy it needed to break below the S&R zone. Note the gap below the bottom of the S&R zone. The brown shaded S&R zone may also be the double top hump which should now reverse its role to what had been support to now resistance if the double top is going to play out to the downside. It’s still possible we could see a backtest to the underside of the S&R zone between 24.20 and 24.45 that should now act as critical resistance.
The other very important feature of this two year daily chart is the possibility that we could see some reverse symmetry to the downside. Note the eight month impulse move the UUP made from July of 2014 to March of 2015 which was nearly parabolic in nature. Longer term members will remember how we tracked that big impulse move up and how many small consolidation patterns formed a rising wedge or flag which is the sign of a strong move when they slope in the same direction as the trend and not against it. If the PM complex and commodities are going to have a strong rally it will be because the US dollar will be in a strong impulse move down. We now have a very clear line in the sand as shown by the brown shaded S&R zone between 24.20 and 24.45. Above will be negative for the PM complex and below positive.
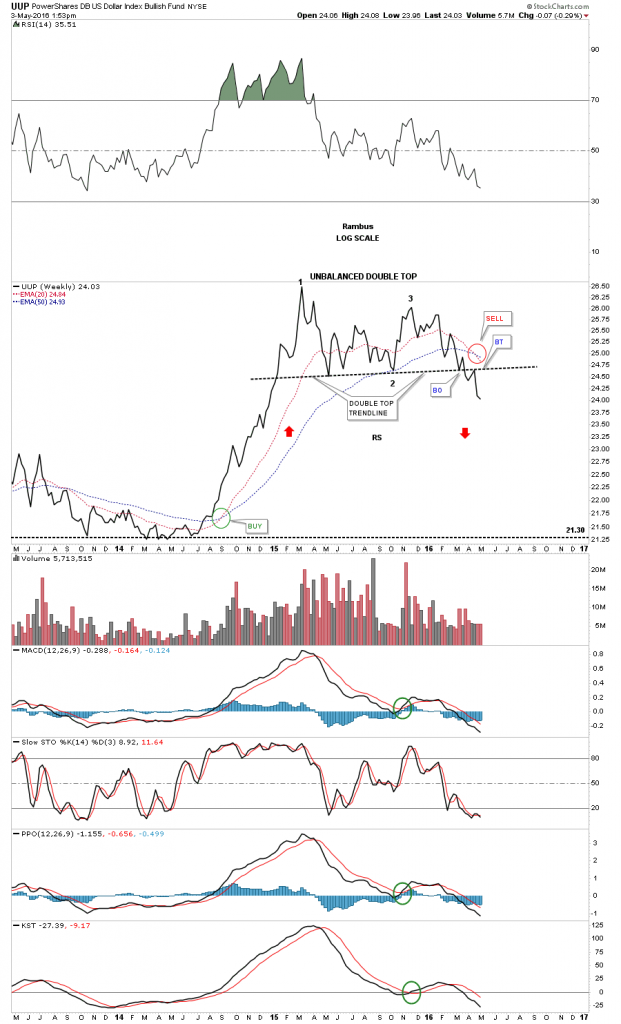
The weekly line chart shows the double top in place with a breakout and backtest to the double top trendline. A reversal pattern always has an odd number of reversal points so a double top or bottom will have at least three reversal points. This weekly line chart also shows how steep that impulse move up was in 2014 and 2015. This is the kind of setup to see reverse symmetry down over the same area as the rally. As you can see there were only a couple of weeks that were down over that eight month rally so there isn’t much in the way to halt a decline once it gets going. Again the double top trendline is our line in the sand for the PM complex and commodities in general.


