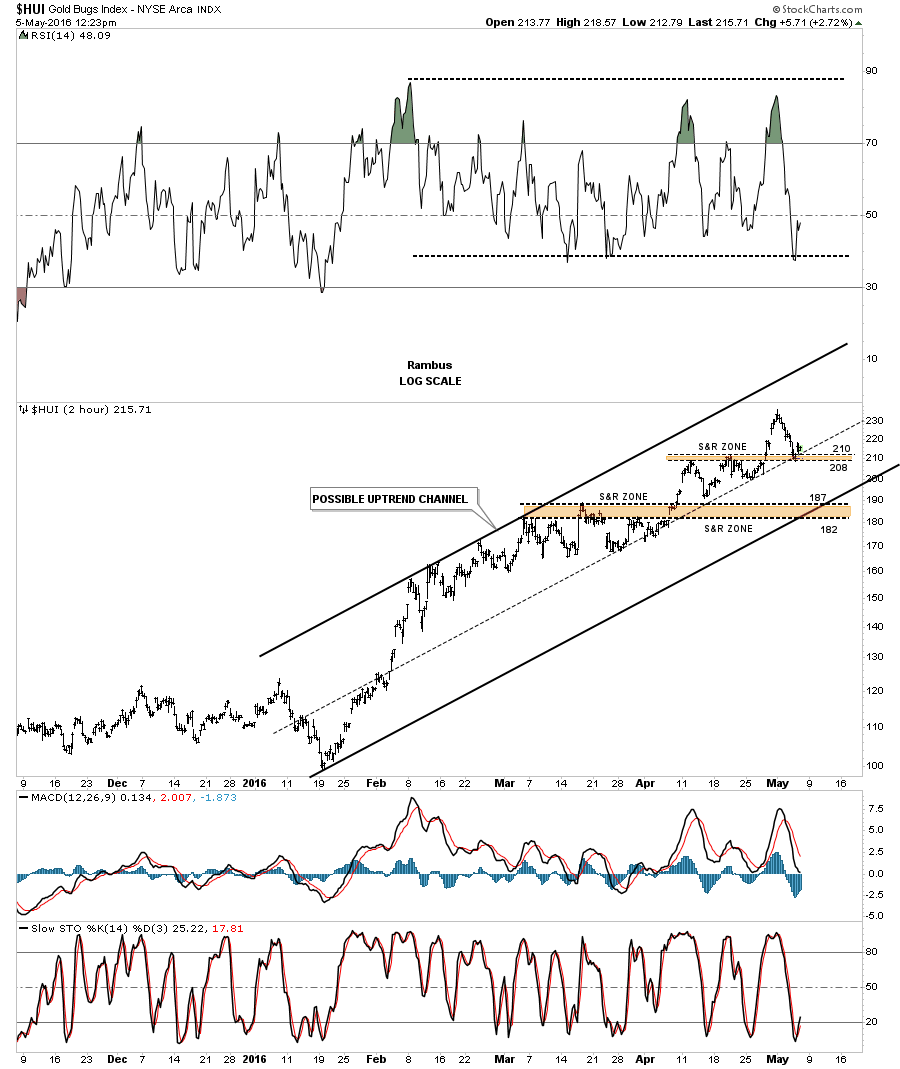
When looking for support and resistance many times I will build out a horizontal zone which will generally have several previous highs or lows depending on what direction the move is taking place. For instance, on the HUI two our chart below, the previous small tops that formed in April shows the latest brown shaded S&R zone which comes into play between 208 and 210. There was another brown shaded S&R zone that worked well with the March highs as support. If the 2008 to 210 S&R zone gives way then I’ll be looking at the March S&R zone for critical support. If that one gives way then we’ll know a bigger correction is in order.
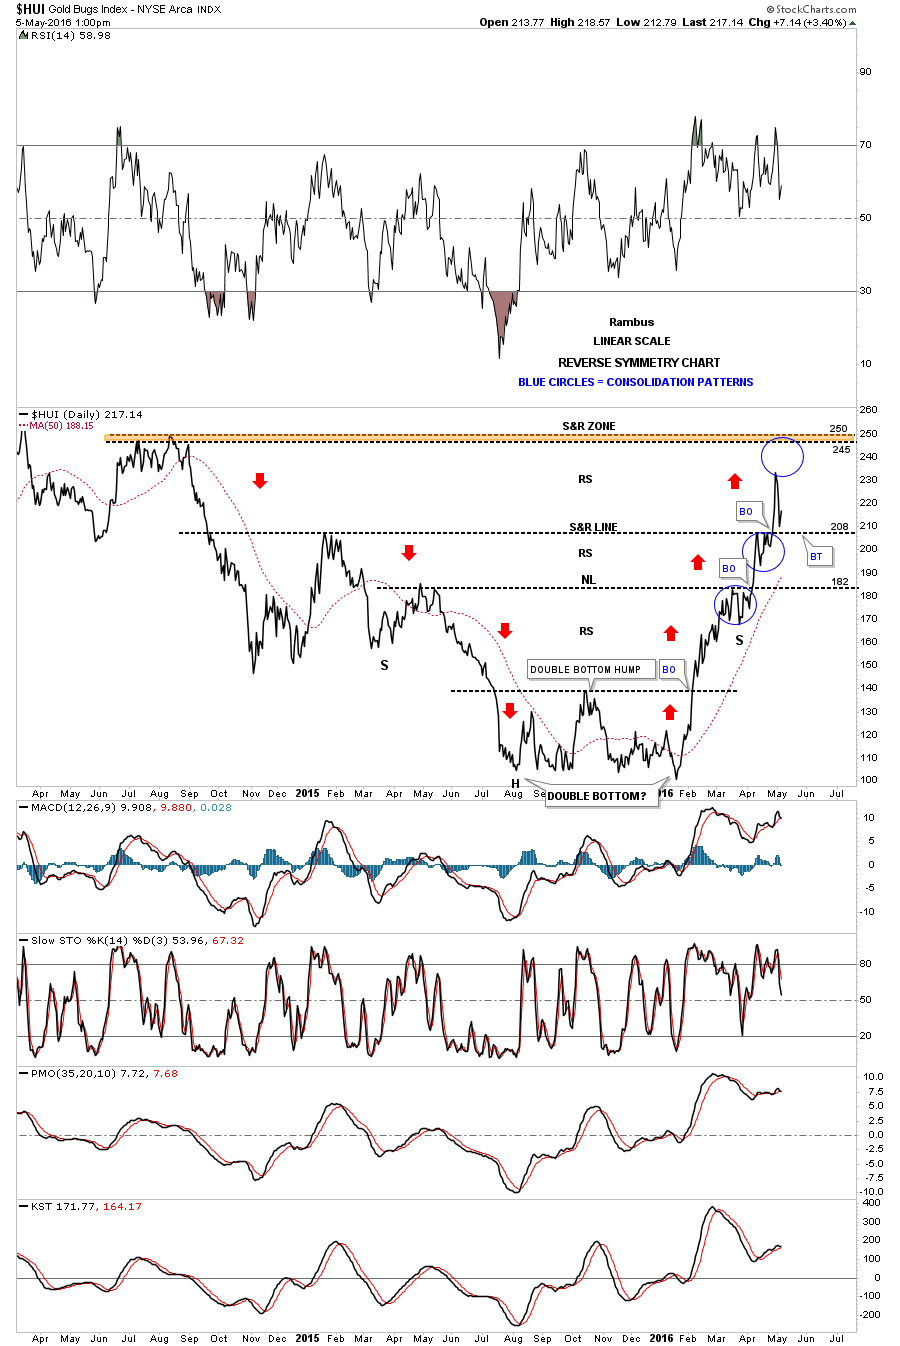
This next chart for the HUI is a two year daily line chart which shows how the reverse symmetry is building out. The blue circles shows how the price action hit the horizontal support and resistance line and then built out a small consolidation pattern just below it before the breakout. This is perfect Chartology. This rally off the January low has been very strong and near vertical. The failure of the price action to reach the top brown shaded S&R zone between 245 and 250 suggests it needs a rest which it has been doing by correcting down to the previous S&R line at 208.
I know it’s not fun to be in the markets when the inevitable pull backs take place but that’s part of the game. Having a game plan and an idea of where to look for possible support makes riding the corrections out much easier. When one is in the dark with no idea of where possible support may show up, that’s when emotions will take hold, making you do something you might not want to do. For the time being the new trading range now exists between roughly 200 and 250 where anything can happen in the short term which will be just noise.
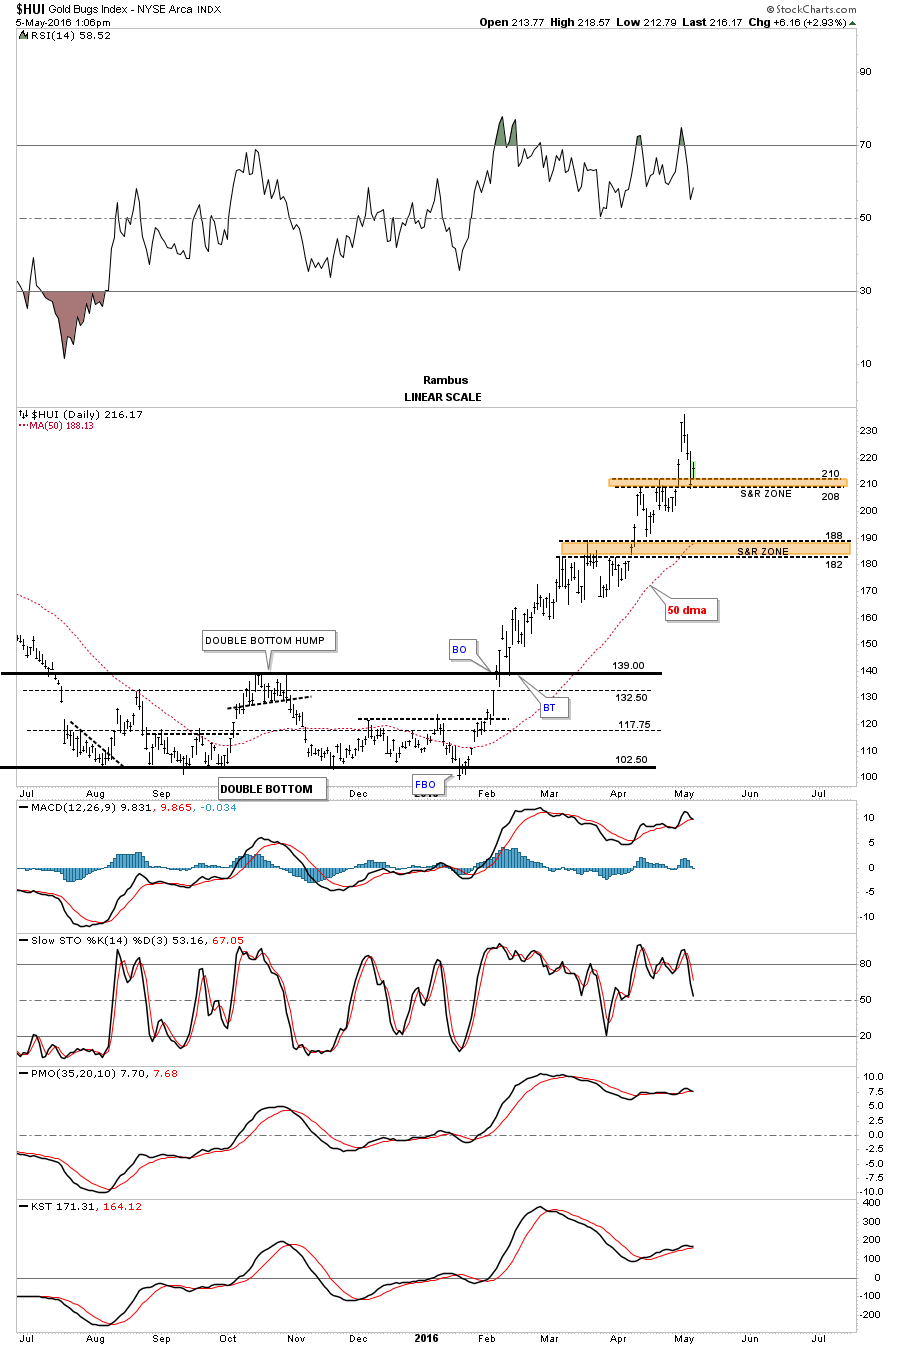
Below is a shorter term daily bar chart which shows the two brown shaded support and resistance zones. The 50 day ma has now risen up to 188 which should offer some support if needed.
This next daily line chart for the HUI shows the massive H&S top that led to the five year bear market and the double bottom that ended the bear market. Note how the apex of the blue triangle showed resistance on the initial hit at 235 which then led to the decline to the lower S&R line at 208 or so. This may be a good place to see some ping pong action take place between 235 and 210 which may end up forming some type of consolidation pattern which would be healthy. The 200 day moving average is still pretty low but it has turned up strongly. This chart also gives you a feel for the magnitude of this impulse move up.

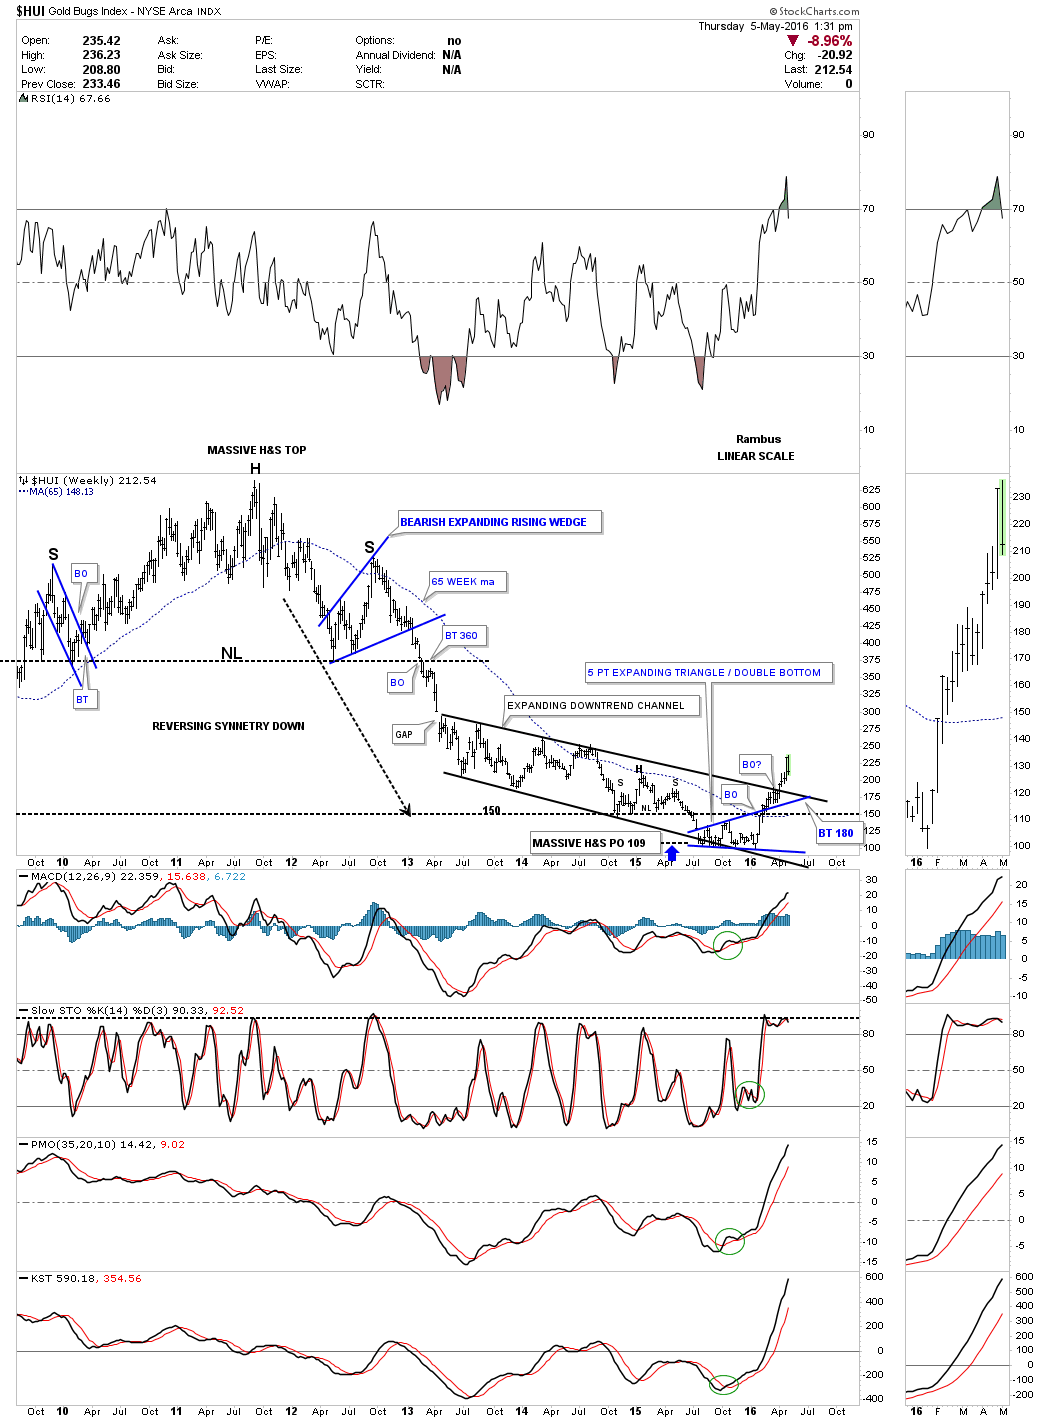
The weekly chart below shows what I would consider to be the worst case scenario which would be a complete backtest to the top rail of the black expanding downtrend channel and the top rail of the blue expanding triangle reversal pattern at 180 or so. The 180 area would also represent a fib 38% retrace of this first impulse move up. Will the HUI go that low? I don’t know but I’m prepared mentally if it does.