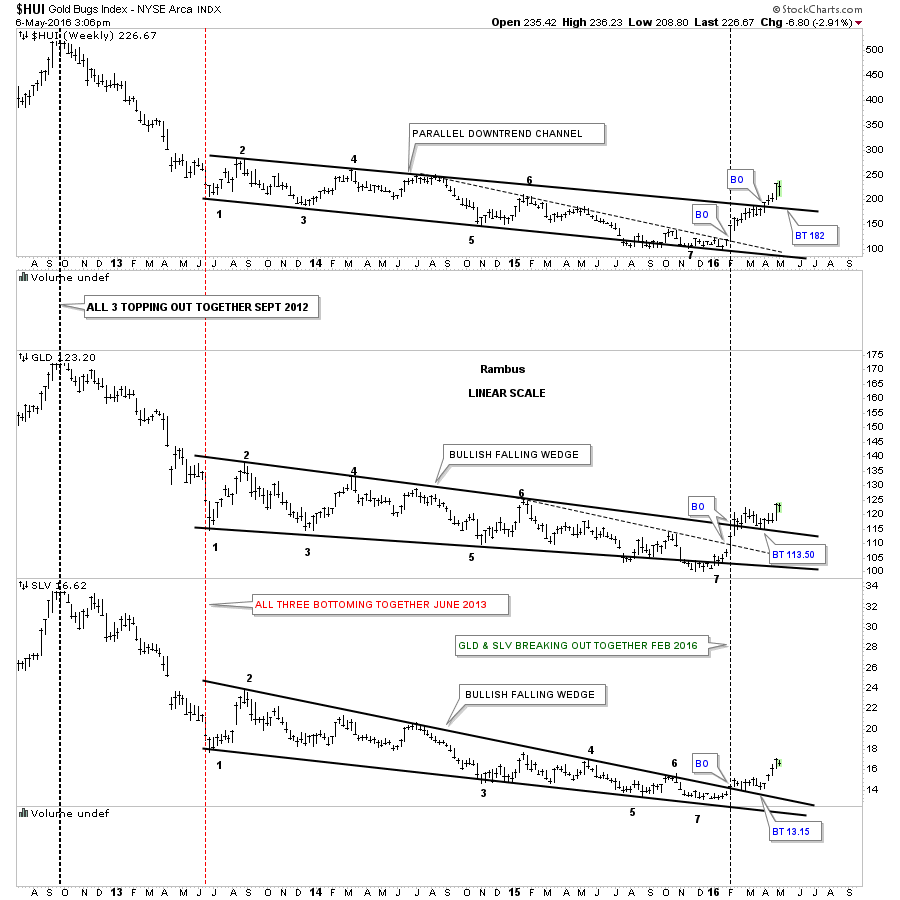
Below is a long term weekly chart we’ve been following which shows the breakouts and backtesting that have been going on for several months with gld and slv, and just 5 weeks or so for the HUI. This big picture look from 35,000 feet shows how infant this new bull market is right now. It was basically born back in January of this year and is just opening its eyes. What we want to see now is a higher high in the coming days and weeks.