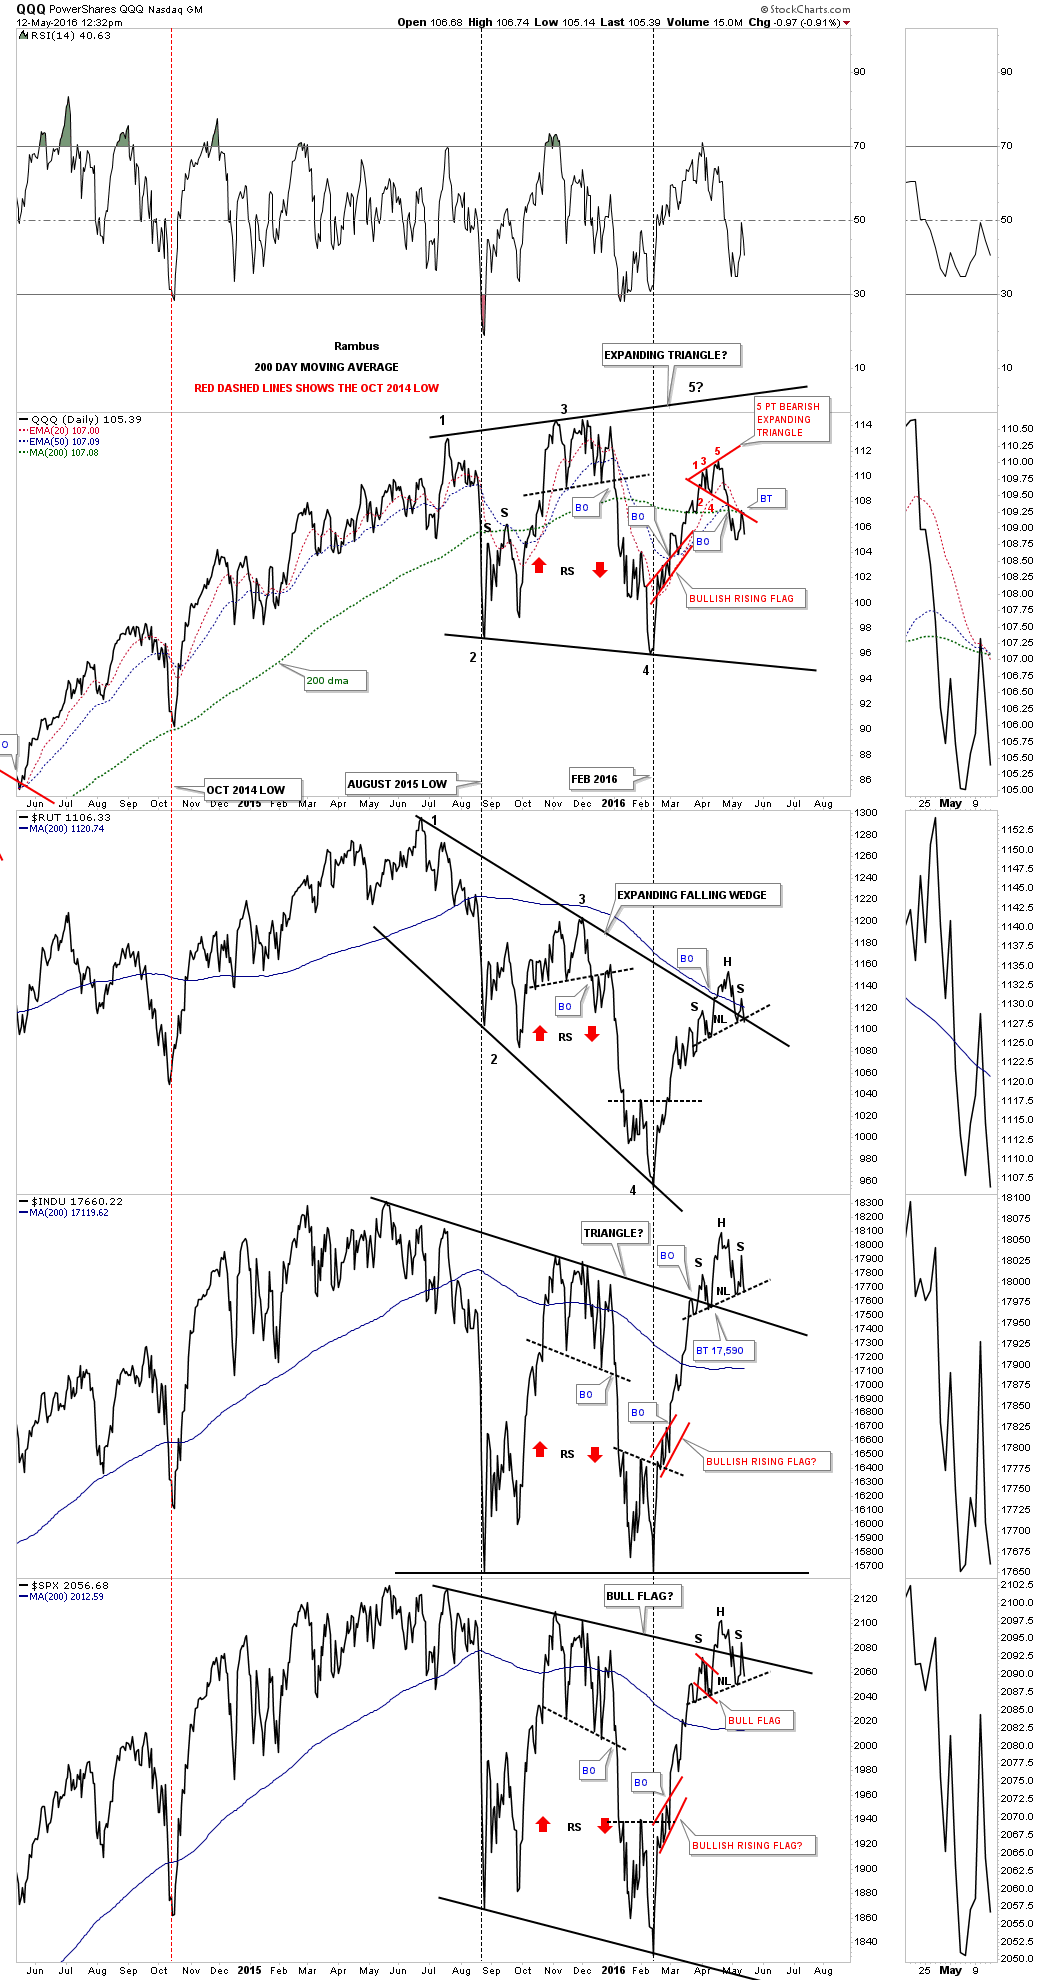
Below is the daily line combo chart we’ve been follow for quite awhile now which has four of the US stock markets on it. A week or two ago I posted this chart which was showing a possible H&S top forming on the INDU and the SPX. I drew in a horizontal neckline for starters because there wasn’t a right shoulder arm pit yet. I haven’t tweaked the possible necklines yet so you can see how this potential H&S top is building out. Thee QQQ on top shows the red expanding triangle which broke down with the bottom rail getting backtested earlier this week. The RUT is still inter acting with the top rail of the black expanding falling wedge and the bottom rail of the red rising flag that has completed seven reversal points with a false breakout above the top rail.
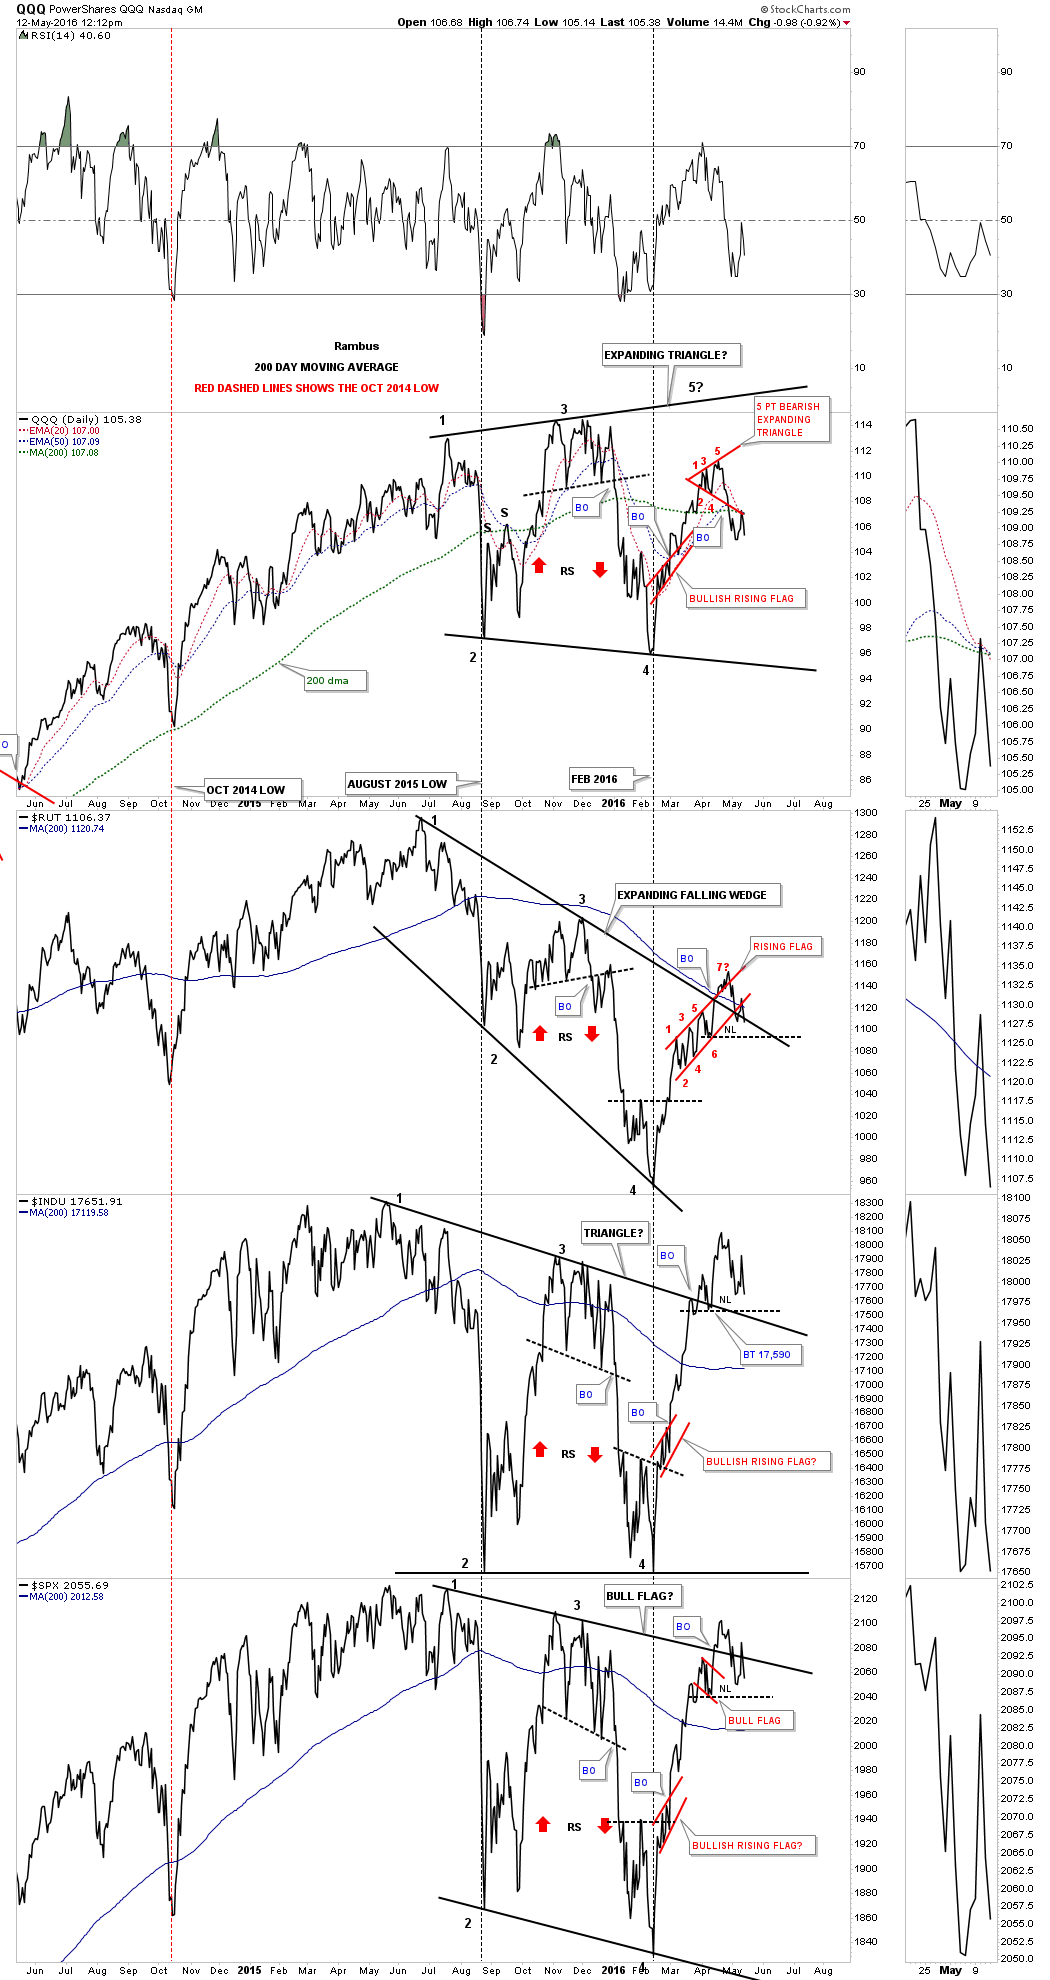
Below is the now updated combo chart which is showing the RUT, INDU and the SPX forming a H&S top with all three testing the neckline at the moment. The potential H&S tops all formed above the top rail of their bigger one year black falling patterns which would now show a false breakout. To get bullish again I would have to see the price action trade back above the right shoulder high. Until that happens a defensive posture is warranted.