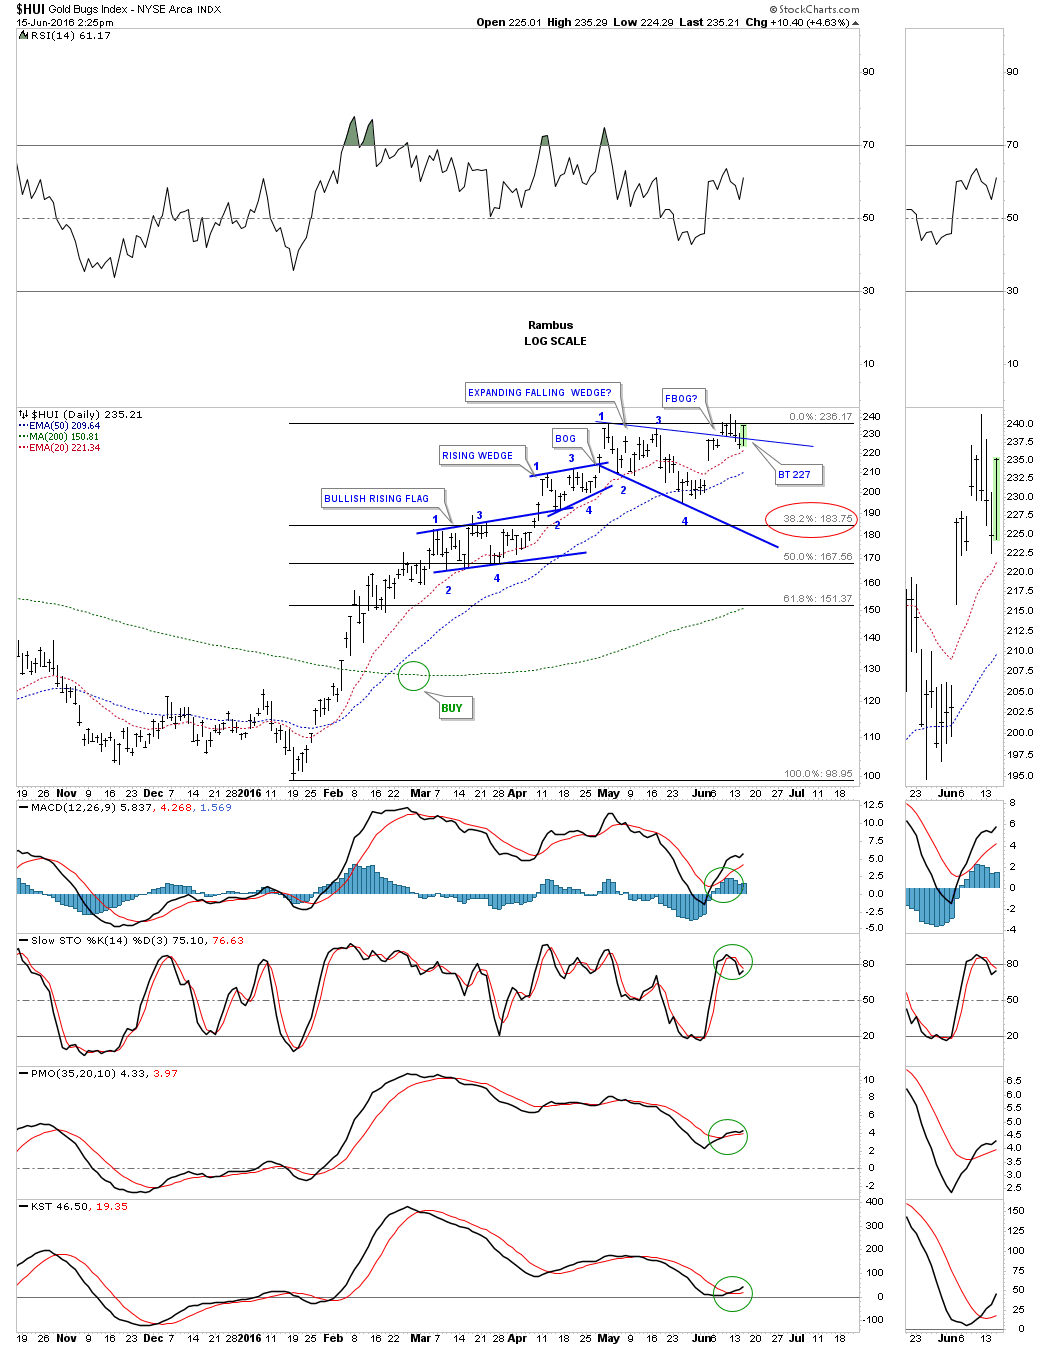
Surprises in a new bull market come to the upside. Below is the daily chart we’ve been following for the HUI which shows the top rail of the blue expanding falling wedge being broken to the downside yesterday. We are still not of the woods just yet as we need to see the HUI take out the previous highs but this is a positive development.
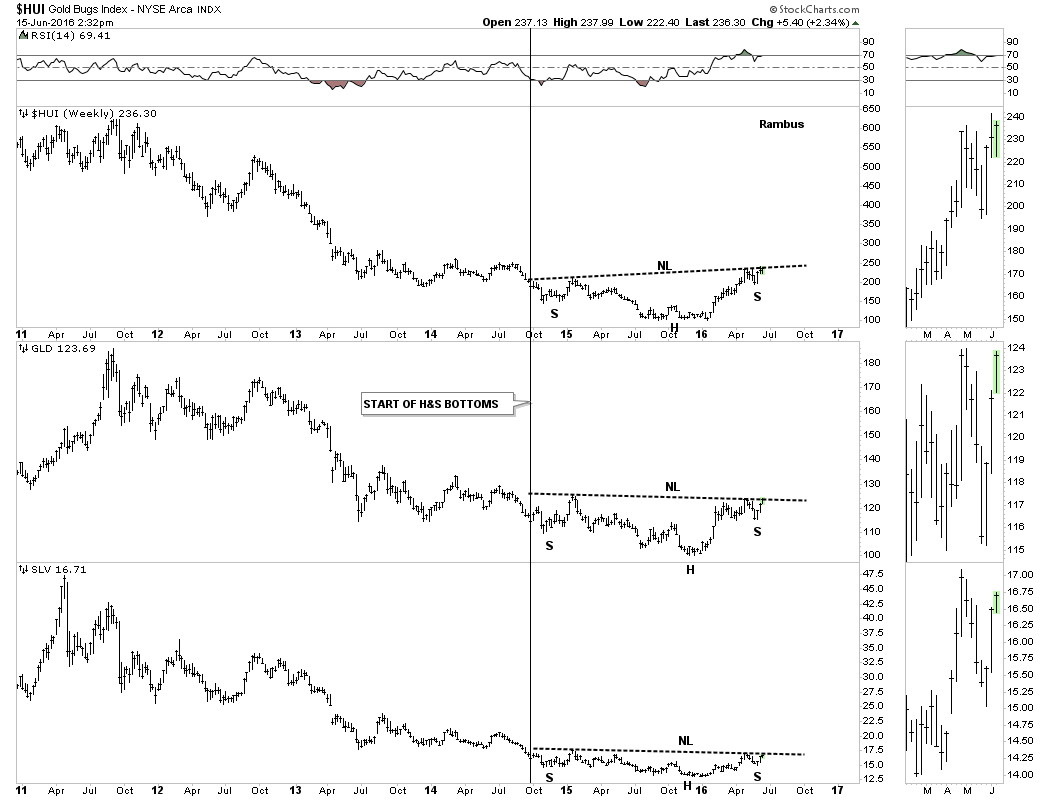
The combo chart shows all three testing the underside of their respective necklines. To breakout above their necklines that would create a higher high which is what we want to see.
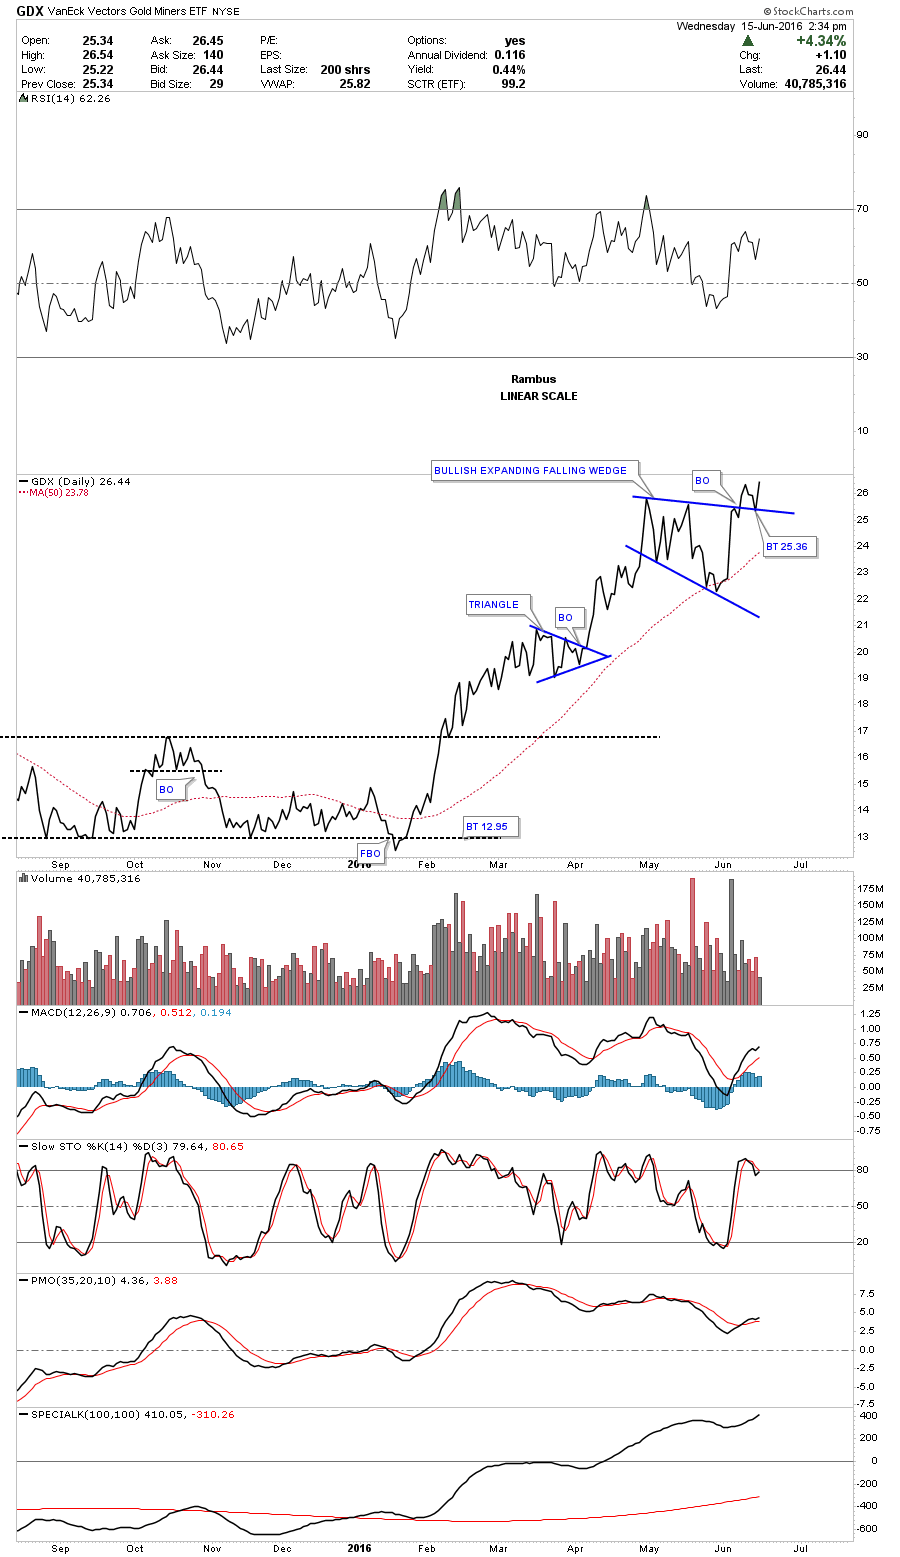
Below is a daily line chart for GDX which shows the backtest held on a daily closing basis. So far so good.
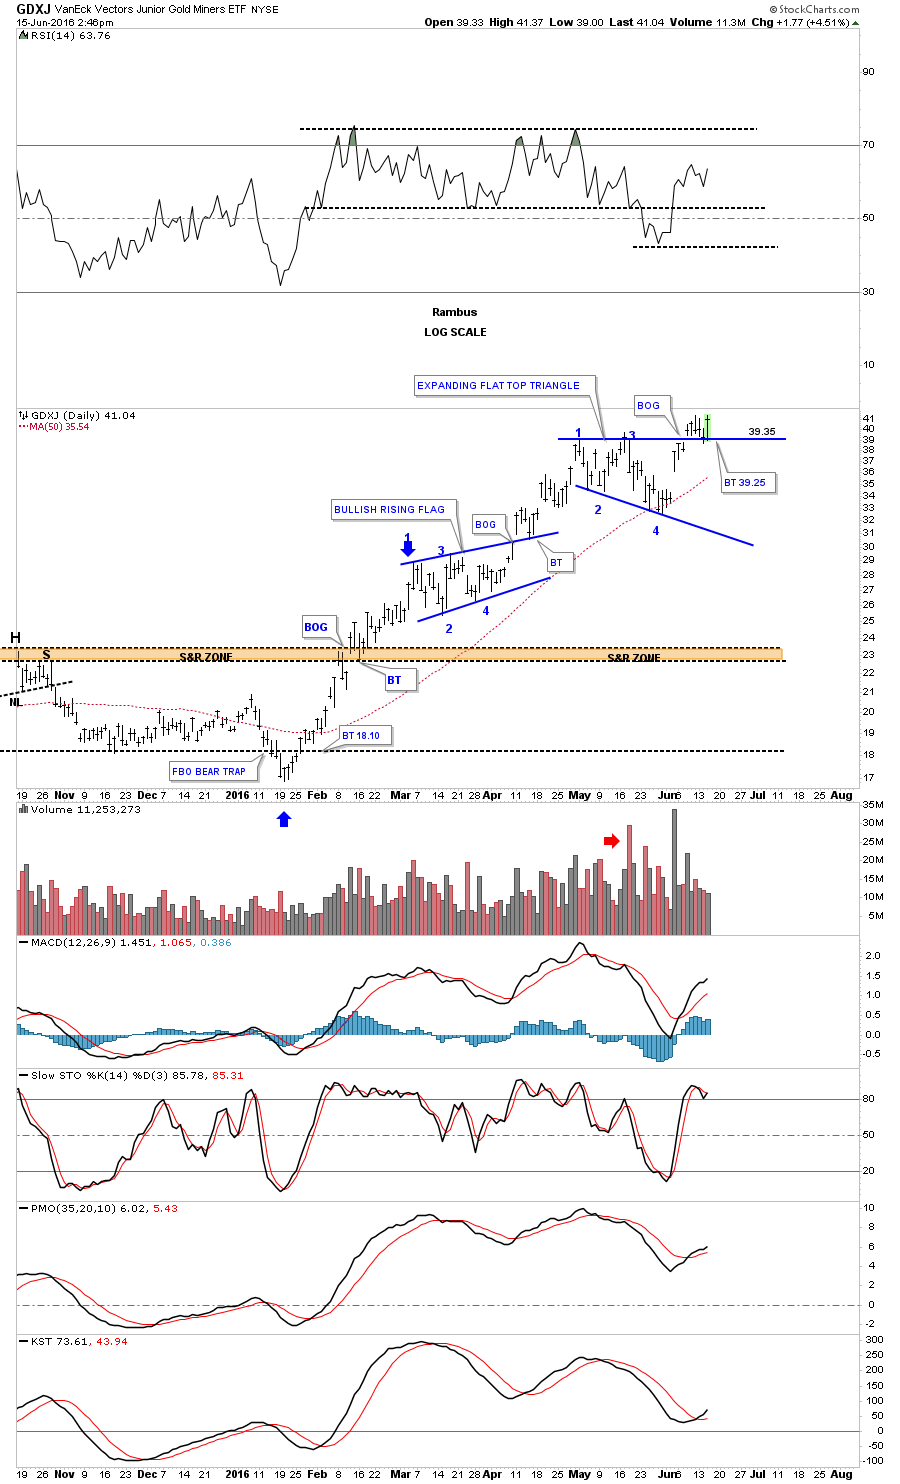
The daily chart for the GDXJ shows an expanding flat top triangle. I could have connected the top rail to reversal points one and three which would have given me an up sloping top rail. The reason I didn’t do that is because of where the breakout gap occurred and how the backtest to the horizontal top rail fits the pattern better. It’s always important to tweak your charts when you have new information to work with.
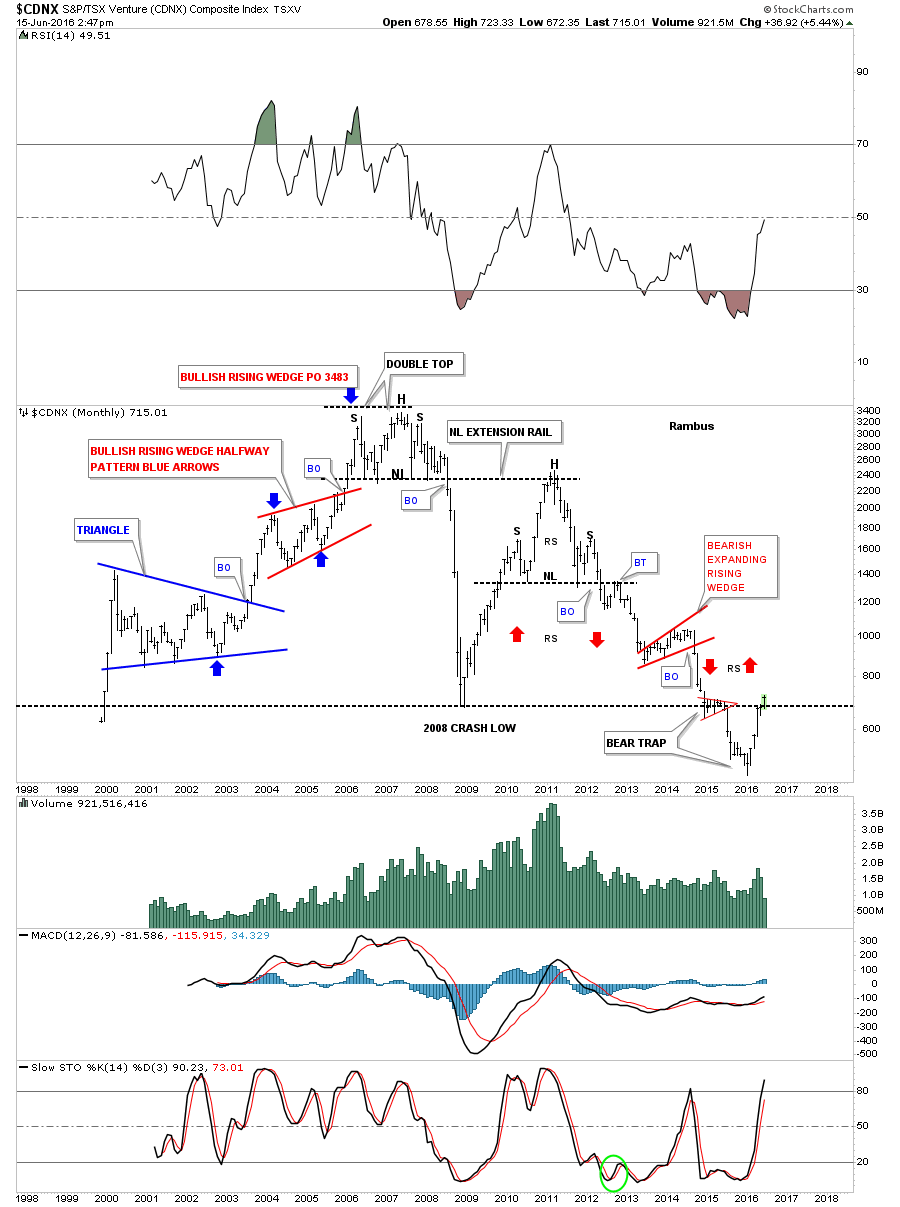
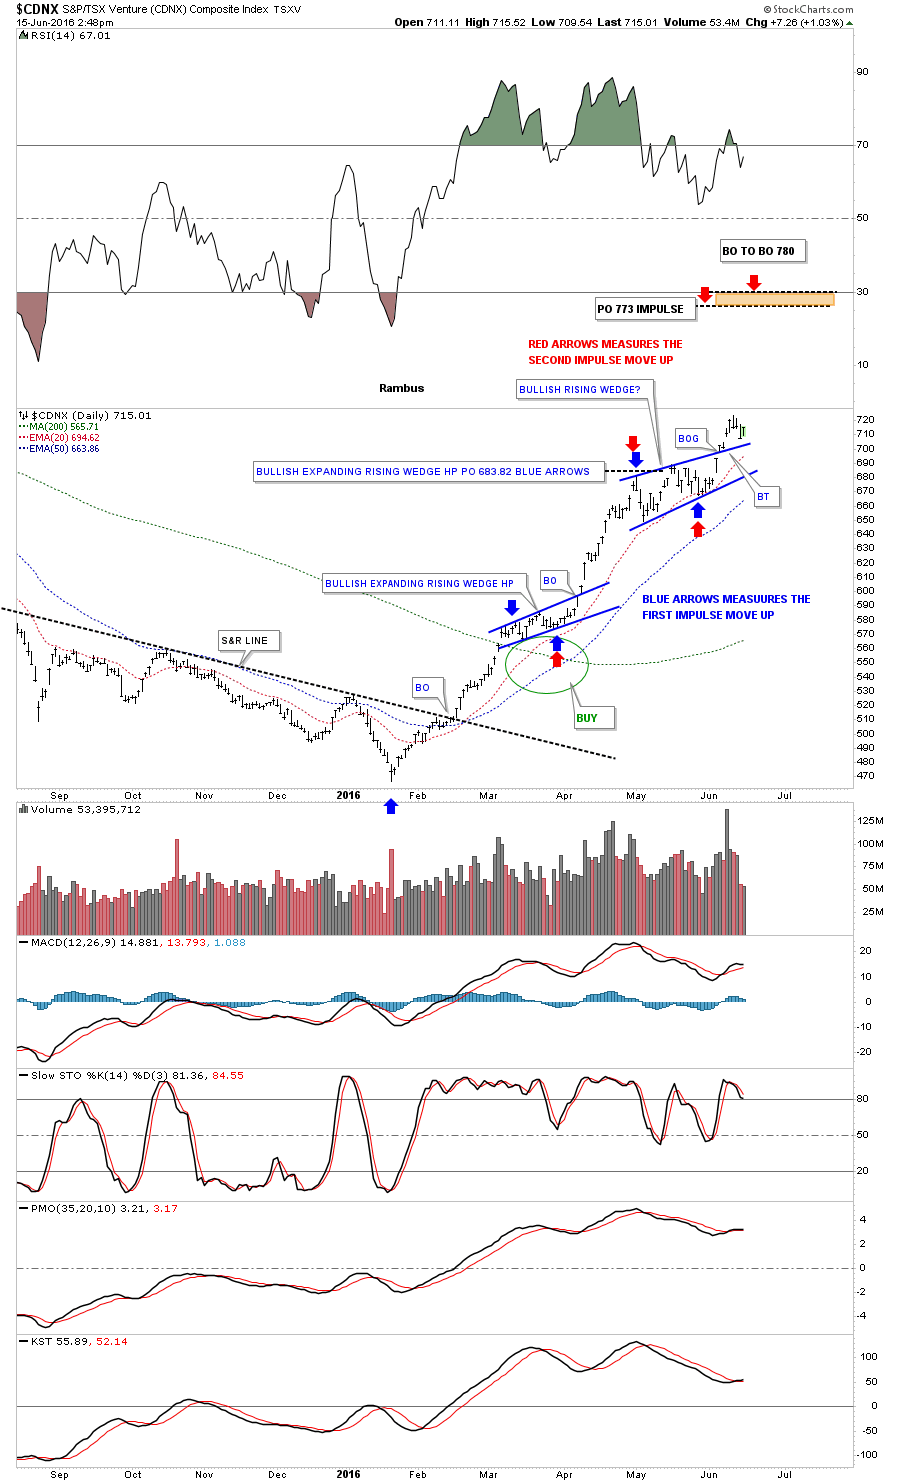
The CDNX has been leading the US precious metals stock indexes even though it’s not entirely made of small cap PM stocks. One thing I like about his index is that it’s showing speculative money flowing into the markets in general. When money is flowing into the small caps, investors are looking for a bigger bang for their buck which is positive overall.
The monthly chart for the CDNX shows it has finally broken back above the 2008 crash low which is a big deal.