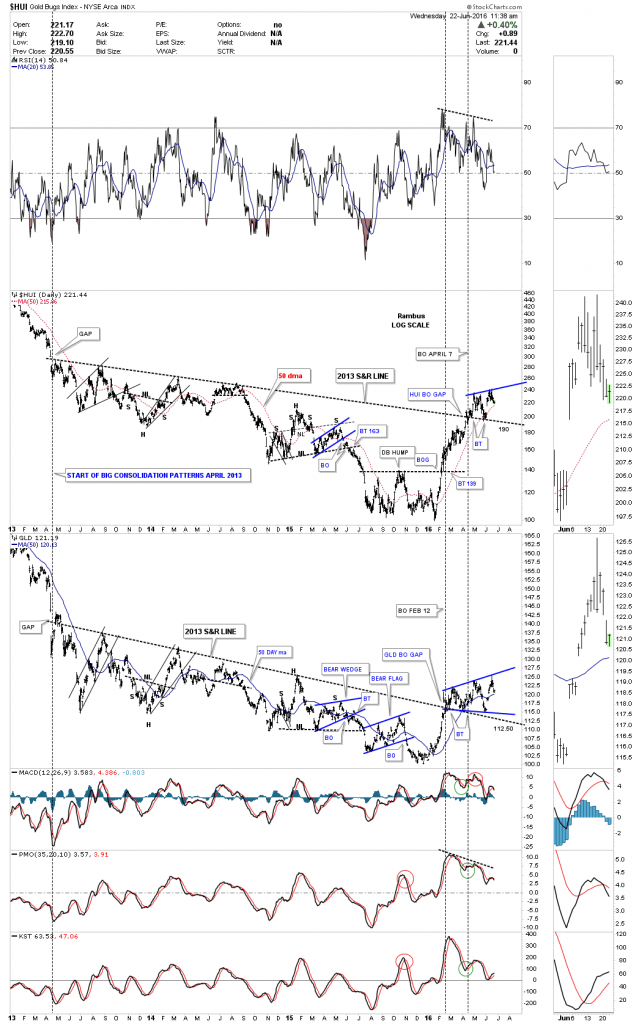
It’s been awhile since we last looked at this combo chart which has the HUI on top and GLD on the bottom. I’ve labeled the most important trendline on this chart, the 2013 S&R LINE. That most important S&R line separates the bear market from the bull market. The black dashed vertical line on the left side of the chart shows where they both made a big gap down to start the three year S&R lines.The right side of the chart shows where the HUI and GLD broke back above that three year S&R line with GLD doing it in February and the HUI two months later in April of this year.
Think of the 2013 massive S&R line as your line in the sand. Knowing there is such an important line in the sand should make it much easier for you to ride out the chopping action that is inevitable. There is always pain in the markets because nothing ever goes straight up or down for that matter. That is one thing each and every investor has to deal with in their own way. This is my game play for the PM stocks I own and I expect some pain along the way.
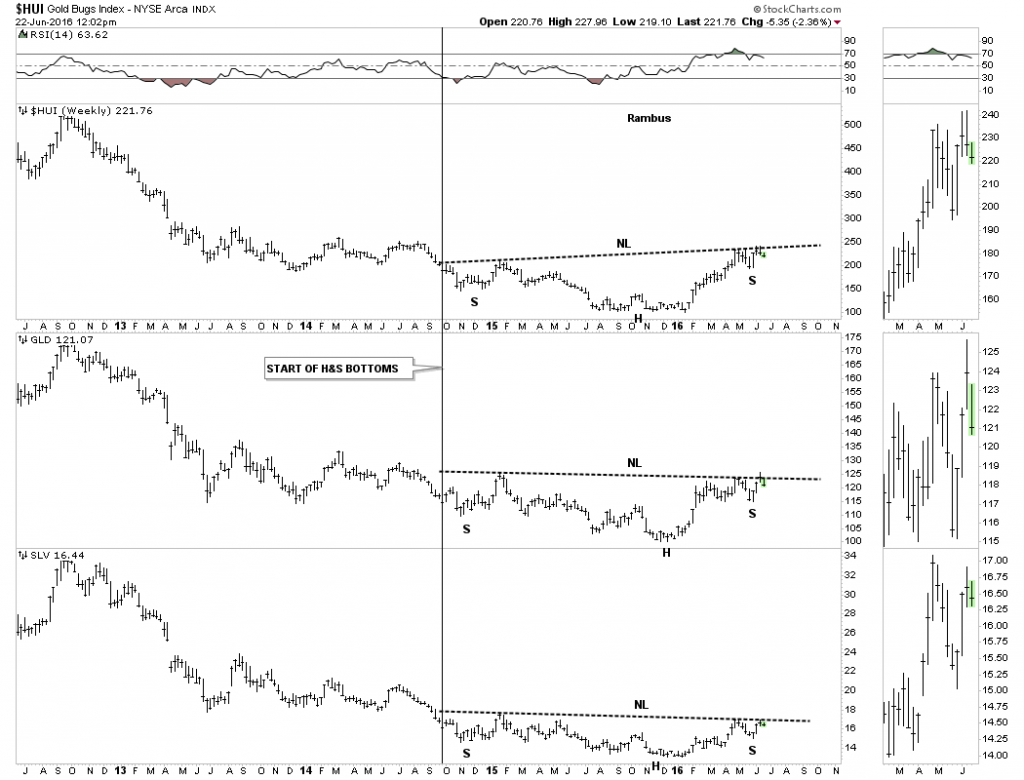
This next chart is a combo chart which shows the three H&S bottoms for the HUI, GLD and SLV. Last weeks price action was very positive as it confirmed for me the necklines are properly placed by the way these three were tested again, for the second time, building out their right shoulders. We now know where support lies on the combo chart above and we now know where resistance is to be found on the chart below. Knowing where you’re at, at any given time, is important to know as it will easy some of the psychological baggage that affects everyone trading the markets.


