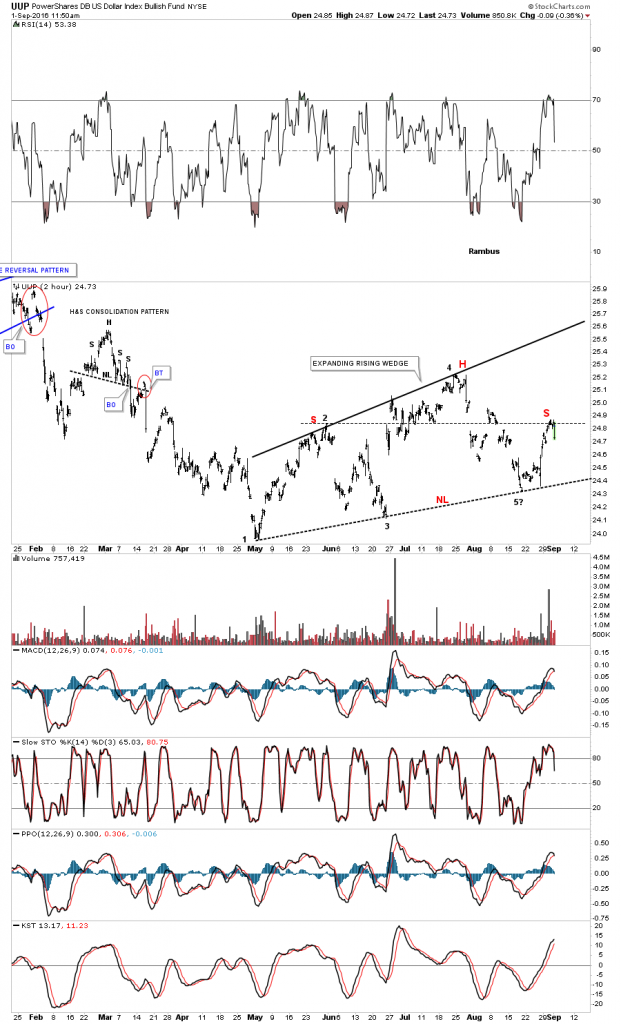
The other day I showed you this 2 hour chart for the UUP (US Dollar ETF) which had completed an expanding rising wedge pattern when the price action hit the bottom rail at 5? which completed the pattern. The pattern was completed at that time but we still don’t know if it will be a consolidation pattern to the downside or if the UUP can rally back up and through the top rail which would make it a 5 point reversal pattern to the upside as it has formed in the downtrend.
I speculated on a possible H&S pattern forming inside the expanding rising wedge drawing a horizontal line from the top of the left shoulder to the right side of the pattern, looking for a possible high for the right shoulder using the red letters to make it easier to see what I was trying to convey. So far that possible high for the right shoulder is still in play. If and it’s still a big if yet, if the H&S neckline / bottom rail of the expanding rising wedge gets broken to the downside, we’ll have two consolidation patterns in one.
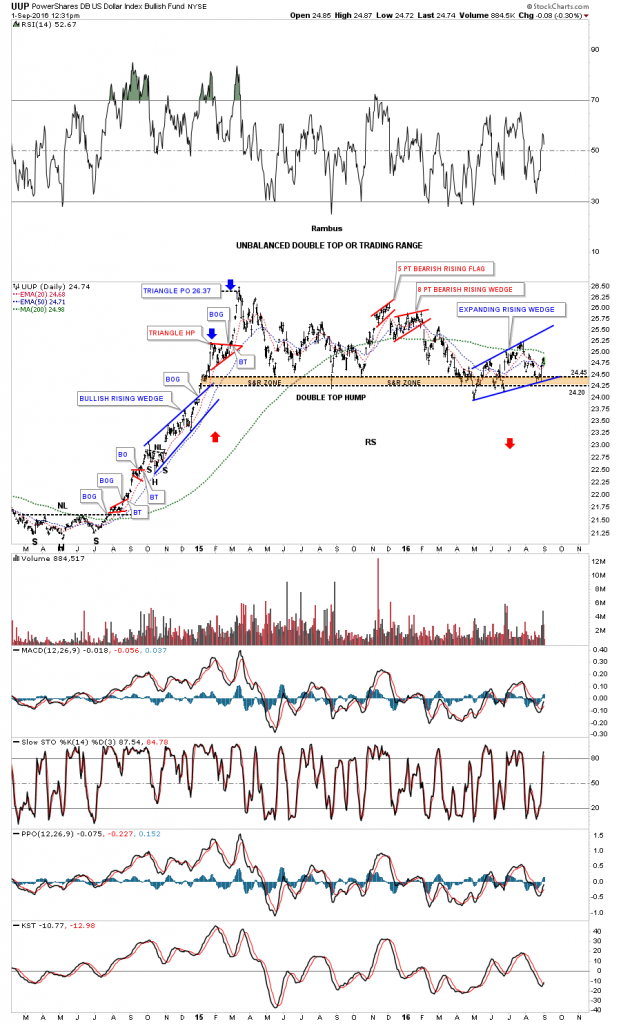
The daily chart for the UUP shows why this potential expanding rising wedge / H&S pattern is so critical to the big picture. As you can see the combo pattern has formed right on top of the brown shaded S&R zone. For those folks that have been with us for several years will remember when the US dollar finally broke out of the multi year base and began that very strong impulse move up which you can see on the left side of this daily chart.
During that strong impulse move up all the important currencies of the world along with most commodities got taken to the woodshed for a beating. As we’ve seen in the past, when you see a consolidation pattern pointing in the same direction of the trend and not against it, that is usually a very good indication you’re in a strong impulse move. Note the blue bullish rising wedge that formed during the 2014 – 2015 impulse move up.
What makes our present situation so interesting is that if the combo expanding rising wedge / H&S pattern turns out to be a consolidation pattern, then we can expect to see a strong move down over the same area during that strong impulse move up in 2014 – 2015 as show the red arrows which I call reverse symmetry. Why that would be so important is because we should see the currencies and commodities, that were affect by the US dollar on the way up, should now see them move inversely to the US dollar which would be up as the US dollar goes down.
Keep in mind the current pattern is still building out for the UUP with no confirmation yet on which way the eventual breakout may occur but we have something tangible to keep a close eye for more clues that will eventually show us the way.


