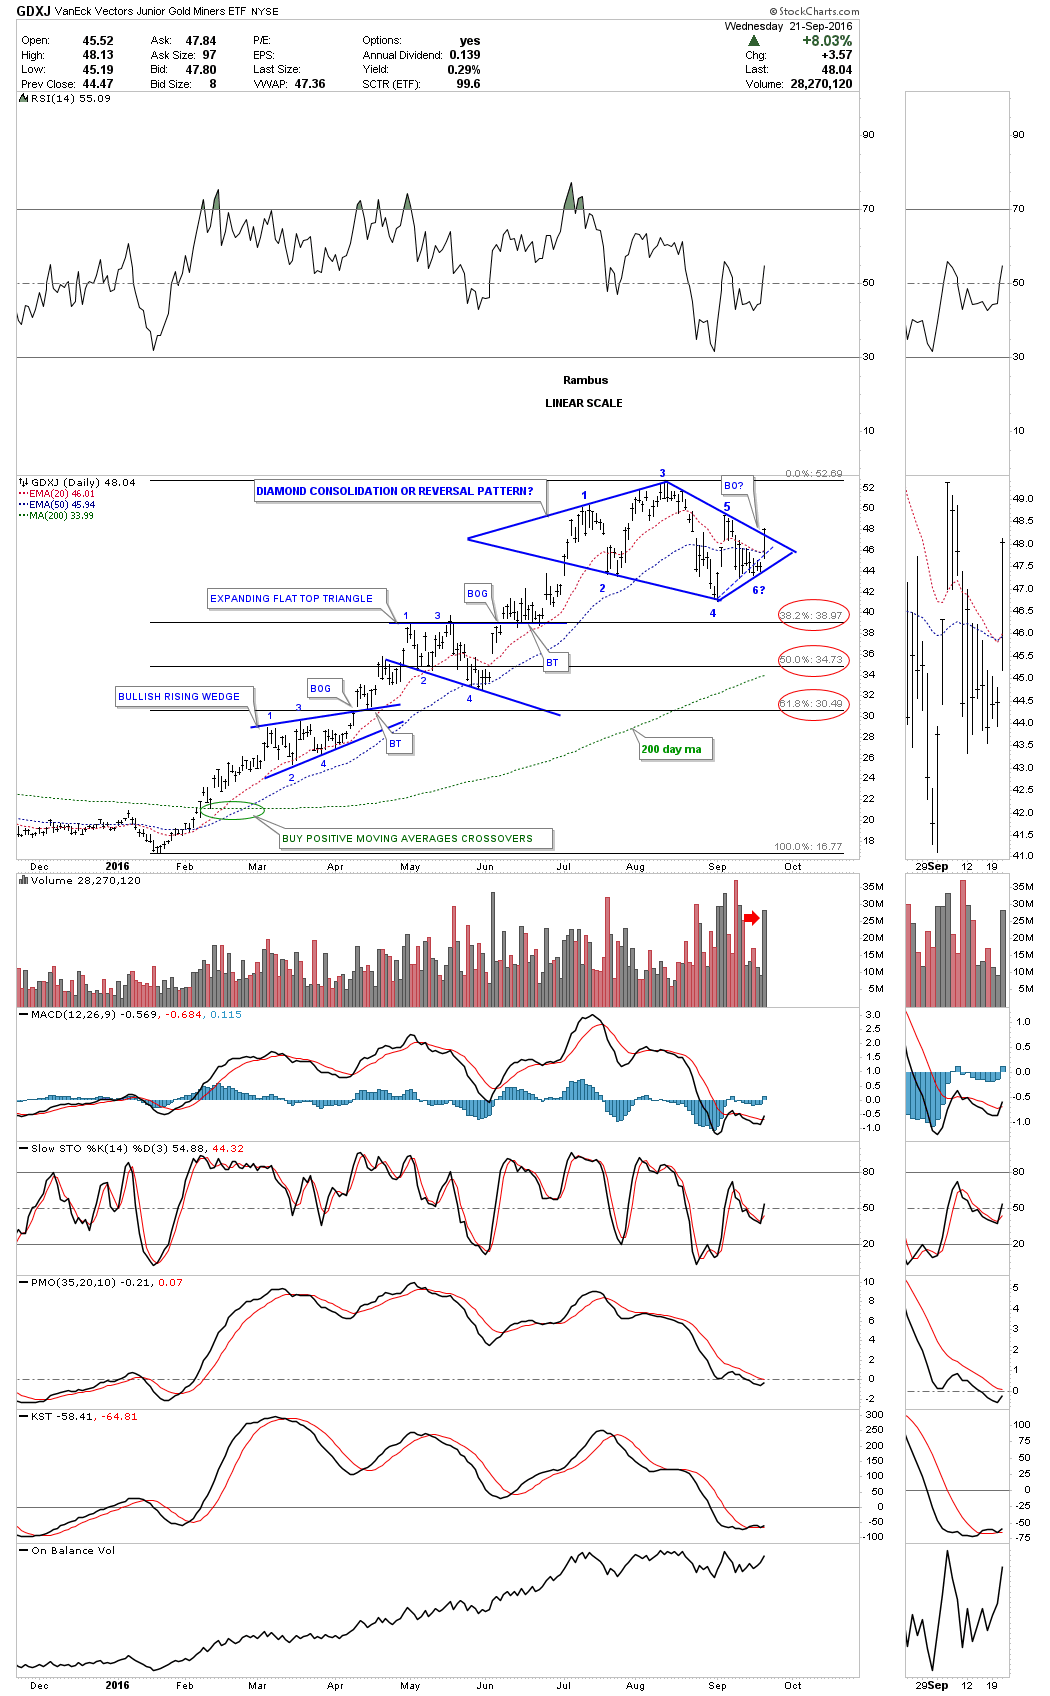
Below is the daily chart for the GDXJ which shows the diamond trading range that has been building out since the first of July. For three days the price action traded below the bottom rail which is shown by the thin blue dashed line. This morning the GDXJ gapped above the blue dashed rail and the 20 and 50 day ema’s and closed the day above the top rail, which now shows a six point diamond which is a consolidation pattern instead of reversal pattern. Sometimes it’s a fine line. We’ll get more confirmation if we see the GDXJ trade above the 5th reversal point making a higher high along with a higher low.
The diamond is still the valid chart pattern and with a completed 6th reversal point it becomes a consolidation pattern. There was also heavy volume today. The 20 and 50 day ema’s are now kissing. It’s always nice to see the price action trading above those two important daily moving averages on a closing basis.