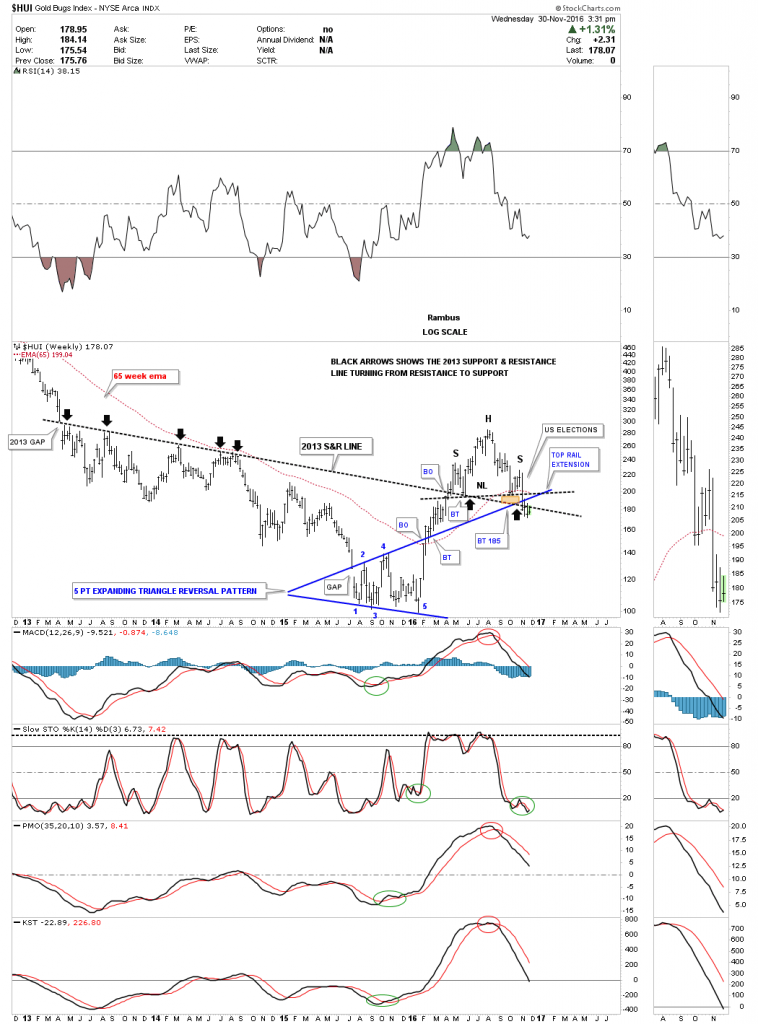
I’ve been showing you this long term weekly chart for the HUI which shows the all important 2013 support and resistance line. As you can see it held resistance as shown by the black arrows pointing down. Then back in the spring the HUI broke out above the 2013 S&R line with a nice clean backtest which was a very bullish setup. Once broken to the upside the S&R line should reverse its role to support which it did until four weeks ago when the neckline gave way after the US elections.
Note the big long bar that formed during the breakout from the H&S top. That breakout move not only took out the neckline it also took out the 65 week ema, the 2013 support and resistance line and the top rail of the five point expanding triangle reversal pattern that reversed the bear market. Note how the top rail extension line from the expanding triangle and the 2013 S&R line have now been working as resistance over the last four weeks. Anything is possible in the markets, but when you see critical support being taken out like this you don’t have to be a hero and try to catch a falling knife so you can claim you called the bottom. JMHO.

