I actually wrote this post yesterday but got busy and forgot to post it.
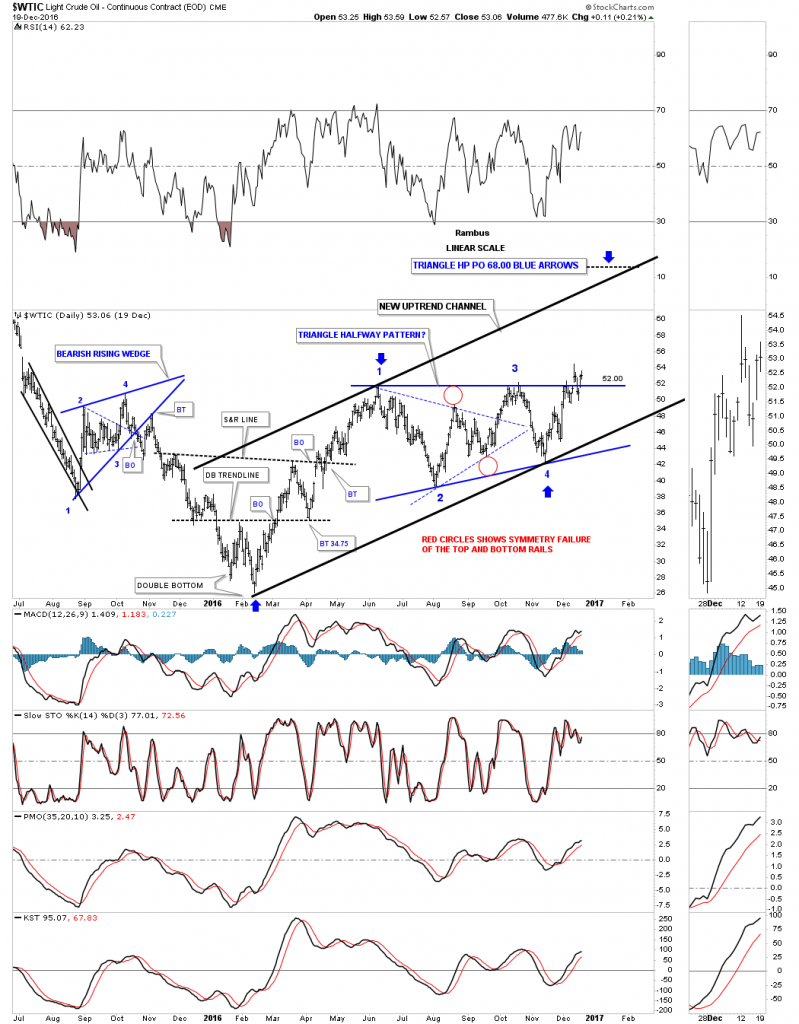
The $WTIC is still in the process of breaking out and backtesting top rail of the blue morphing triangle consolidation pattern which is also the possible neckline of an unbalanced H&S bottom. I wouldn’t like to see the price action take out the previous lows made earlier this month.
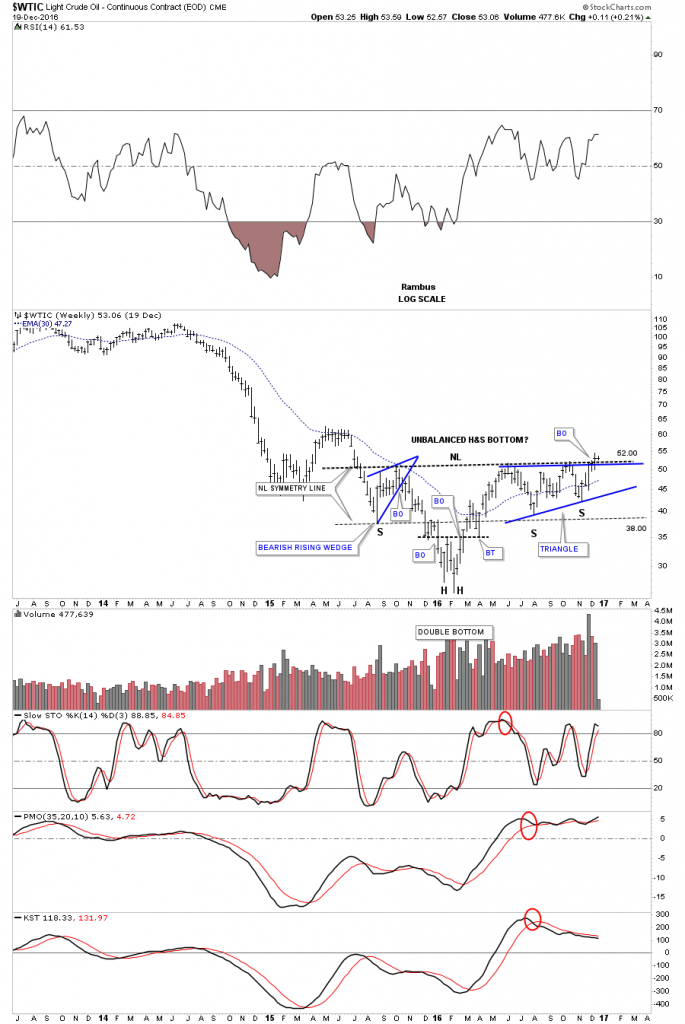
This next chart is a longer term weekly look which shows the possible unbalanced inverse H&S bottom with the blue morphing triangle forming the right shoulder. You can see from the size of the base oil can have a pretty big move to the upside. The bigger the base the bigger the move.
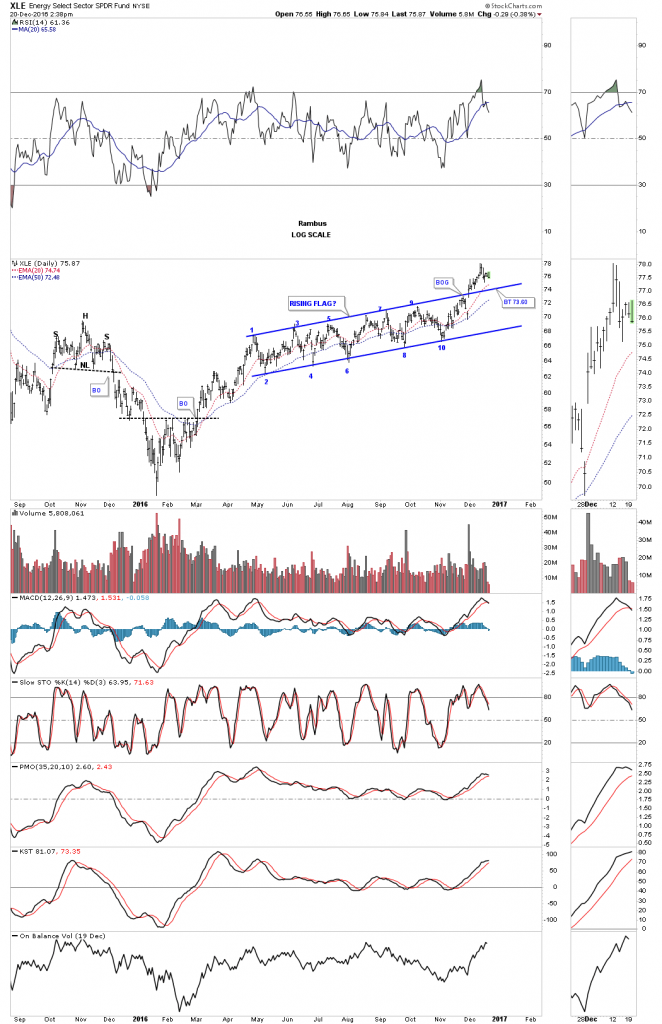
About three weeks ago the XLE broke out of a 10 point bullish rising flag on a nice increase in volume. It’s important for the top rail to hold support if there is a backtest at the 73.60 area.
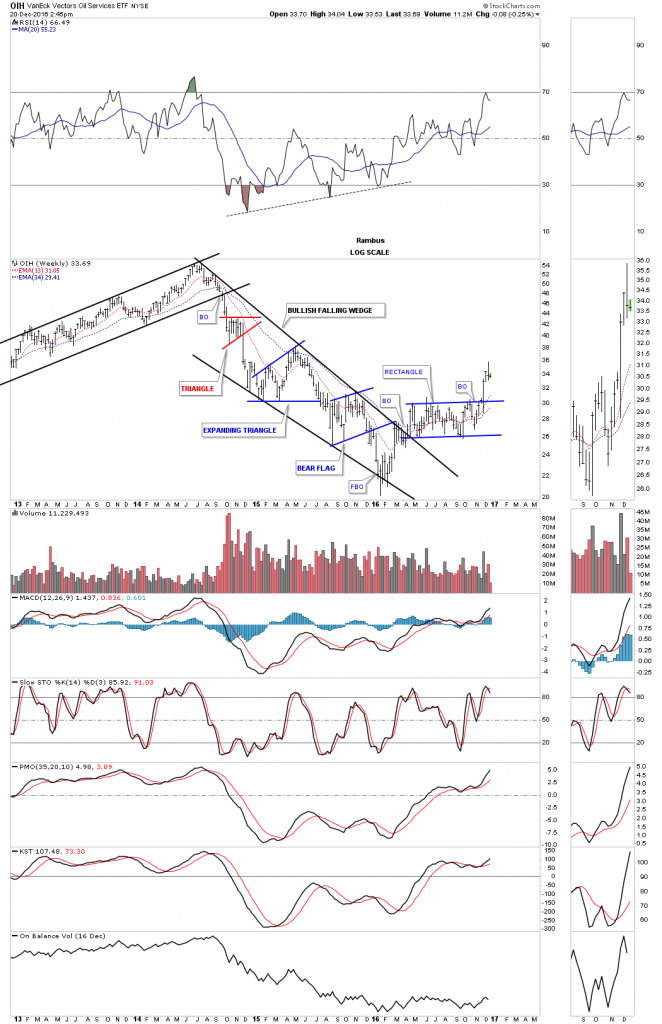
The OIH weekly chart.


