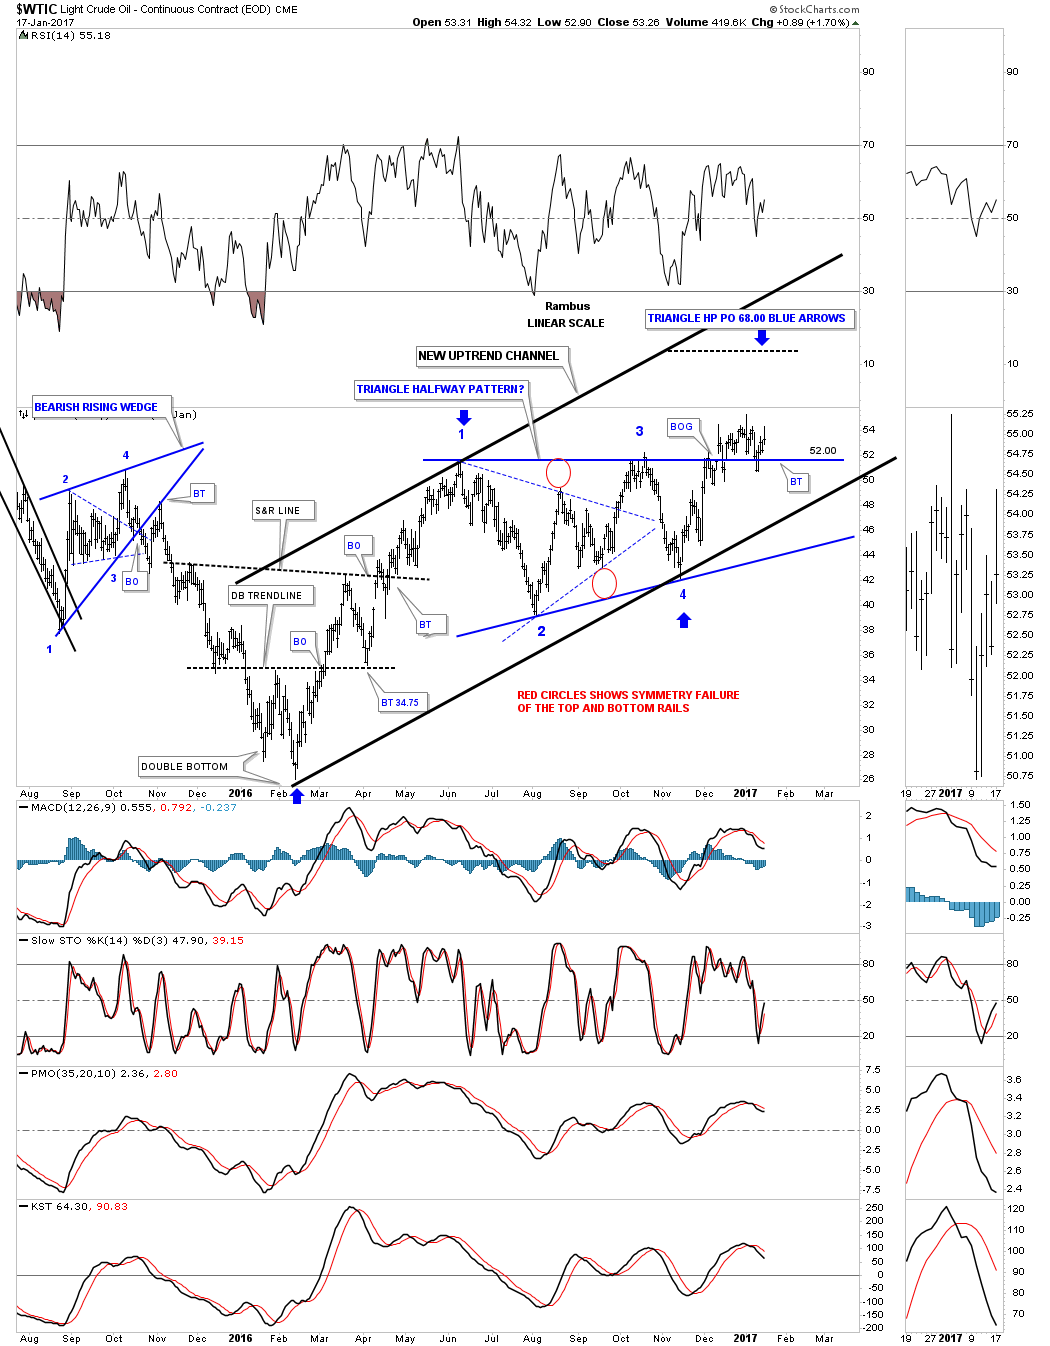
After breaking out from the large blue triangle the $WTIC has been in backtest mode since early December. So far the 52 area has been holding support with several touches from the topside. Normally when a pattern is strong the backtest will come quickly and the impulse move will begin in earnest. For almost 2 months now the backtest is laboring with the impulse move failing to take off. I’m viewing this as a warning sign at the moment.
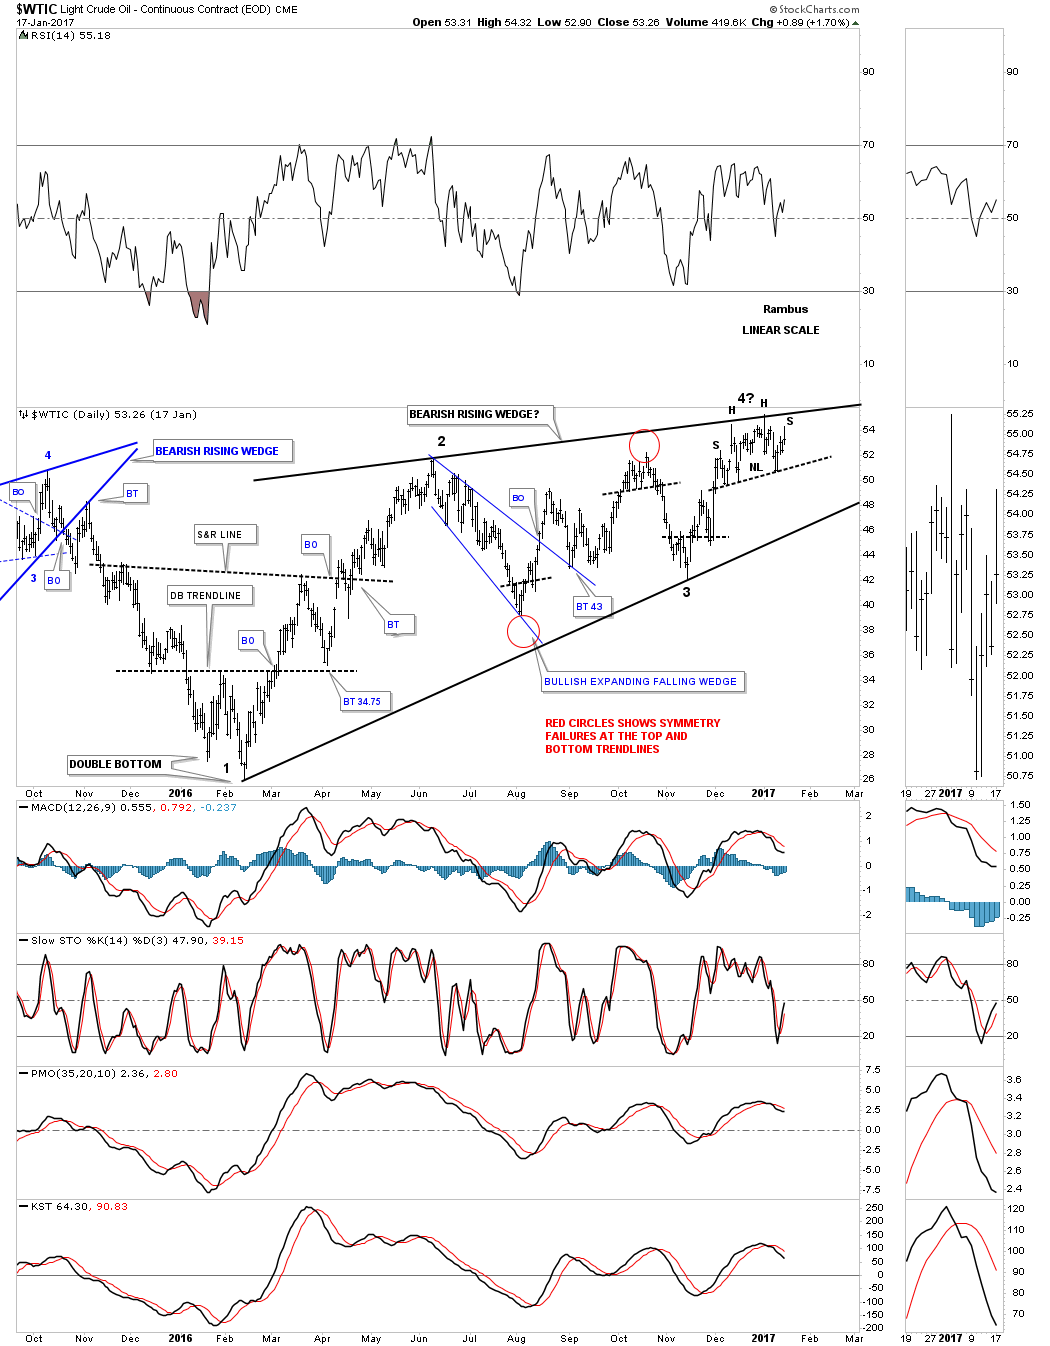
This next daily chart for oil shows what the breakout and backtest looks like from another perspective. The price action above the top rail on the blue triangle above, is showing a possible H&S top building out. If I adjust the top rail of the black uptrend channel on the weekly chart above, to the top of the potential H&S top we get a bearish rising wedge which has completed three reversal points so far with the H&S top being the start of the fourth reversal point to the downside. In big consolidation patterns there is usually some type of reversal pattern at the reversal points. If the neckline gets broken to the downside that will be a big clue that the bearish rising wedge is in fact a consolidation pattern and the blue triangle not a continuation pattern. A breakout below the bottom rail of the potential bearish rising wedge will be confirmation oil is going back down to the 2016 low.
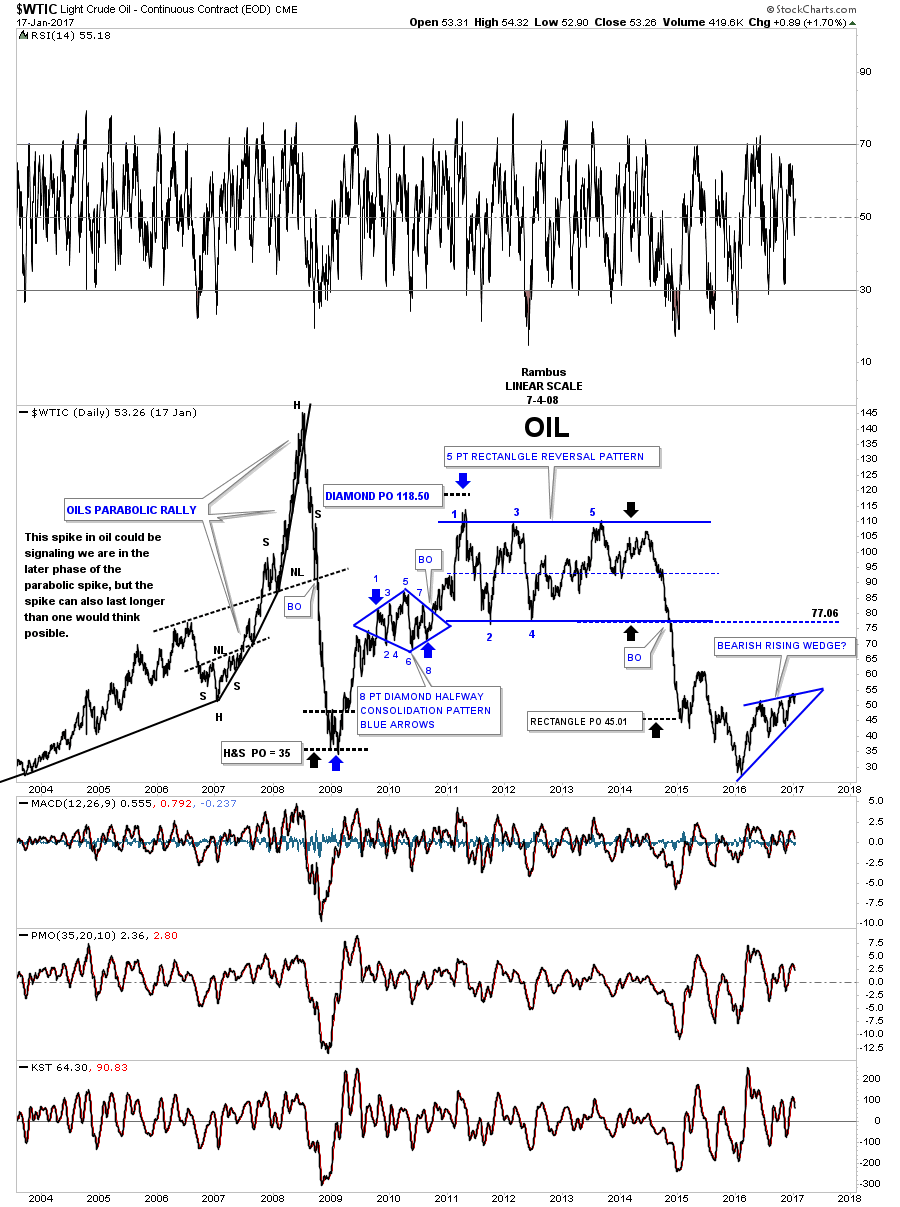
This next chart is a long term daily look at oil which puts the potential bearish rising wedge in perspective. Keep in mind the minimum price objective for a wedge is to the first reversal point which in this case would be the 2016 low.
If oil is truly building out a bearish rising wedge what is that telling us about commodities in general and the US dollar? I know most have given up on a bullish outcome for the US dollar which may be correct. Tonight in the Wednesday Report I’m going to post some charts on the US dollar that you haven’t seen yet. The US dollar is probably the most important chart to watch as it plays such a big role in many different markets.