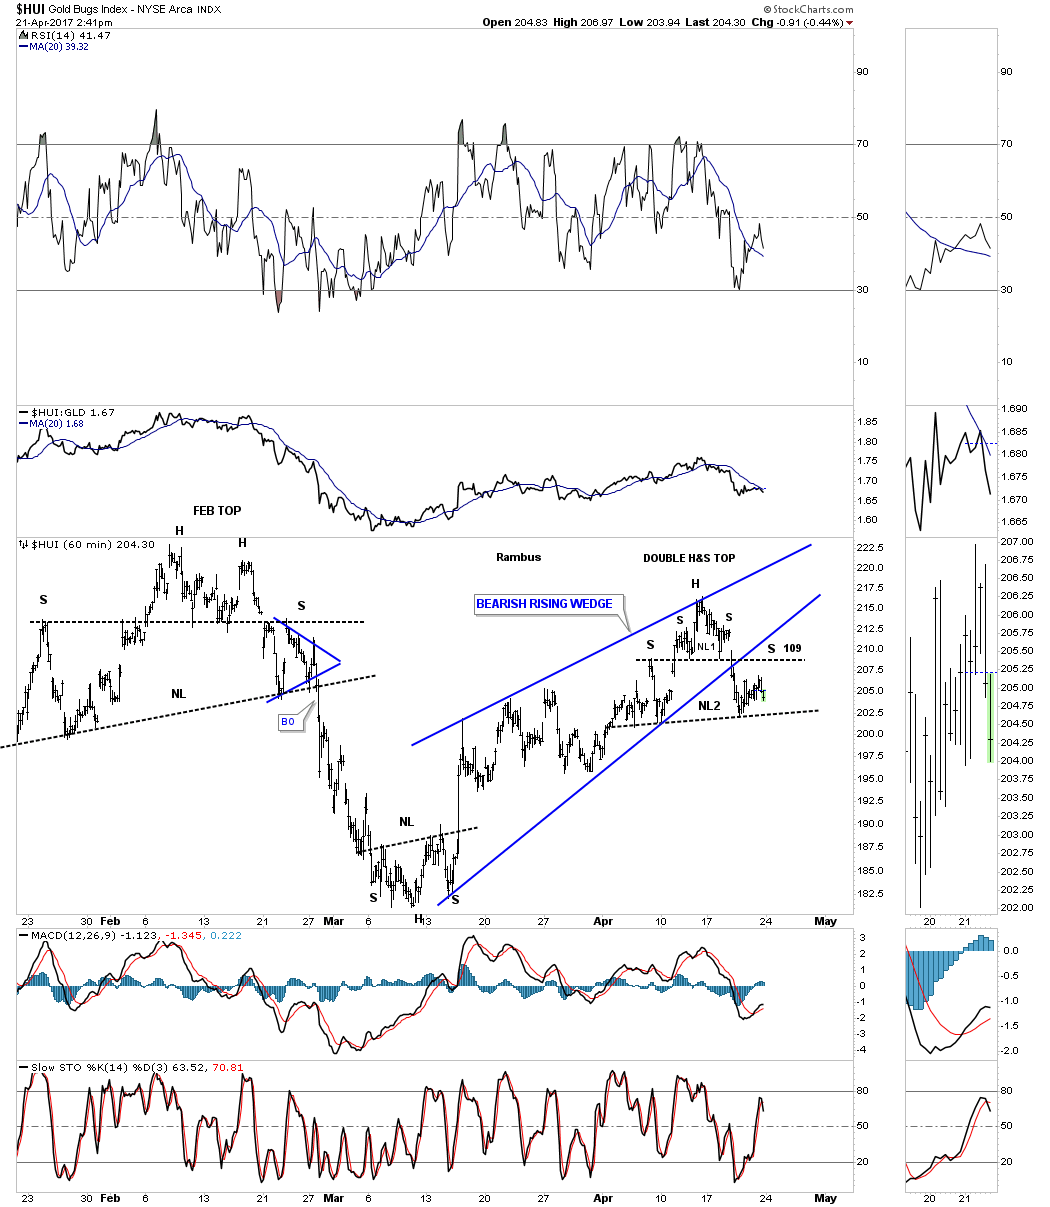
As you know reverse symmetry plays a key role on how I sometimes interpret chart patterns or impulse moves. Below is the 60 minute chart for the HUI which shows the bearish rising wedge with the small H&S top that showed itself yesterday. After gapping down below the neckline and the bottom rail of the rising wedge some type of backtest should be anticipated, but not always. As you can see both necklines are taken from inside the bearish rising wedge to create the right shoulders, a form of reverse symmetry. A complete backtest to neckline #1 would come in around the 209 area if we get one. The next bit of confirmation will be when the price action breaks below neckline #2 which will create a bigger H&S top. Many times with a bearish rising wedge you will see the left shoulder and the head form inside the rising wedge while the backtest to the underside of the rising wedge forming the right shoulder.
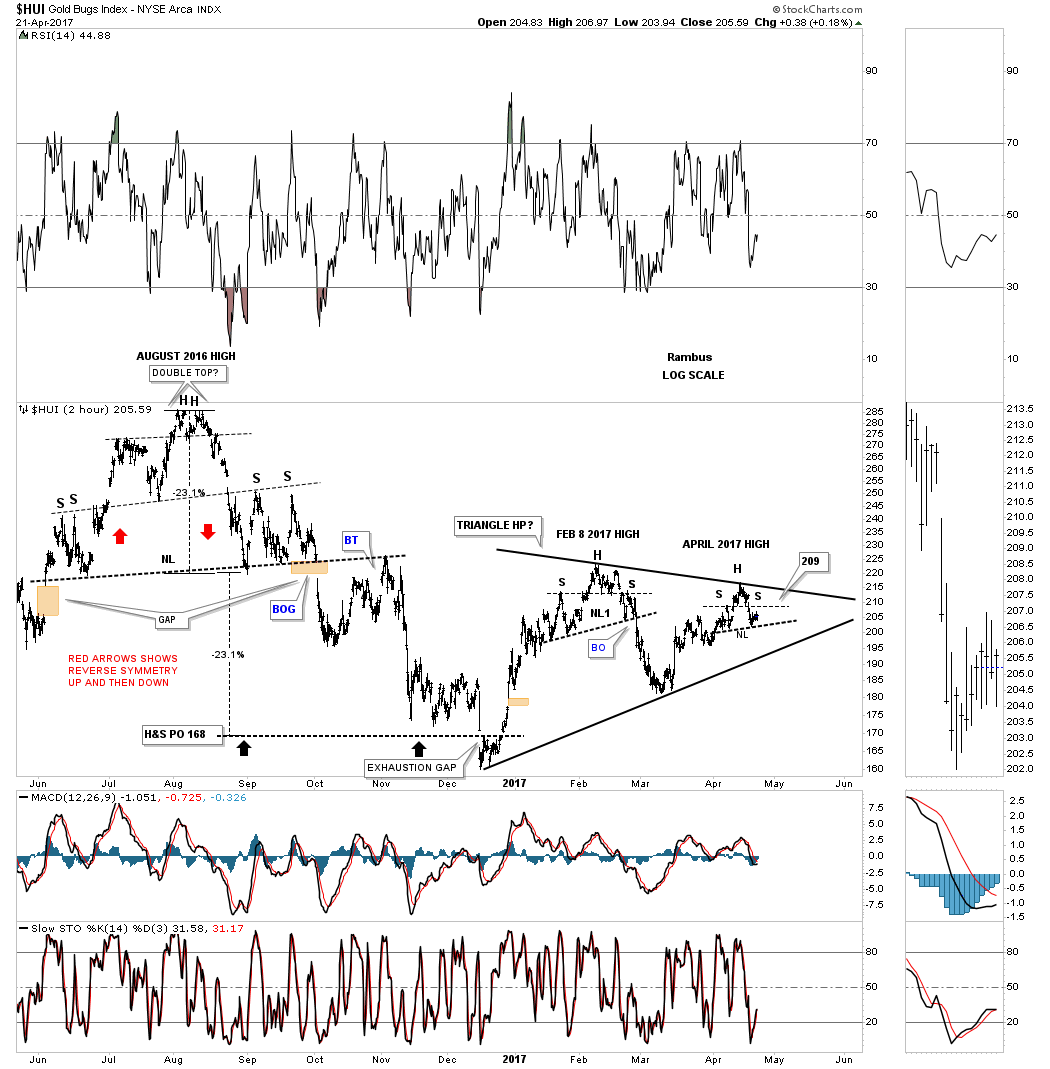
Below is another 2 hour chart for the HUI which shows the H&S top that formed at the August 2016 high. After declining down to the December 2016 low the HUI then rallied back up to the February high where it completed another H&S top to reverse the direction down into the March low. From that low we got another counter trend rally back up to the April high which now looks like another H&S reversal pattern is building out. The potential black triangle that is building out shows you the battle taking place between the bulls and the bears. As the battle continues both sides become exhausted, but whichever trend was in place before the consolidation pattern started will normally reassert itself again. That’s the basic principal for bull and bear markets only on a much larger time frame.
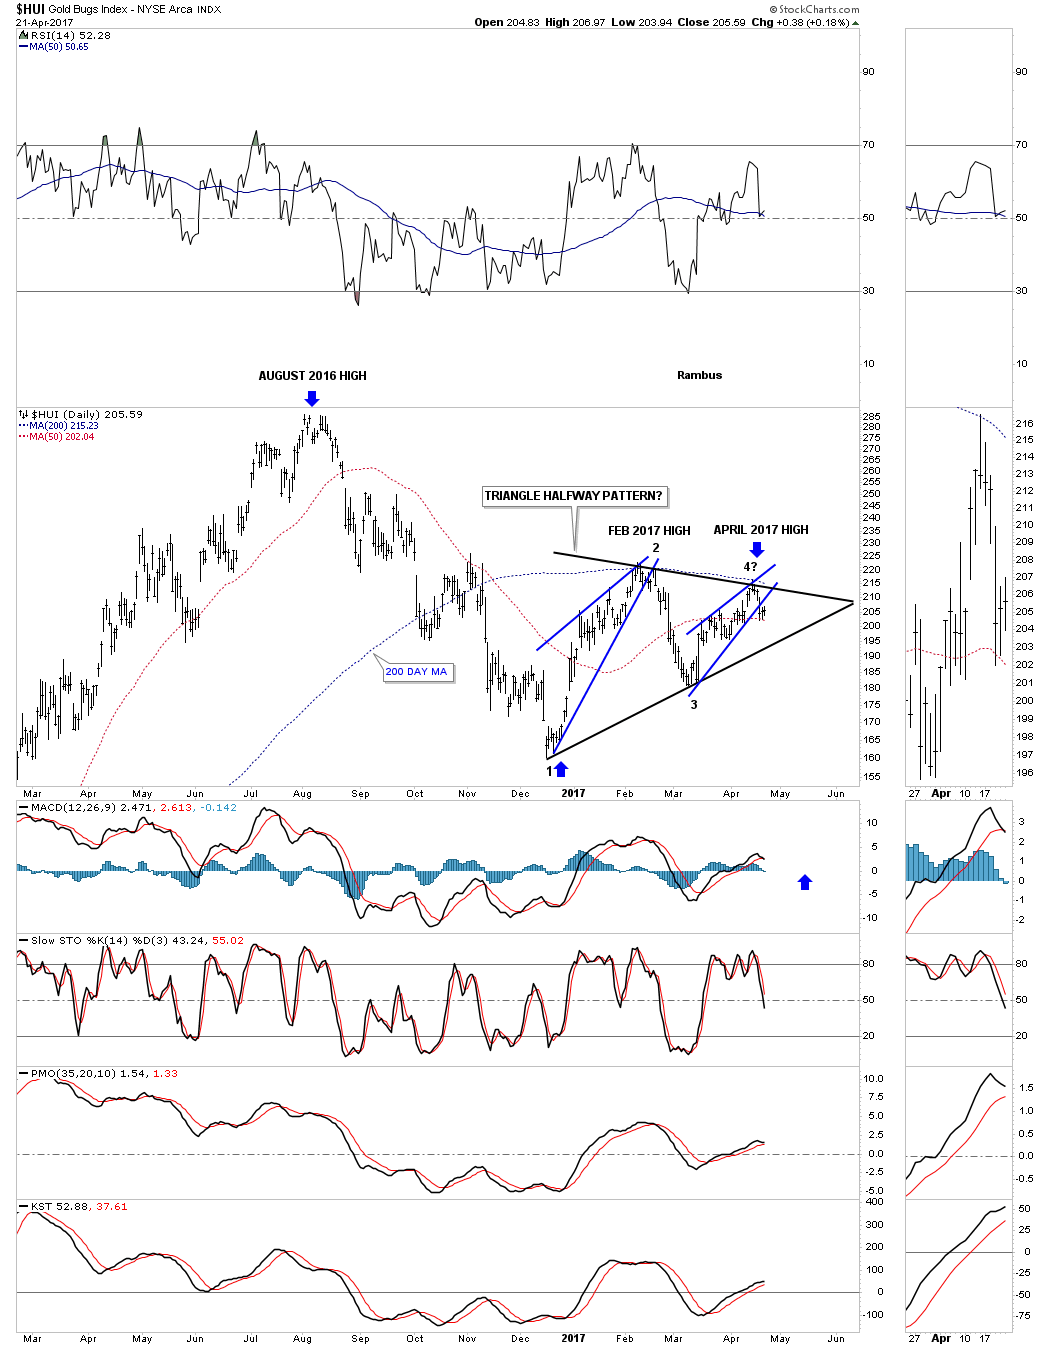
The daily chart shows how the potential triangle is building out. The all important 4th reversal point won’t be complete until the price action hits the bottom rail. Next week I’ll be looking for a backtest to the bottom rail of the blue rising wedge. If the backtest holds resistance the next area to watch will be down to the bottom trendline. If everything works out and the HUI finally takes out the bottom rail of the triangle that will be the place where I will add another small position with the Kamikaze stocks. Keep in mind it may take several weeks or longer of chopping action before there is a resolution to the triangle either up or down so some patience will be required. Have a great weekend. All the best…Rambus