
Last week the markets began to emit signals providing a certain level of clarity. These signals were particularly evident in the precious metals sector. Looking forward markets now appear slightly less opaque than before. As a result, I thought it best to engage ourselves in devising a plan for the rest of the year. We will call this … Plunger’s Strategy Session.
As I have mentioned Rambus has been very gracious in giving me free reign in what I write. You must realize I am a little more speculative than Rambus tends to be. I tend to get out a little more in front of my skis than Rambus. This means of course, I have more of a chance to be wrong. I would call myself a macro/technical trader, whereas I would consider Rambus more of a breakout trader. He often takes positions when the market gives a direct signal using the market’s price action as his trigger. Rambus’ method is likely more reliable, than mine however I tend to be more asymmetric, hunting for the big score. Peter Brandt, the legendary wildly successful trader is an example of a breakout trader.
Although, I have some slightly differing views on some market sectors, overall I am remarkably in line with Rambus’ work. This is particularly true with the metals and commodity markets. In fact, when I mention that the market delivered a level of clarity this week, I must note that this was chiefly identified by Rambus himself through his world class analysis of the PM charts. Knights this level of analysis is available no where else on the planet. Understand this.
When I mention I am a macro/technical trader my method is to first identify a macro story and then see the story play out in the charts. This requires a form of inter-market analysis and it is so very important to guard oneself against curve fitting. Frankly I see a lot of that going on where one draws lines to fit ones narrative as opposed to being objective to the markets message. One needs to constantly examine himself not to become subject to this. Let’s call this maintaining ones intellectual integrity. I wake up everyday and ask myself if I have it right, it’s not about parading ones views, it’s about making money. When the market delivers its message that one is wrong, one needs to acknowledge it-fix it and then move on to the next trade.
The Average Investor-No Clue
In my “real” job as a wide body Captain, I get paired on a daily basis with middle aged professionals who have money to invest and frankly have no idea what to do with it. The only ones who exhibit a veneer of certainty of what to do can only spout off boiler plate brokerage sales talk. Got to invest for the long term… The market returned 7% a year over the last 100 years…. If you weren’t in the market for the best XX days your returns would be cut in half… on and on, yada yada. But, when one digs a little deeper the average guy is nervous. He knows there is something wrong out there. He has a deep fear there will be another crash and knows he can’t survive it looking down the road towards retirement. But he has been too programed by the Wall Street marketing machine to do anything about it. So when one pulls down the veneer and gets him to open up about his investable assets he will inevitably say “but what else can I do?” In other words he has no skill-set and no clue on how to think for himself. That’s the purpose of this week’s report to lay out a strategy going forward.
Two weeks ago I presented the historical context we find ourselves in. We are in the end phase of a long term credit cycle. The bubble burst in 2008 and since then the central banks of the world have been attempting to reflate it. In other words the FED & CBs have deferred the resolution of the burst bubble into the future and the future is now. Through their QE programs and credit offering they have pulled demand and economic activity from the future to the present. This has not solved the problem of debt saturation it has only shifted its resolution into the future. “Free” money has only deferred failure into the future and made the ultimate resolution more painful due to the gross distortions in the economy as a result of FED and CB policy.
Market activity over the past week continues to validate the narrative set forth in my last column. In bullet format this is what we saw:
* London and Europe displaying topping action in the modeled timeframe of May-June.
* Gold and Silver markets indicating a downside resolution.
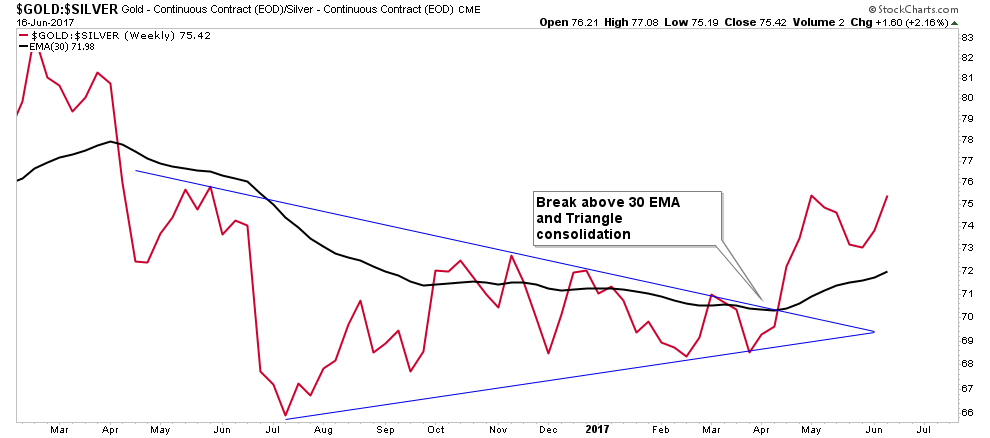
*The Gold-Silver ratio indicating a credit contraction, decreasing credit availability.
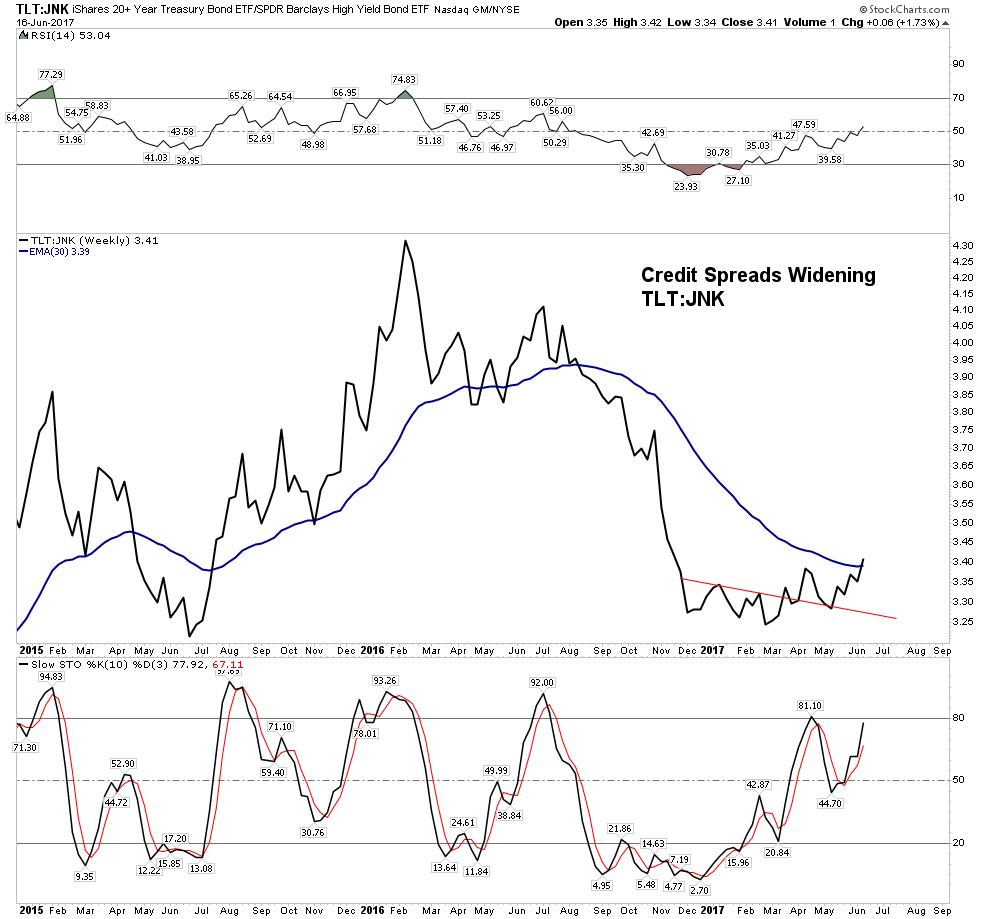
*Credit spreads widening.
*Yield curve flattening.
*Commodities resolving to new lows.
*Speculative sector of stock market losing conviction (QQQ).
*Shift from growth to value.
All of these market actions are consistent with the model presented which is formulated from the past five credit cycles.
Let’s review the dynamics of the model: Towards the mature end of the credit cycle commodities undergo a blow off mania. This mania is typically fueled by wartime demand, however in the past case it was China’s infrastructure buildout. After the bubble bursts speculation flows into financial markets where it finally reaches a frenzy 9 years later which ends the speculation and results in the post bubble contraction process of deleveraging. Debt at the peak of the cycle has grown so large that an economy cannot grow out of it and balance sheets need to get “reset” to start a new cycle of expansion. This all sounds rather antiseptic in such nutshell form, however recall the wrenching process which this entails. In all cases in the past it required a depression to complete the process. Additionally, world wide power shifts and wars are often all part of the process. So it will be a time for all of us to be smart and agile. We have to think for ourselves.
Are the Markets getting ready to crack?
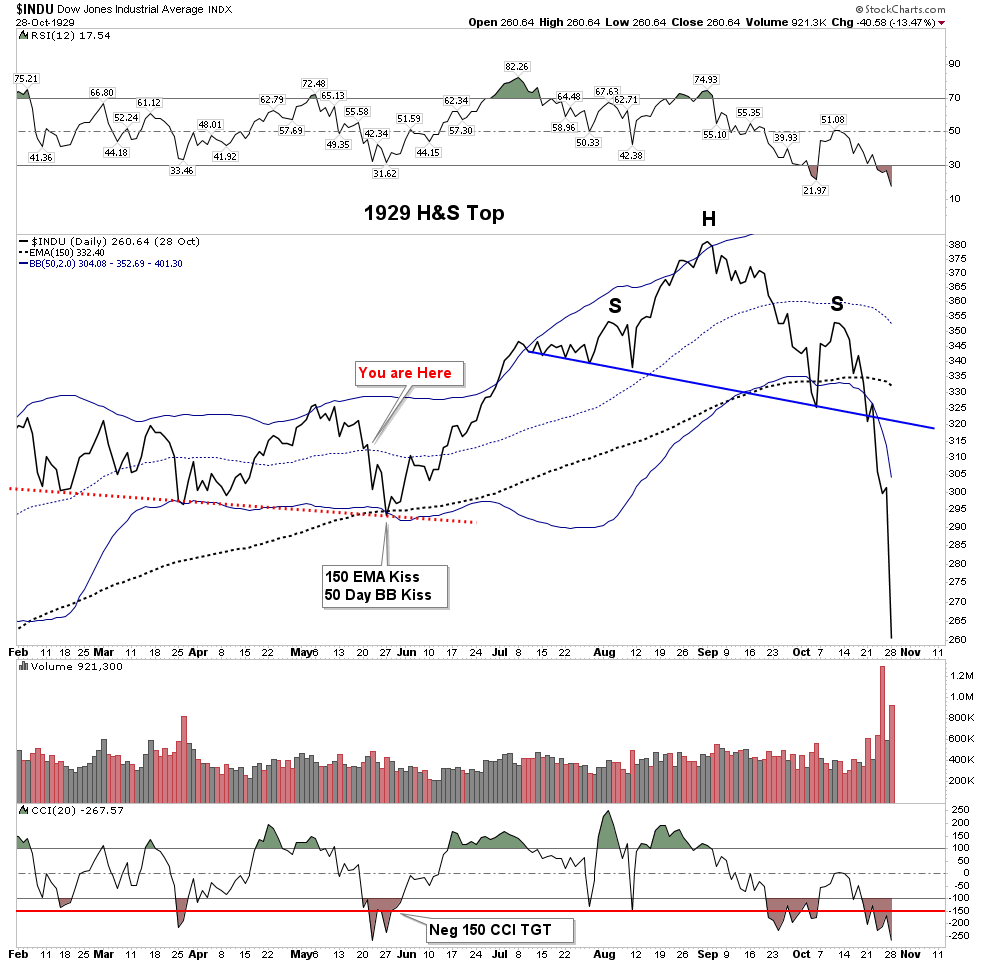
That’s the opportunity, so here is a short term speculative trade to position oneself for it. Note I did not say the bull market is over. I see the market at the cusp of a short term correction or call it a “shake-out” before going on to a final high later this summer. Recall the model has London and Europe peaking in May-June with the US market peaking in September. This is what happened in 1929 and I believe we are set up for a similar scenario. Not necessarily a dramatic crash but a clearing of excesses we will call it.
Below we see a daily line chart of the 6 months leading into the crash of 1929. Note the market underwent a shakeout in late May before its run to highs in early September. Look specifically at the following indicators during that shakeout.
1.Price found support off the red dotted S&R line.
2.Price found support at the 150 EMA (30 W EMA)
3.Price found support at the 50 Day BB
4.The CCI reached the -150 level (exceeded it)
After the shakeout we underwent a wild short squeeze which developed into an ugly H&S pattern which resolved itself into the crash of 1929 signaling a deflationary economic event coming over the next few years.
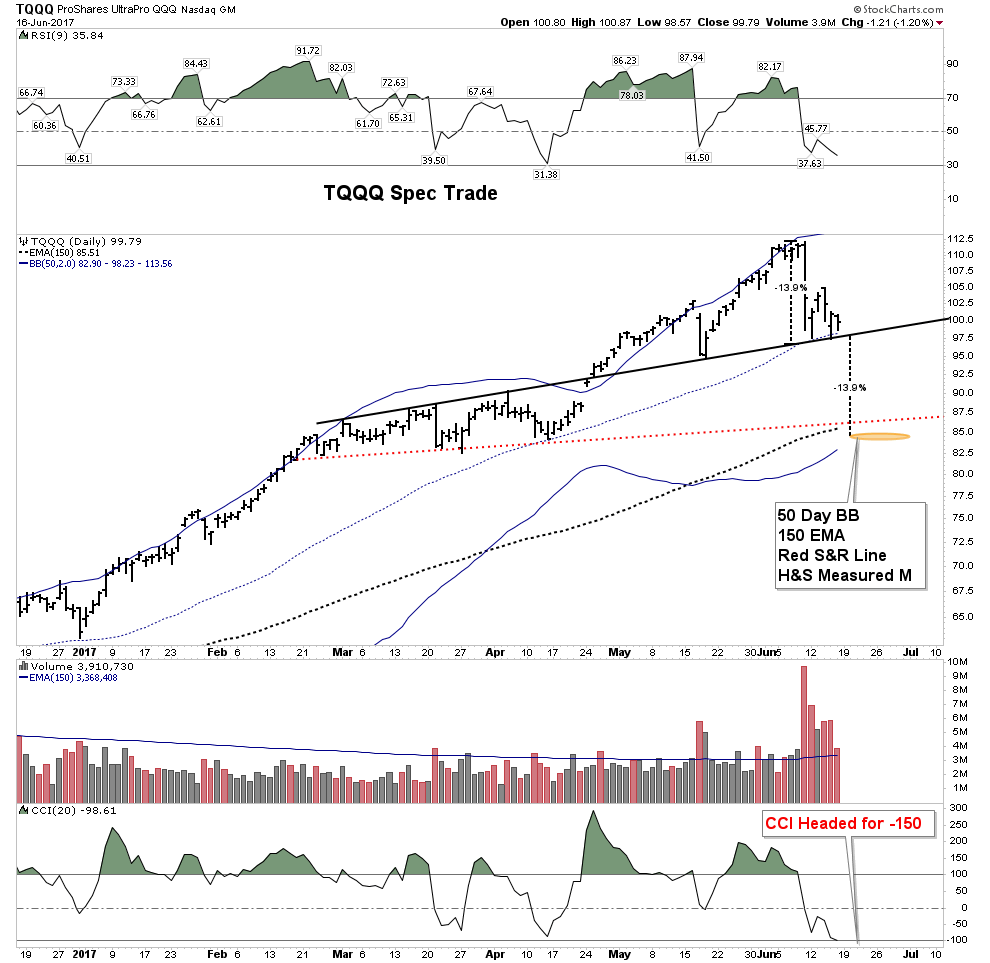
Last week I chronicled that the NDX had undergone a weekly outside reversal to the downside associated with a near term selling exhaustion. The last time this occurred was in March 2000 at the peak of the Dot-Com mania. We can see how the NDX and QQQ has now formed a H&S above its S&R line. It does not become valid until the NL is broken, however that’s the trade. I see evidence that this is the shakeout before the final run to an ultimate high in the NDX in late summer as the model calls for.
My preferred vehicle is the 3X QQQ where we can see the confluence of indicators pointing to a potential price objective of around 85. This is the same set-up we saw in the 1929 chart in the shake out before the final blow off top. If the trade evolves as envisioned I will personally reverse positions and go long to try to catch a run to the upside through August.
GSR confirms Bond Market progressing towards a credit contraction.
The Gold-Silver ratio made a significant move upwards this week. The breakout of the triangle pattern forecast a tightening of credit in the fall market clearing season. This week it moved to confirm the forecast by reaching its previous move high. This serves as another key market signal pointing towards a credit contraction in the fall.
The Treasury curve resumed its flattening this week. This is part of the process of moving towards a possible recession. The spread between low grade corporates and treasuries is starting to open which is consistent with the move in the GSR. Both of these indications is indicative of early stage credit deterioration. Spread widening combined with weak commodities are the ingredients of liquidity problems going forward into the fall months.
The TLT:JNK chart below shows the ratio confirming an uptrend, meaning a move towards credit deterioration. Note the break above the 30 EMA and positive stochastics.
You Can’t get rich if you don’t have the cash to deploy when great values come along.
This is why I am sitting on a large pile of liquid funds. Note I didn’t say cash because this past week I deployed most of that cash hoard into the government bond market. That’s right, I put my dry powder into bonds. Bonds should strengthen going into the contraction and I will sell when my objectives are met and the great opportunities present themselves. I split the position into two chunks, half into the Wasatch-Hoisington Treasury Fund and half into the TLT.
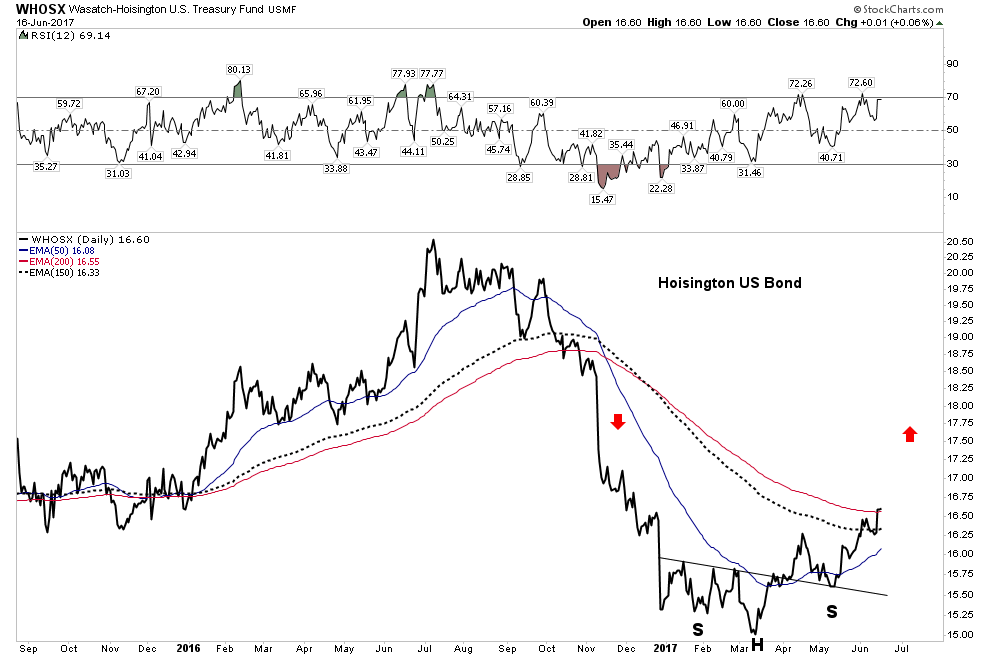
The Hoisington TF shows great chartology having put in a nice H&S bottom and is now breaking through resistance. It should be clear sailing up to the 18.75 level. This is a long term maturity 20+ year duration fund managed by Van Hoisington and Lacy Hunt.
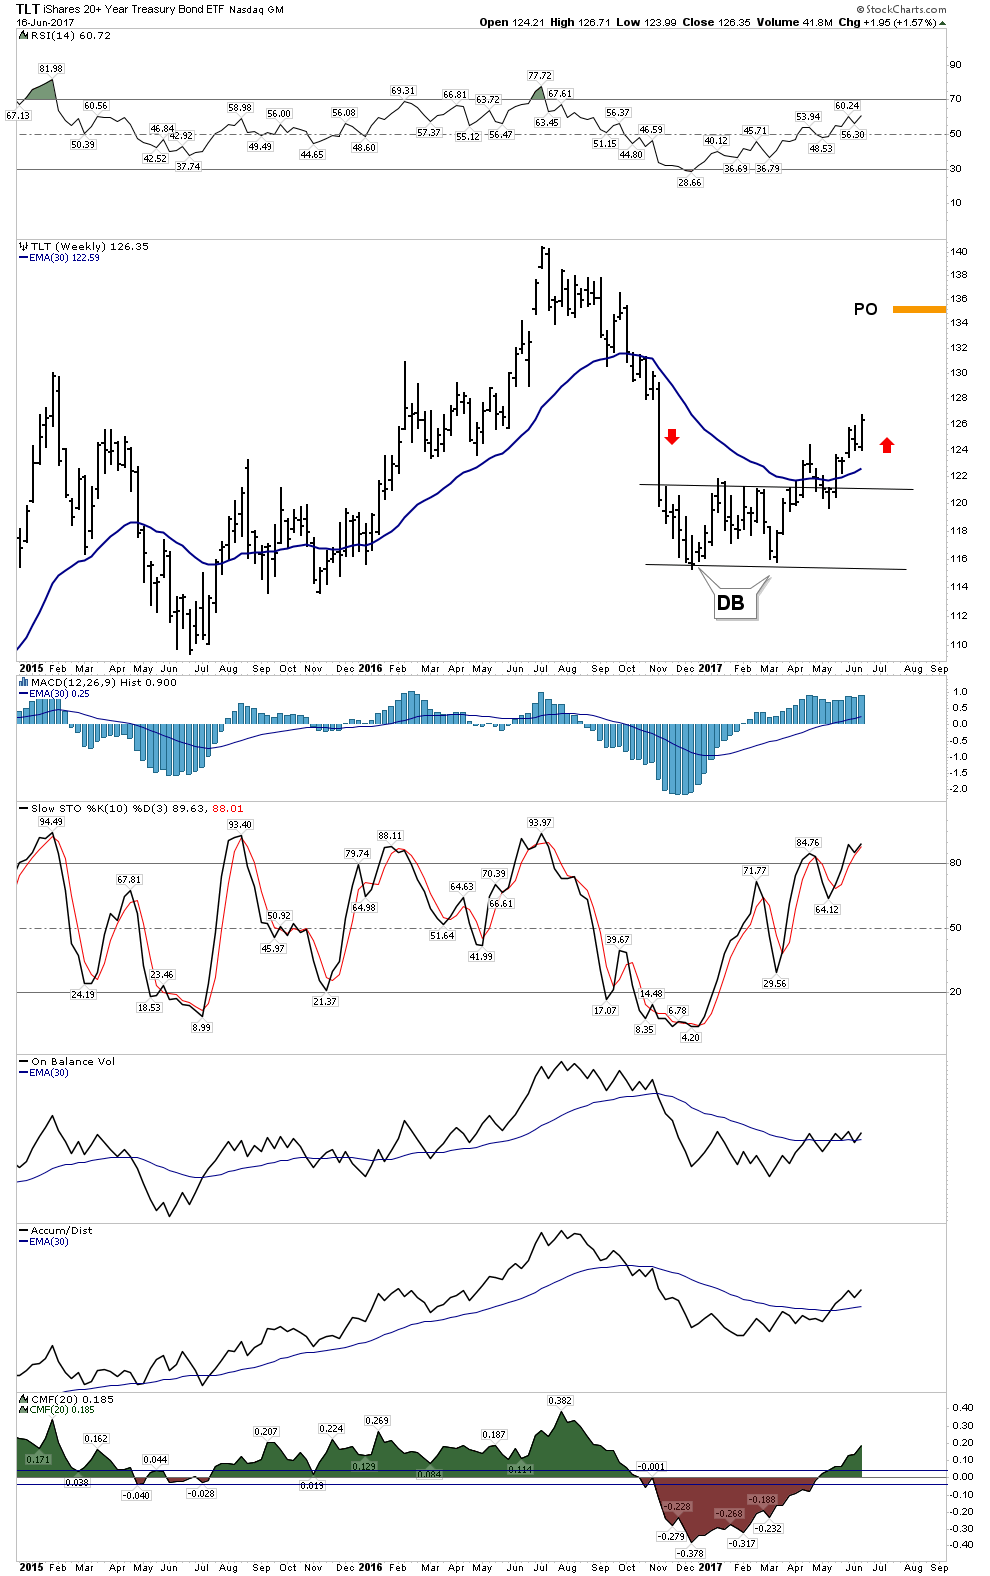
The TLT is of course 10-year US Govt treasuries. It has put in a nice double bottom and is now above a rising 30 W EMA and into a symmetry zone of no resistance. It’s a good place to just “hang out” with a jumbo-sized war wagon of cash at the ready.
Gold and PM Market- The Master and Commander
After seeing the charts and analysis Rambus has provided us over the past week I can only say-I am not worthy. Through all the false moves and hype of the sector he has stayed firmly at the helm. Master and Commander comes to my mind as he has remained steady on the tiller. I can’t really improve on his PM charts so I will post his with my comments.
Over at the Gold Tent, Electrum posted an article by Peter Brandt about trend lines. In the article he shows where the curve fitters went wrong. He points out the correct criteria for a break through a trend line.. Peter would know as he has been a breakout trader for 40 years.
He summarizes three criteria for a valid break of a trend line:
Penetration– it must close 3% beyond the trend line.
Volume– Did volume rise notably on the penetration?
Strength – Did it just rise to the line then feebly roll over? If it did then any selling pressure
invalidates the move.
Using these criteria let’s review the following Rambus charts:
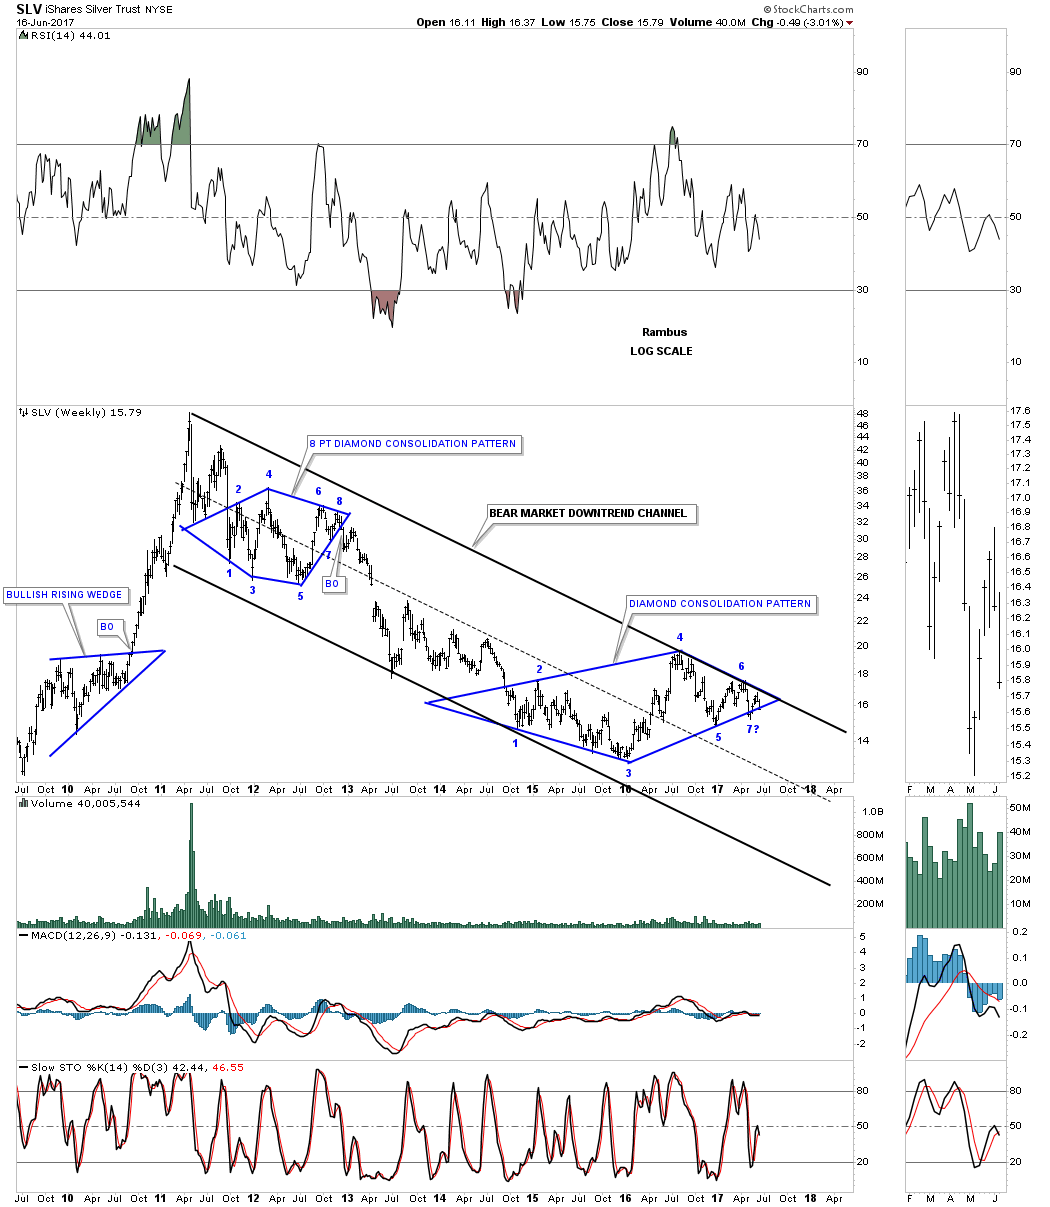
Rambus’ work over the past week has clearly shown that these patterns have failed in their prolonged back testing phase. We can see this in his combo chart which I post below:

In addition to his work let’s update my gold market bottoming system where we will see how the market has deteriorated significantly over the past week.
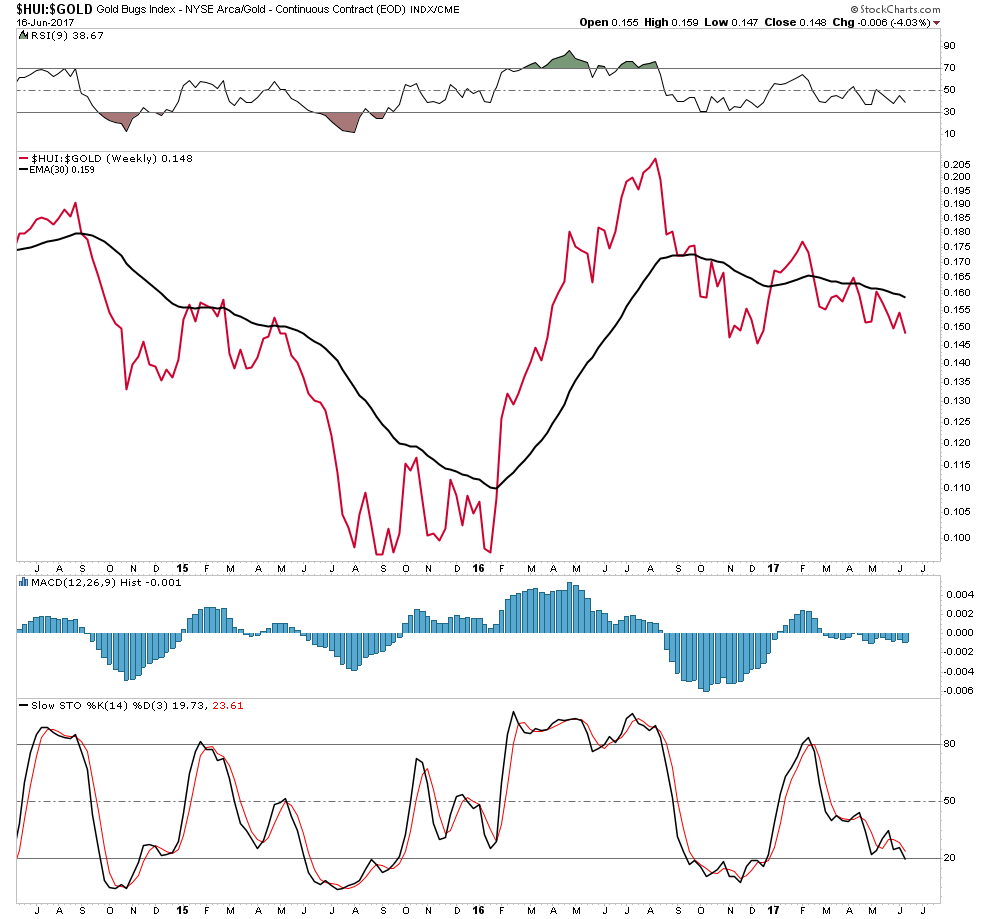
HUI:GOLD- My #1 chart telling me how the stocks are doing compared to the metal. The stocks should outperform the metal in an uptrend and we see the opposite. In fact this week we violated the previous low- Bearish
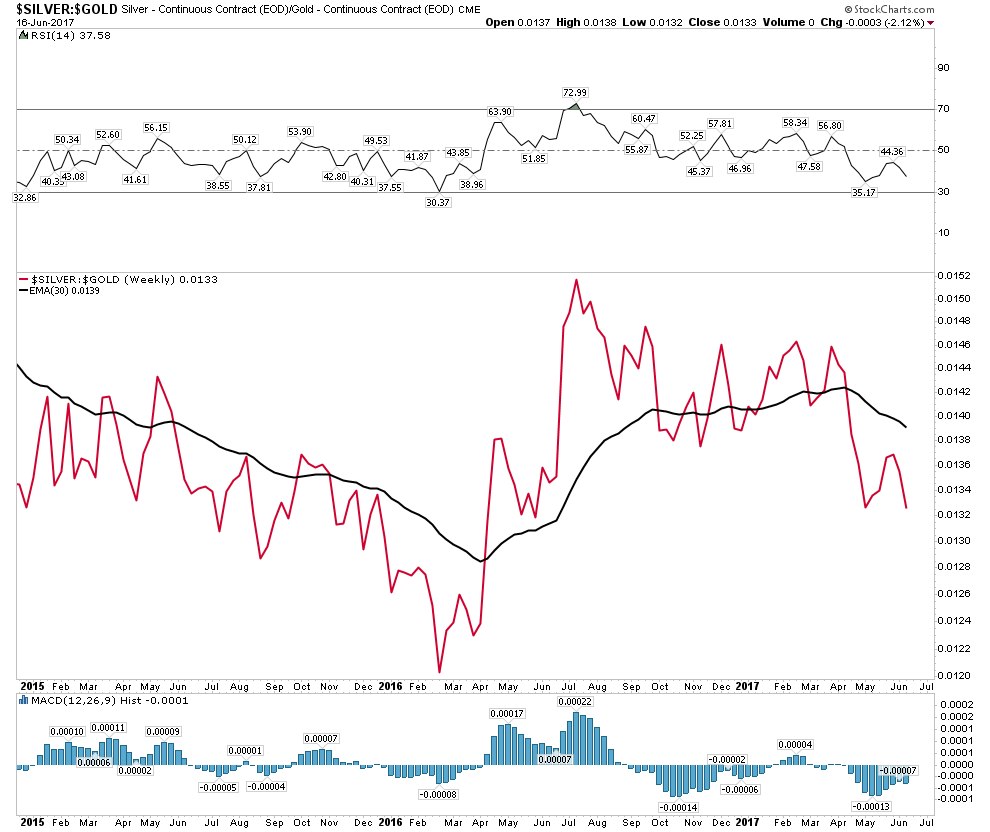
Silver:Gold– Once a rally gets going silver should outperform gold. Clearly we see a troubled chart- Bearish
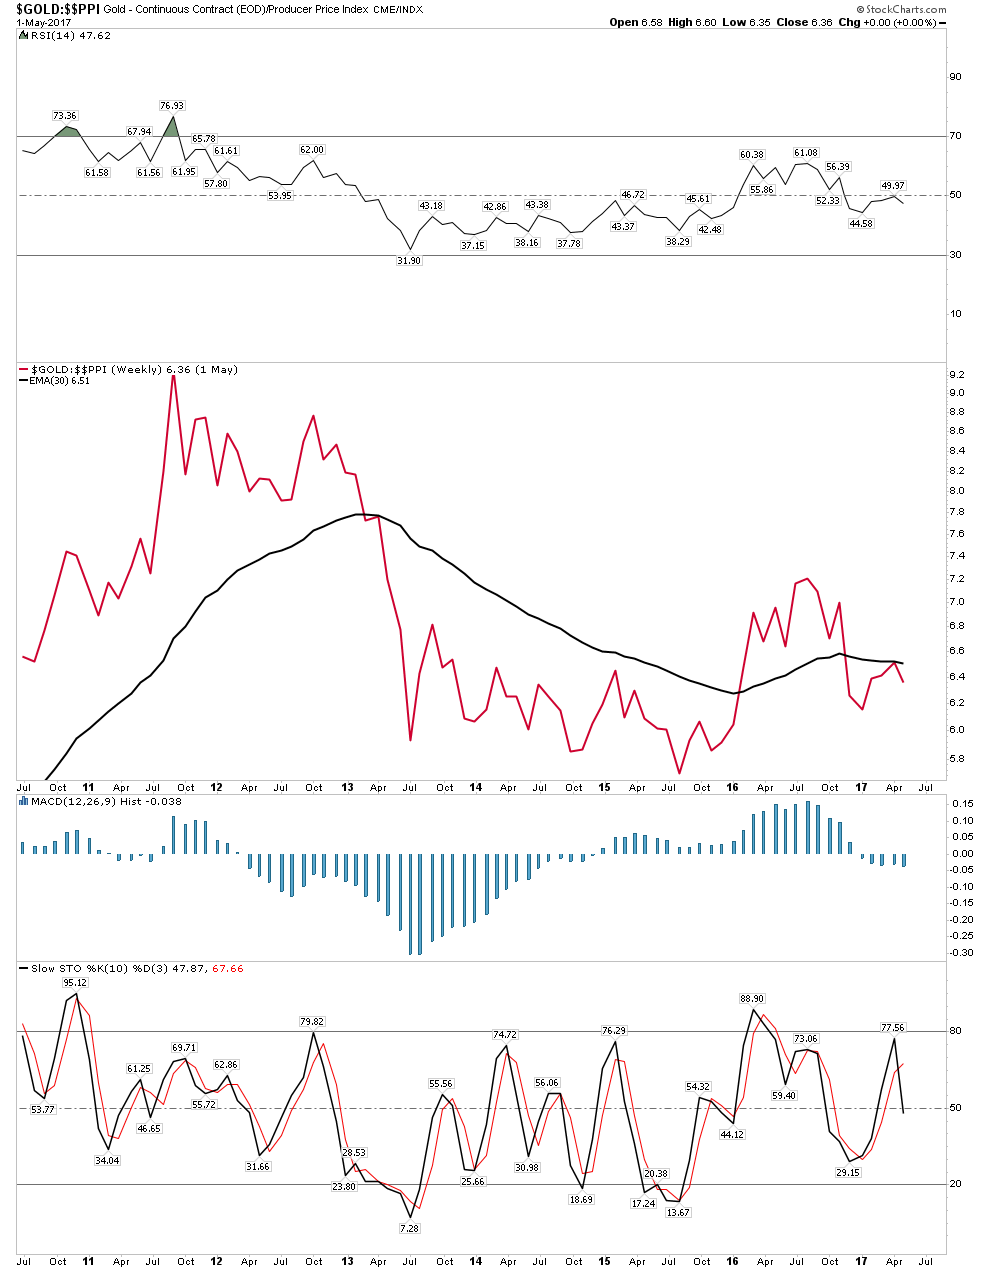
Gold:PPI Here we see the 30 W EMA turning back the ratio trend. Again that’s not what we want to see. We want to see input costs reducing relative to the gold price- Bearish
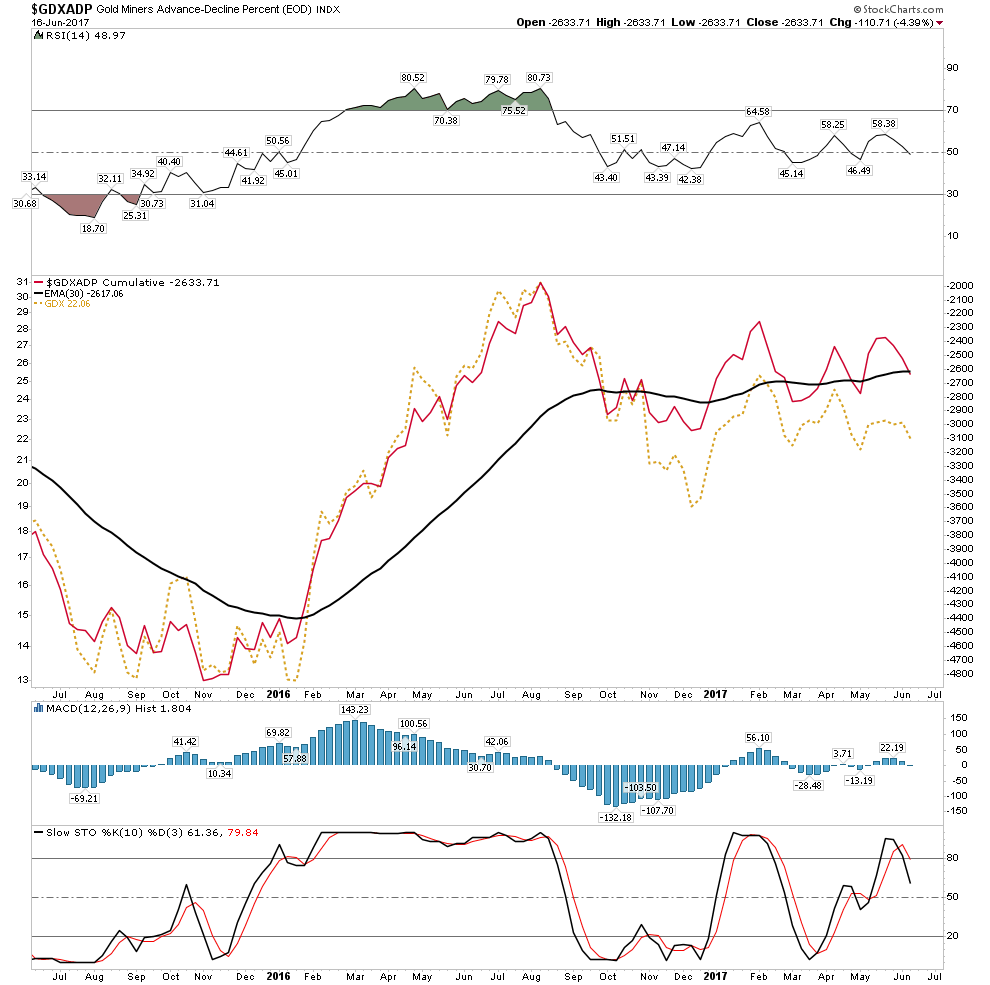
Advanced Decline Line– This has been a mixed bag until this week. It has now tipped its hat to the downside- Bearish.
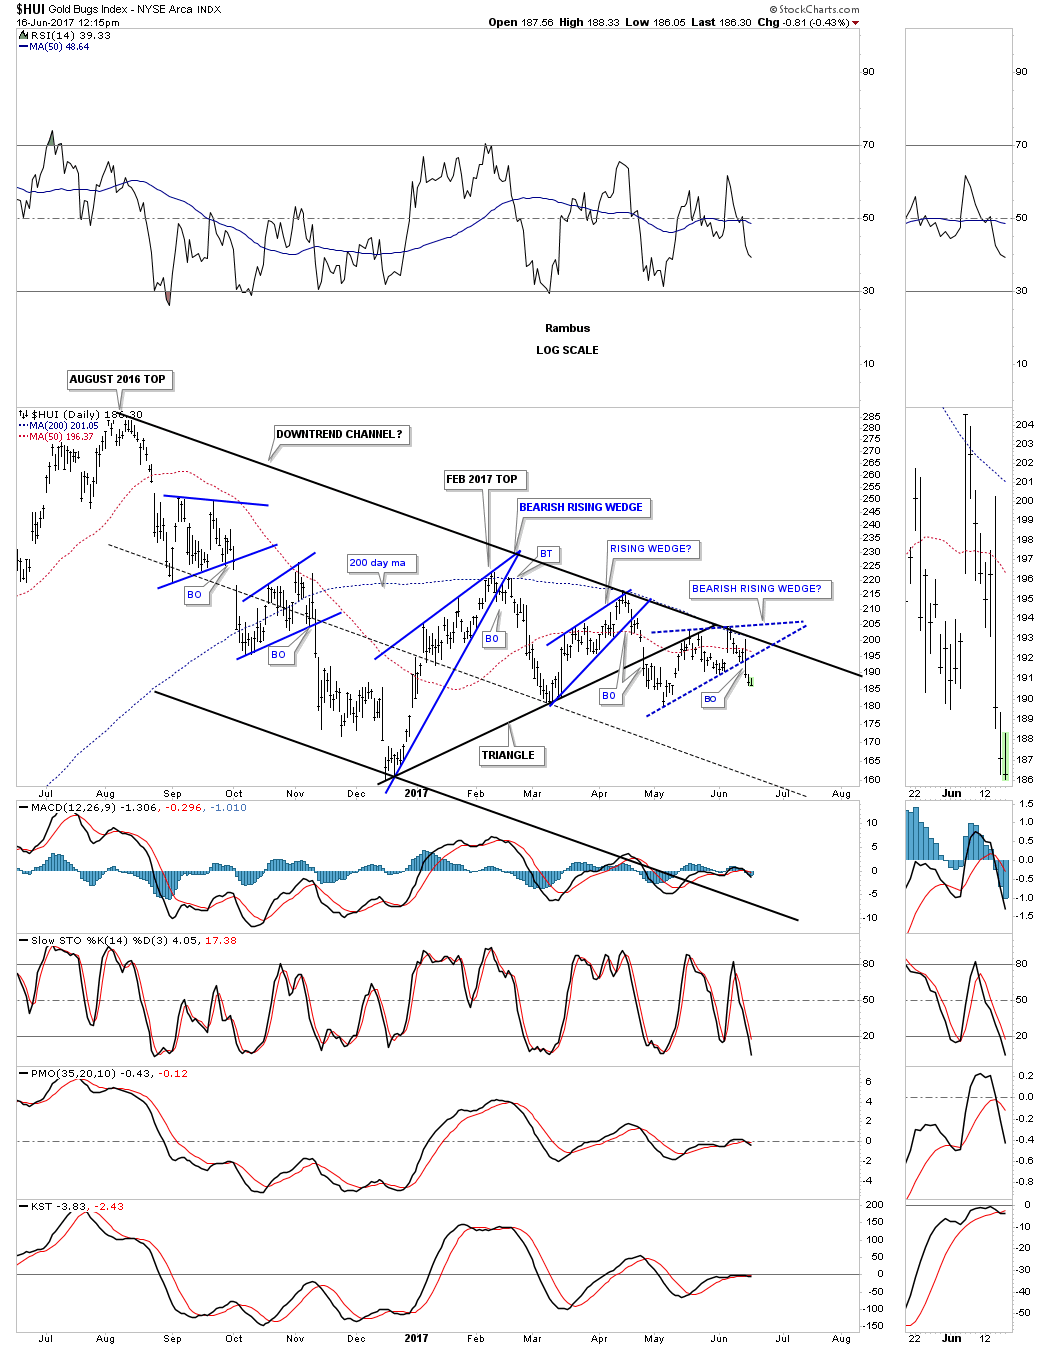
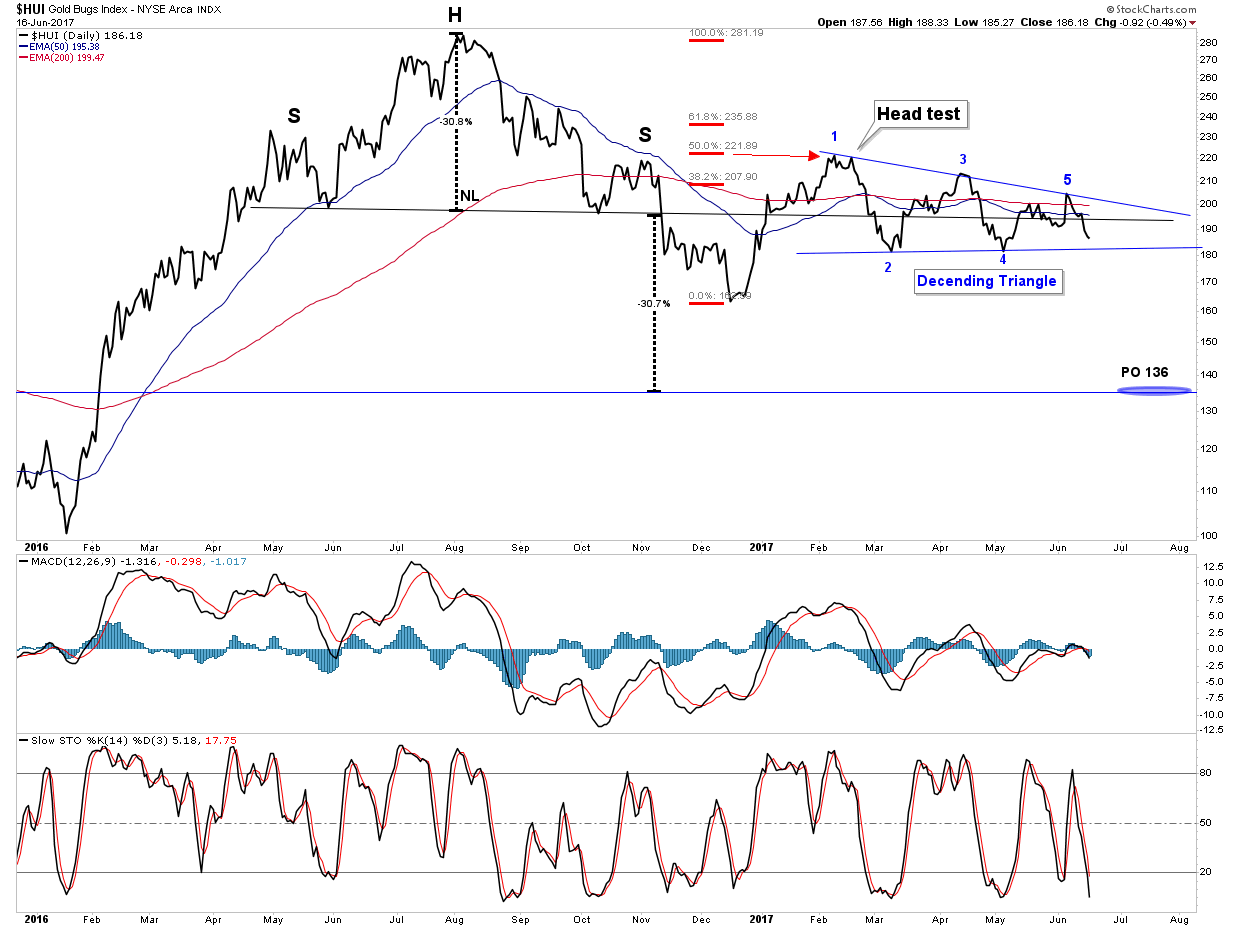
I am a reformed gold bug, I want to see gold stocks go up, but I also want to buy near the bottom so I am trying to be objective. Remember we are trying to make money here not be cheerleaders. So where could the HUI actually end up? This is where Rambus and I diverge in our views. His charts are extremely compelling and he is also right…anything can happen no matter how shocking. But I am sticking with my original forecast that the HUI will complete its measured move to 135ish and that will be our bottom. It may even come as early as this fall.
If the model plays out and we get a spreading liquidity problem in the fall rest assured the gold stocks will get hammered. This seems counter intuitive to many but consider that gold is bought as insurance so when the disaster hits the insurance is cashed in. In addition the time to clear gold trades is one day less than other assets so it provides emergency liquidity therefore it is sold first. Once gold is sold to cover the initial disaster claims however, investment demand may increase for gold which should move the gold price up in non-USD currencies.
So the initial credit “hit” could wash out the gold stocks and then they could begin their relentless rise in a post bubble contraction bull market.
The below line chart of the HUI depicts 136 as a measured move PO based off of the H&S top. Note the retracement was exactly a 50% FIB move. Also we see these head tests or bull traps so often in markets, it’s classic. It’s Mr. Market’s technique of building up selling power by getting the gold bugs all lathered up again and chasing the shorts out of their positions. For the past 5 months we have been building out a 5 point descending triangle. What we see occurring is each time price rallies it is met with overhead supply at a lower price level. Recall the principle that important patterns tend to build themselves out near significant S&R lines. We see it just broke below the extended NL of the original H&S. Also understand that triangle pattern is coiling energy as time progresses. At some point it will break above or below and release that energy in an impulse move. Evidence suggests that the breakout will be to the downside, thus fulfilling the measured move.
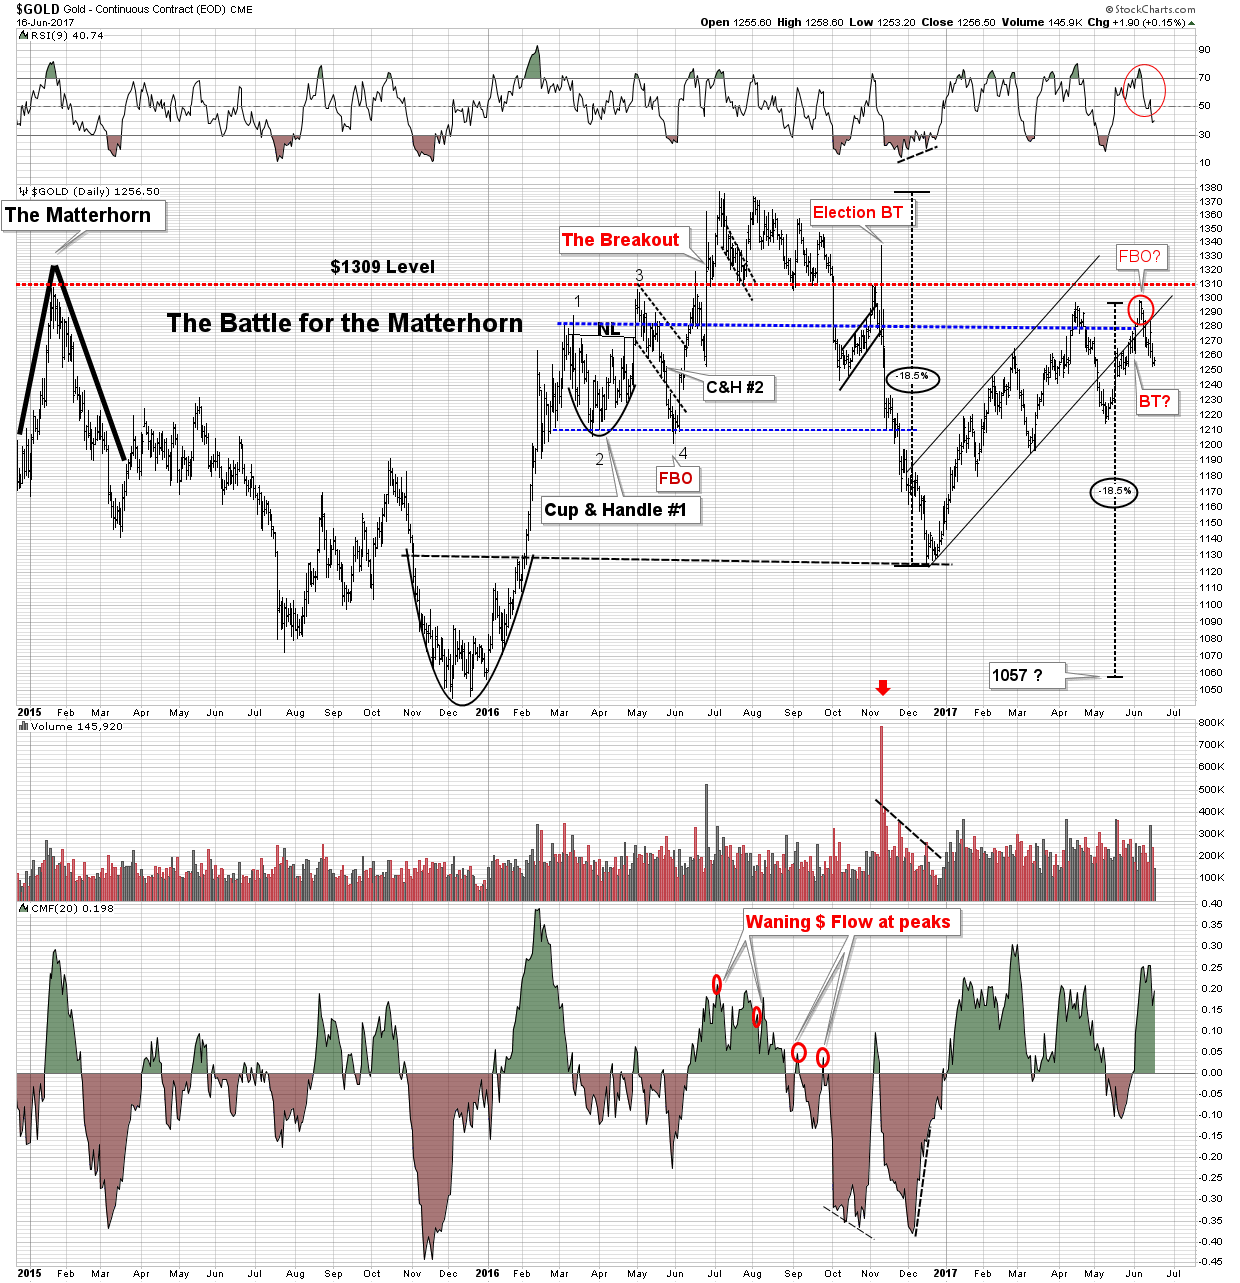
The Matterhorn- It may have been just an aggressive back test.
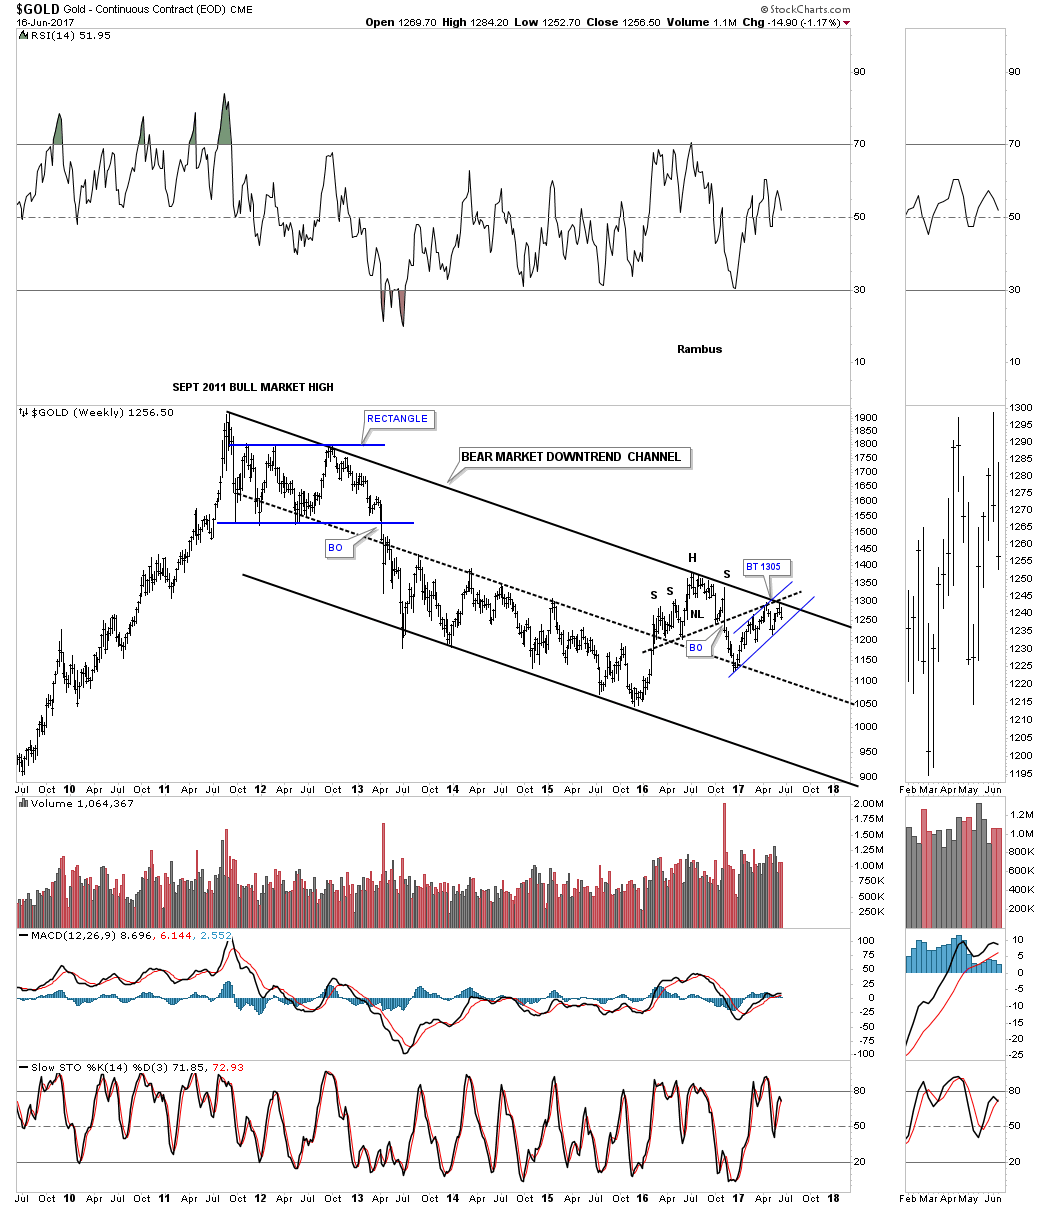
After reviewing Rambus’ work that’s what it appears to have been, an aggressive back test. The Matterhorn chart shows this and all the machinations of the past 2 years. Here we see a measured move for gold to the 1057 level, which would be a double bottom. Note also the above HUI PO of 136 would be 36 points above its previous low. This would set-up a classic gold stock/gold positive divergence. It would be even more classic if the stocks were to bottom well ahead of the metal.
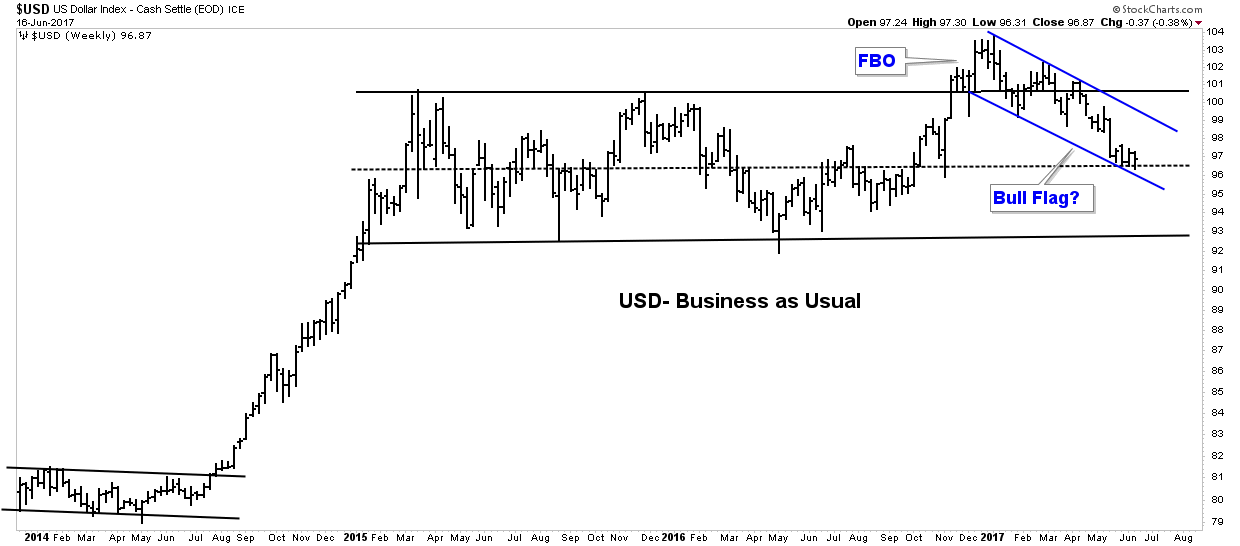
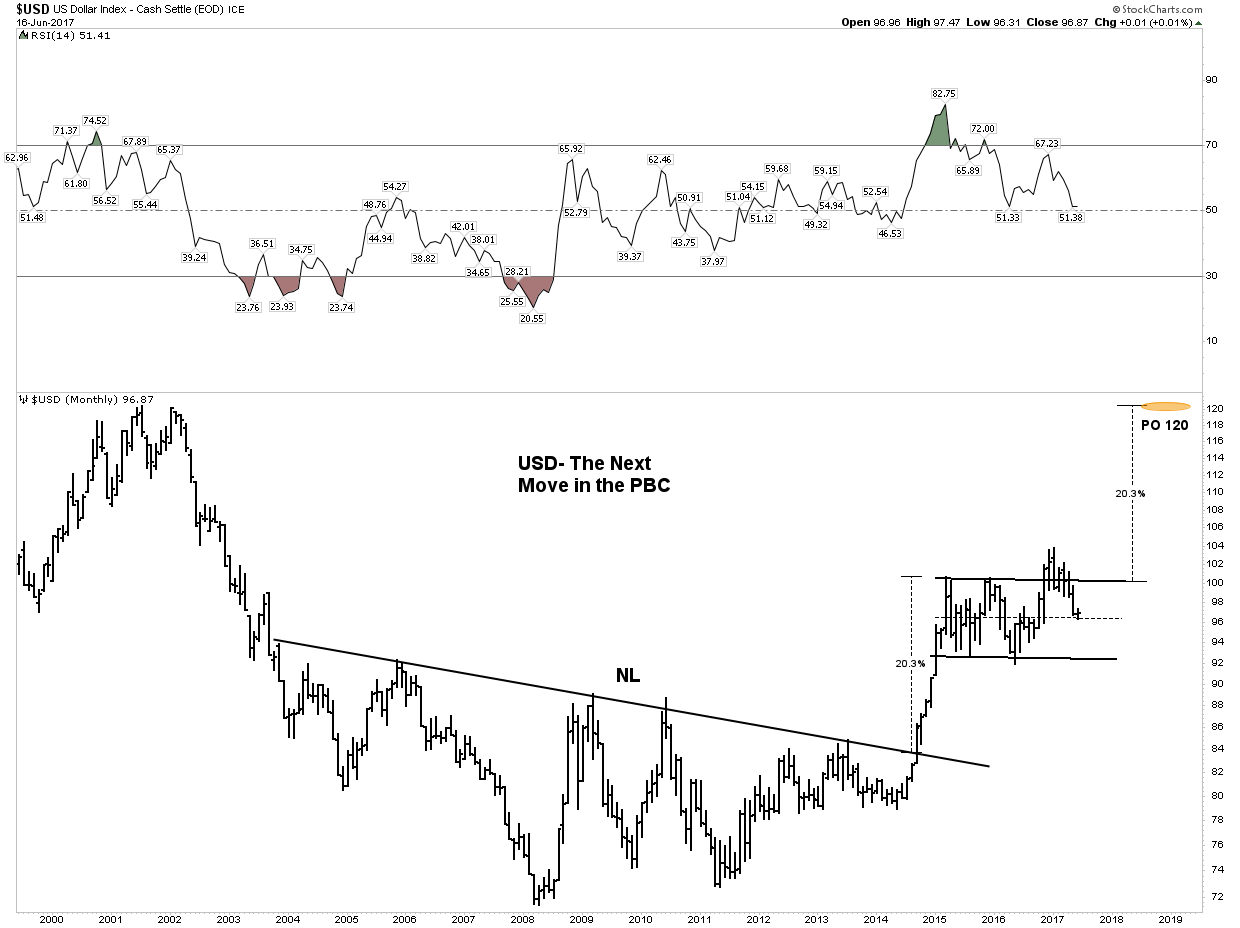
The USD
Over the past few weeks I have laid out the case for a bottoming USD. The world’s debt bubble needs to be serviced in USDs and the world is short the dollar. Lower oil prices and the decay of the Euro-Dollar system is creating a shortage of US Dollars. For several years now the dollar has been rising in a post bubble contraction. Market moves don’t occur without consolidations and that is what we have been witnessing over the past two years. Over the past week the Dollar has been attempting to build itself a bottom after putting in a TD13 sequential sell. This is constructive and if it can hold the 96.50 level it should be able to complete its bottom within one month. If not a move all the way down to 93 could still be possible. Eventually the dollar should fulfill its measured move to the 120 level once the contraction takes hold within 2 years.
Commodities
Commodity prices continue to deteriorate. The grains are undergoing some basing action, however the broader commodity complex is in decline. We are reviewing this long term chart, yet again, because it is so important. Again, its the scariest chart on the planet because of its implications.
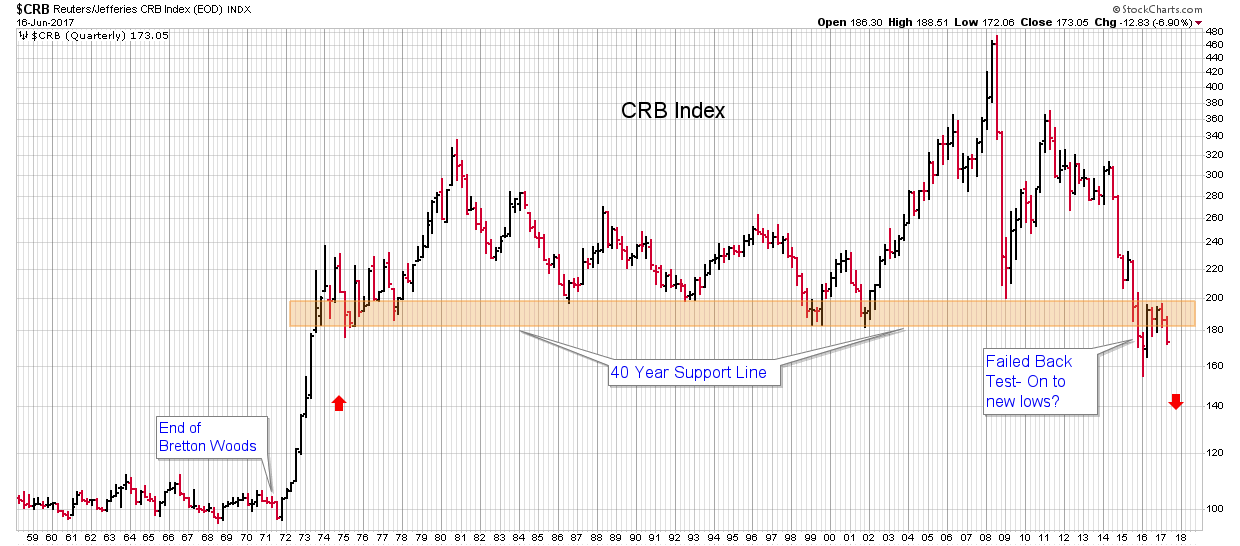
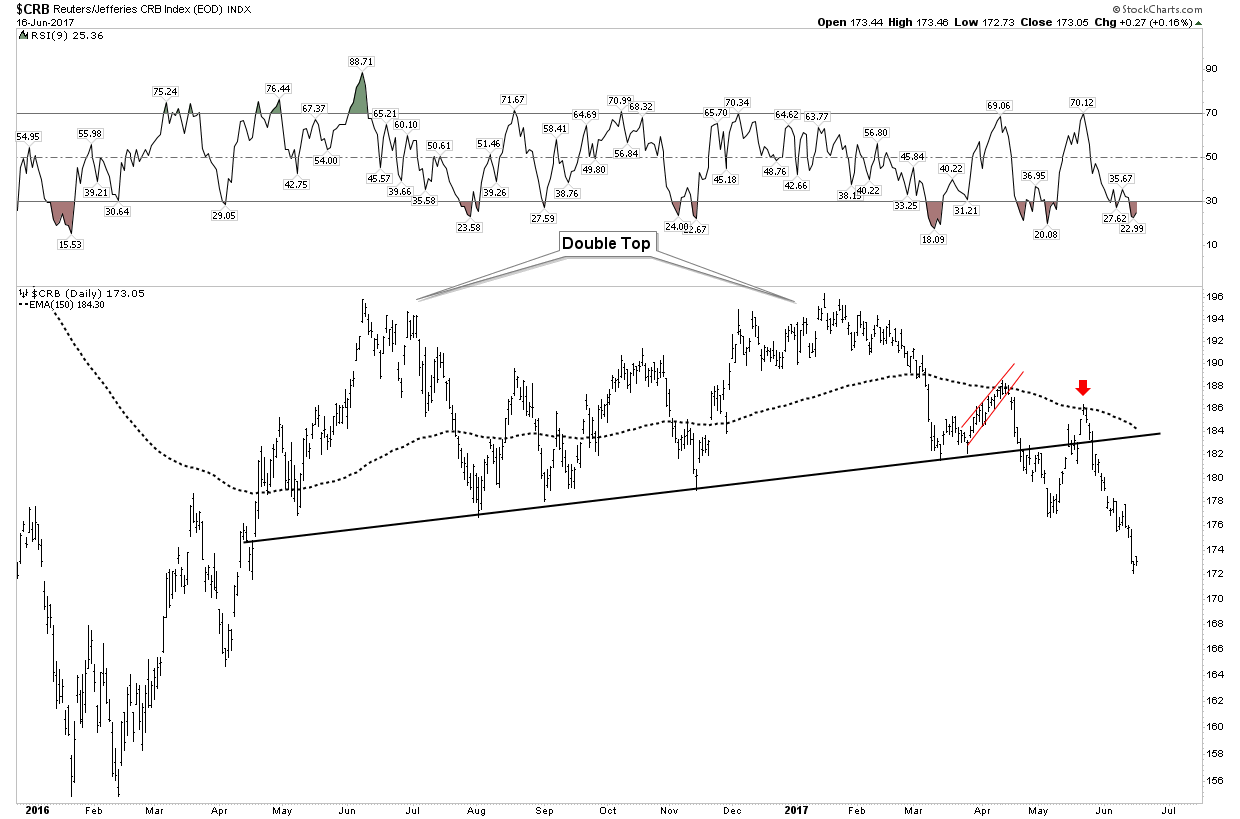
We have watched the daily chart over the past three months trace out perfect chartology. Bearish rising wedge getting repelled at the 150 EMA then go onto violate the S&R line which has contained price over the past year. The snap back then gets repelled by its now declining 150 EMA. Note that snap back could only survive above its neckline for 4 short days. It’s impulse move is now releasing the pent-up energy of the entire year long retracement. The early May low offered absolutely no support and it looks as though 164 is dead ahead.
Don’t think of this exercise as simply lines on a chart. Consider that the CRB is made up of 40% liquid fuels and oil trades in dollars. Lower oil and commodity prices means fewer dollars in the world. It adds up to emerging markets blowing up in the contraction. This chart is very important and we have not even considered the impact of a rising USD.
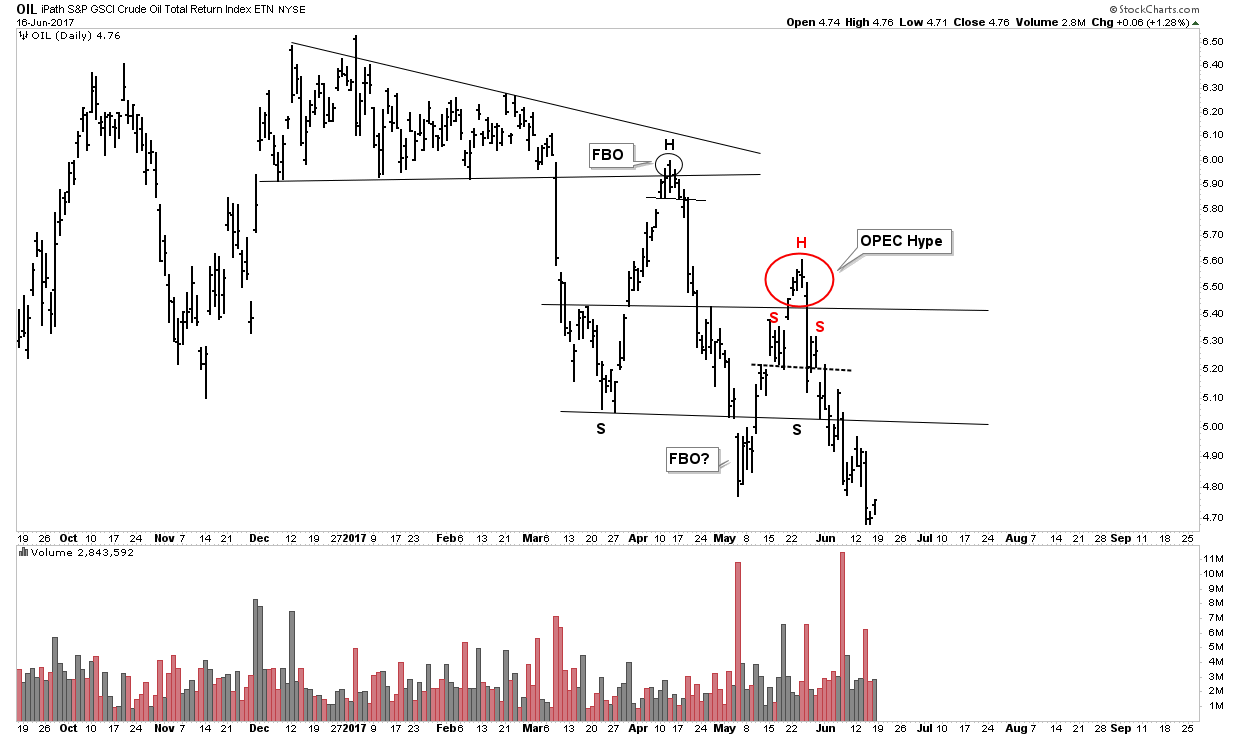
Plungers Big Trade- The Oil Short
I picked Oil as my Big Trade because this year oil is the most important economic indicator. It wraps up FED policy errors and economic sensitivity into one trade. Through “free” money the FED has allowed the fracking industry to blossom and flourish my misprizing capital. We are headed towards higher output here in the USA and the frackers have forward sold production at $50 two years into the future. Its time to pump it.
Meanwhile OPEC lives in La La land. Flood the world not with oil, but with propaganda. Whatever it takes to get its Saudi Aramco IPO off next year. So they are actively ceding market share to frackers and OPEC cheaters. Keep in mind OPEC was created for principally one reason to prevent a free market through production quotas. What happens when the free market asserts itself and prices continue to fall while countries have to pay their bills? One has to put money on the table to keep the lights on and the revolutions at bay. They are going to pump.
At some point OPEC is going to figure out that its jawboning is not influencing the price and all they have accomplished is to cede market share to frackers and OPEC cheaters. At that point what if OPEC decided to announce it was not going to extend the cuts? Can you picture the bloodbath? History repeats, this looks like 1985 all over again and we haven’t even talked about a recession.
It is becoming more apparent that OPEC is not able to control the price of oil due to FED money printing. I believe it is inevitable that at some point they will face reality and protect their franchise.
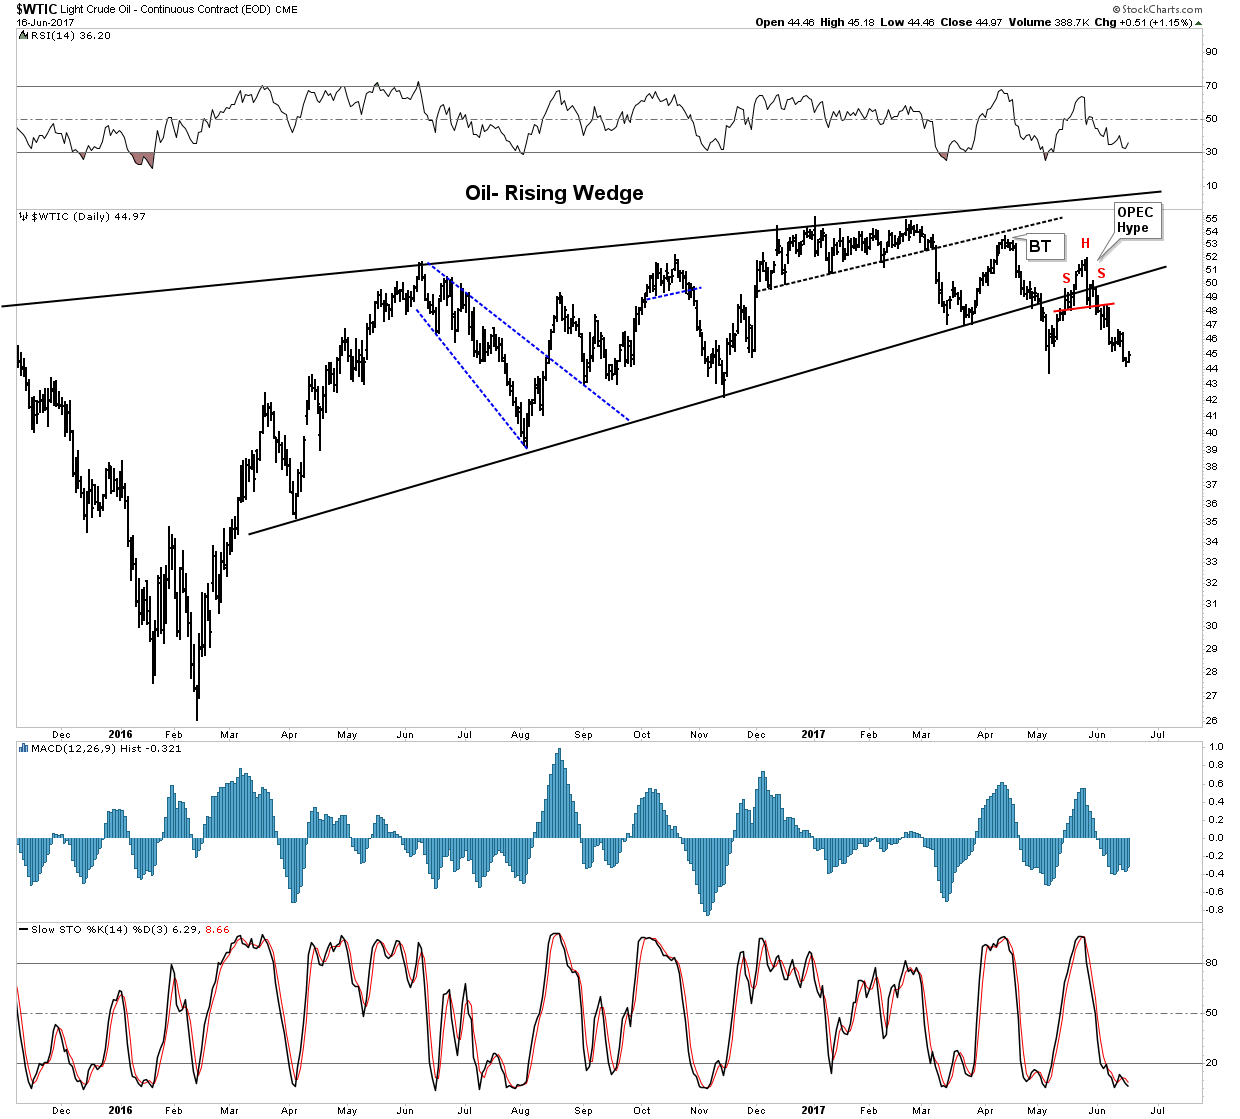
The oil price is mirroring the dynamic of a ball bouncing down a staircase. The conversion of potential energy into kinetic leads to higher and higher bounces. We currently appear to be at a stretched downside point that should soon lead to a upside reversal. The downside is getting pretty exhausted for now be ready to cover soon.
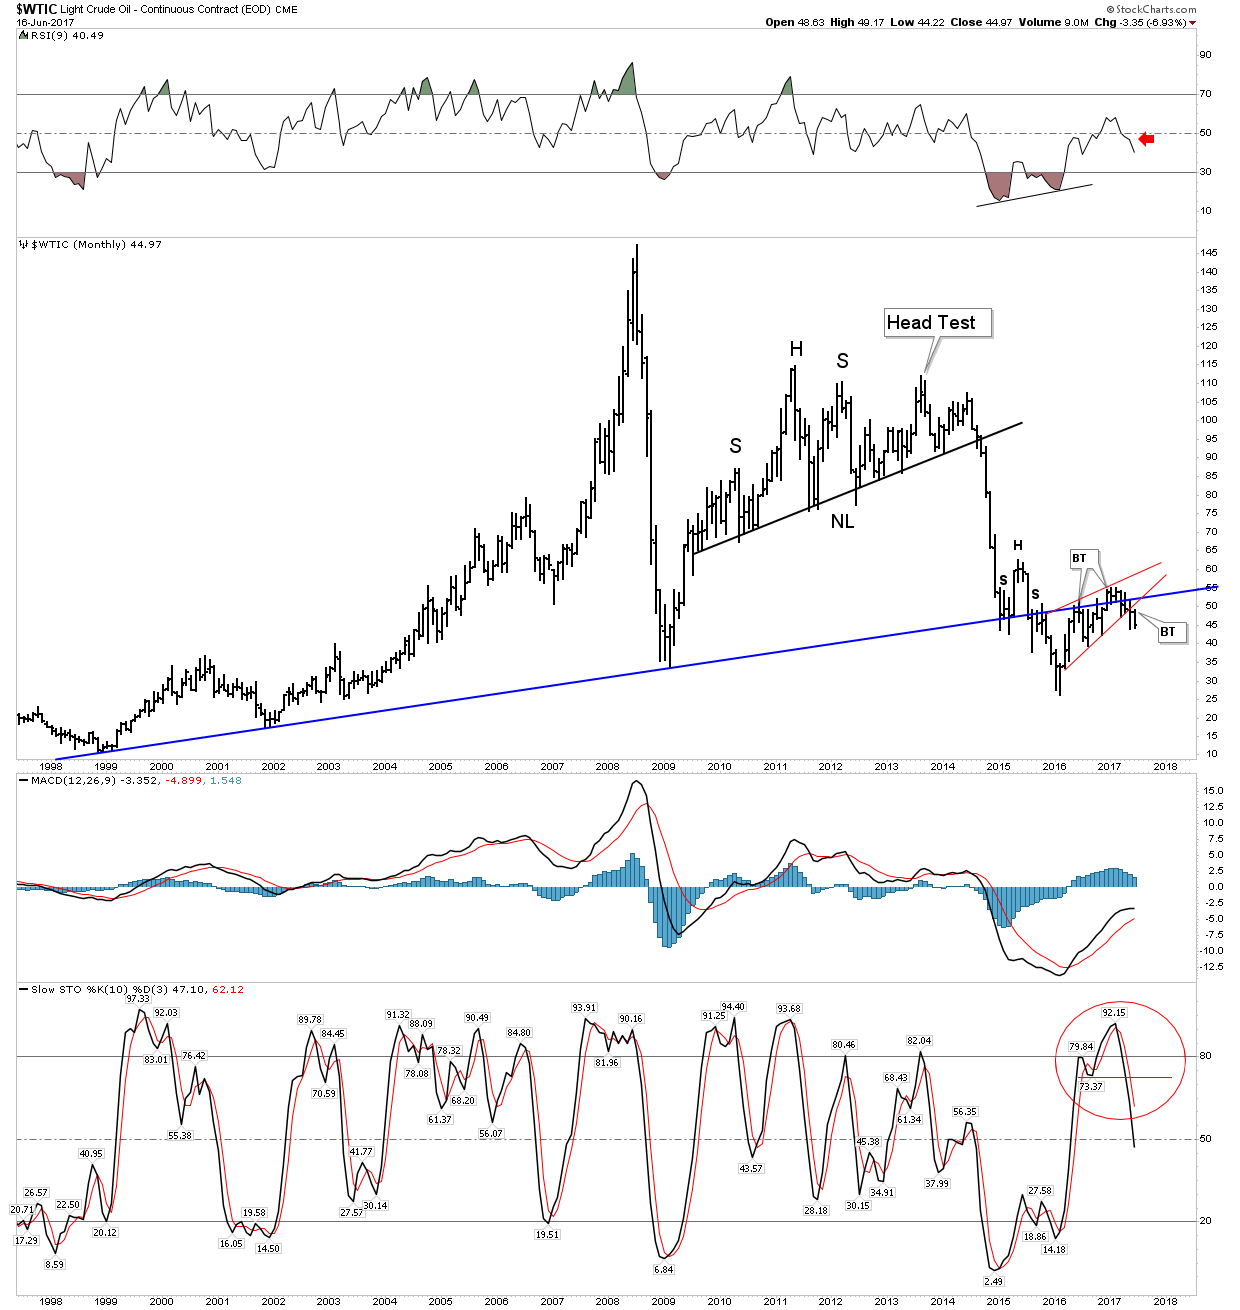
In the big picture chart of oil below consider a recession combined with a reversal of OPEC policy and one should see that this chart may have $25-$30 oil written all over it.
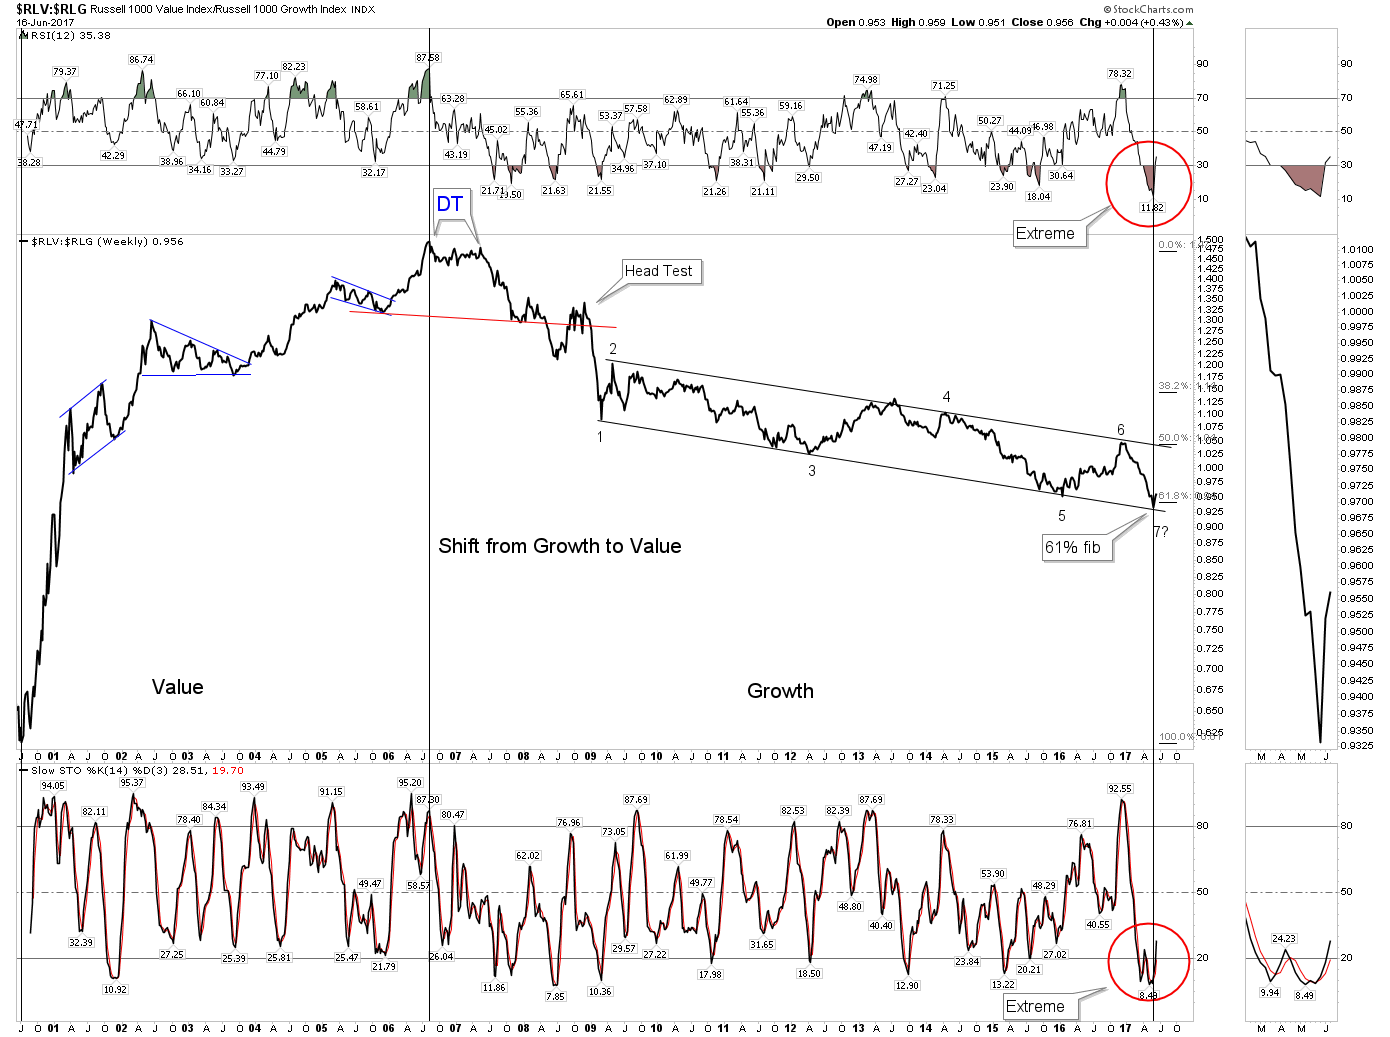
Shift From Momentum to Value
This is another phase shift element included in our market model that we are witnessing. This does not mean value stocks have to go up right away, it simply means they will out perform growth stocks. It is significant that we see this chart reaching extremes right where the model would call for it to occur. What we see here is a trend change clearly in progress. Time for long suffering value investors get their turn at the wheel.
Special Opportunities- Scandium International
It’s no secret I have an institutional sized position in Scandium Intl. Two years ago after a one-on-one conversation with John Kaiser I recognized the revolutionary and scalable opportunity that exists with this concept. John has constantly put this idea out in front of the public in his weekly Howestreet broadcast. The chart below delivers classic Chartology patterns all the way up. Over the past 3 years the 30 W EMA has been in a steady climb upwards. This past week was a great week from a chart perspective. It sliced down through both its 150 & 200 EMA in one single day, however on low volume. The next day however, it reversed the move on 4 times the upside volume. In markets the most important price of the week is the Friday closing price and here we got a weekly bottom hammer with the body above the 30 EMA. Also note the turn up on the weekly stochastic above the all important 20 level.
Weekly OBV and Acc/Dist both in an uptrend. Again a very healthy looking uptrend.
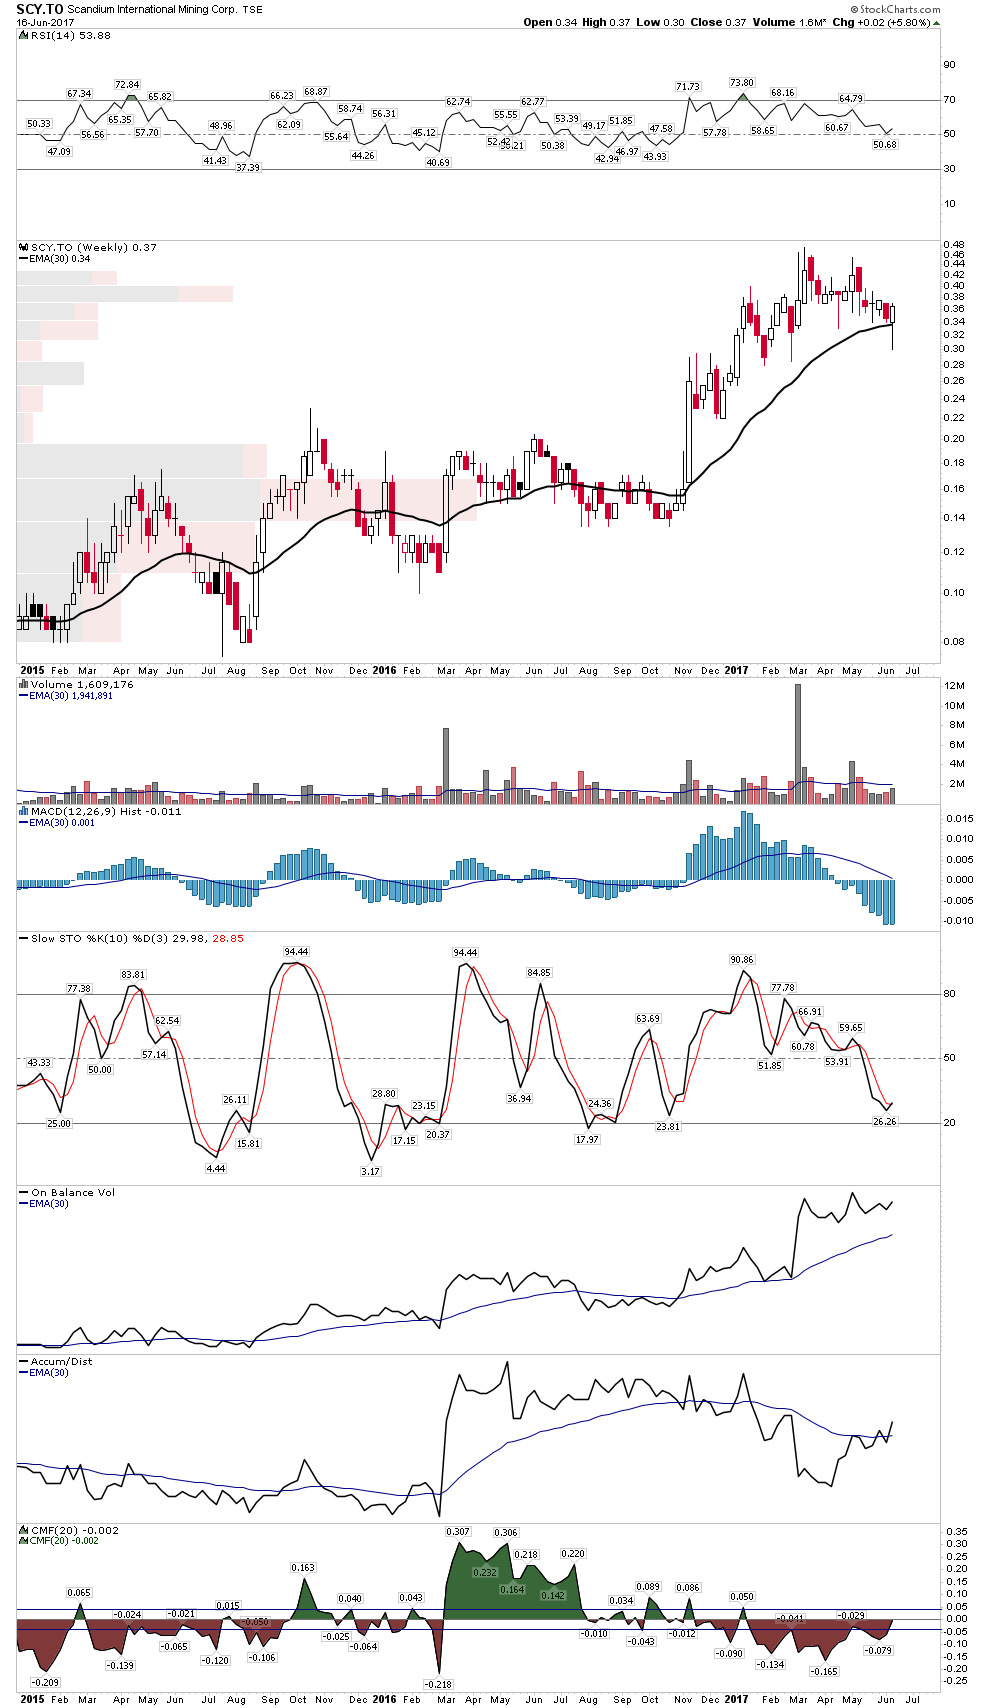
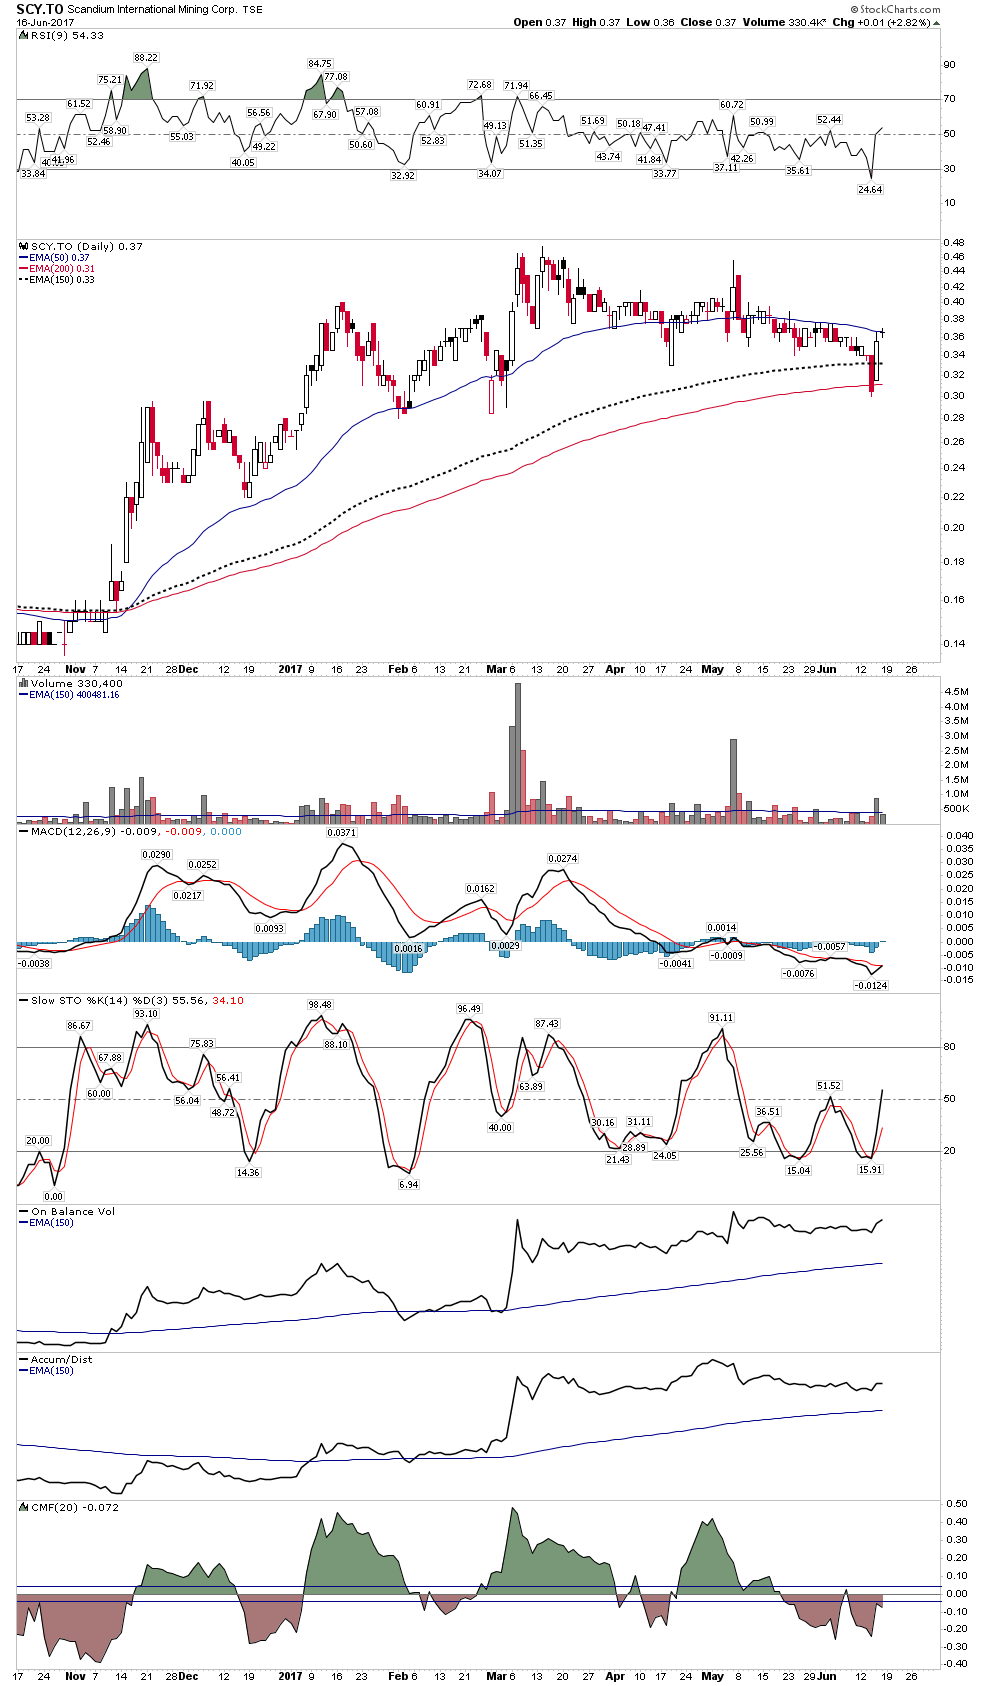
I use the term “special opportunity” as I think this developmental project can proceed no matter what the market does. It’s a revolutionary concept providing light weight aluminum alloy to industrial production. This same model played out before in the steel alloy Niobium which revolutionized steel production, so we have been there….done that. This is the same thing except it’s for aluminum. This company is working on a USA listing and will soon start coming on the radar of investors.
Gold Junior Exploration
Despite the bearish configuration of the PM sector there is still selective opportunity in the junior space. The focus of the market is on the few projects that are viable at today’s gold price. These are not pie-in-the-sky projects where we need $1600 gold to make them work, these are projects that are economic due to lower input costs right now. I refer you to Spock’s site where he has focused his efforts to track these specific opportunities.
Companies that are in an uptrend that I follow are as follows:
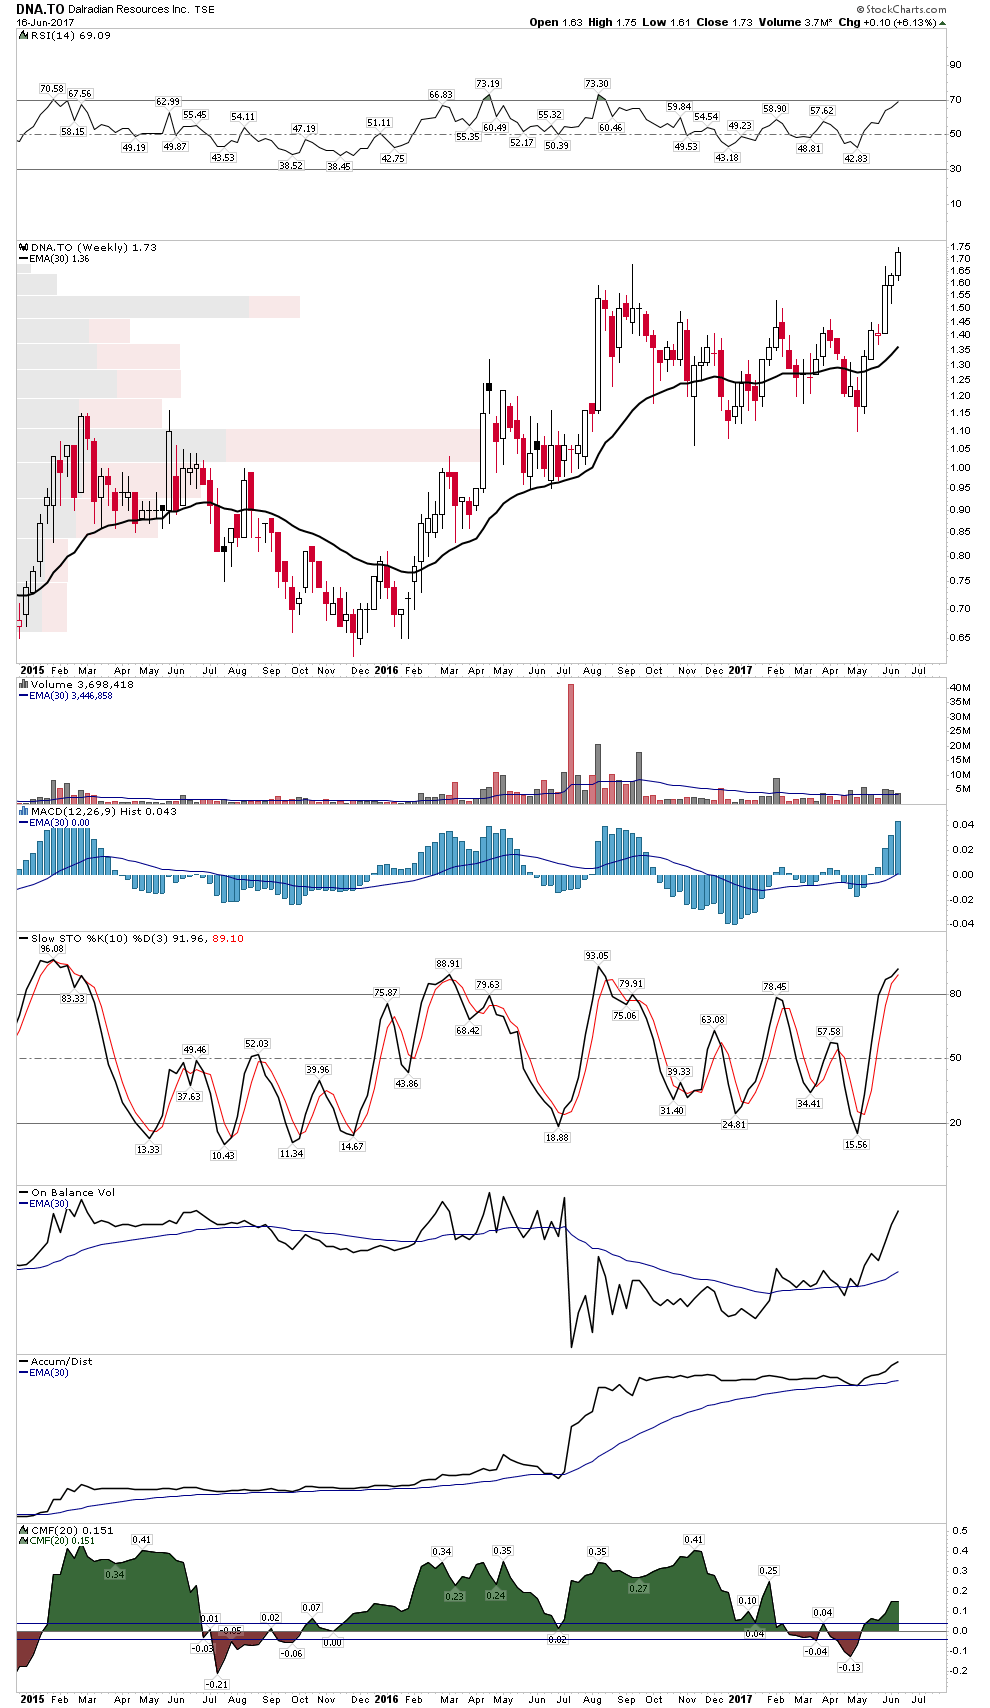
My takeover candidate is Dalradian Resources (DNA.to). This is on the front burner of activity I would expect some action soon.
Other positive configuration companies are :
AAU, SGB.v,HUM.L, KG.v, ATV.v, NHK.v, AUG.to
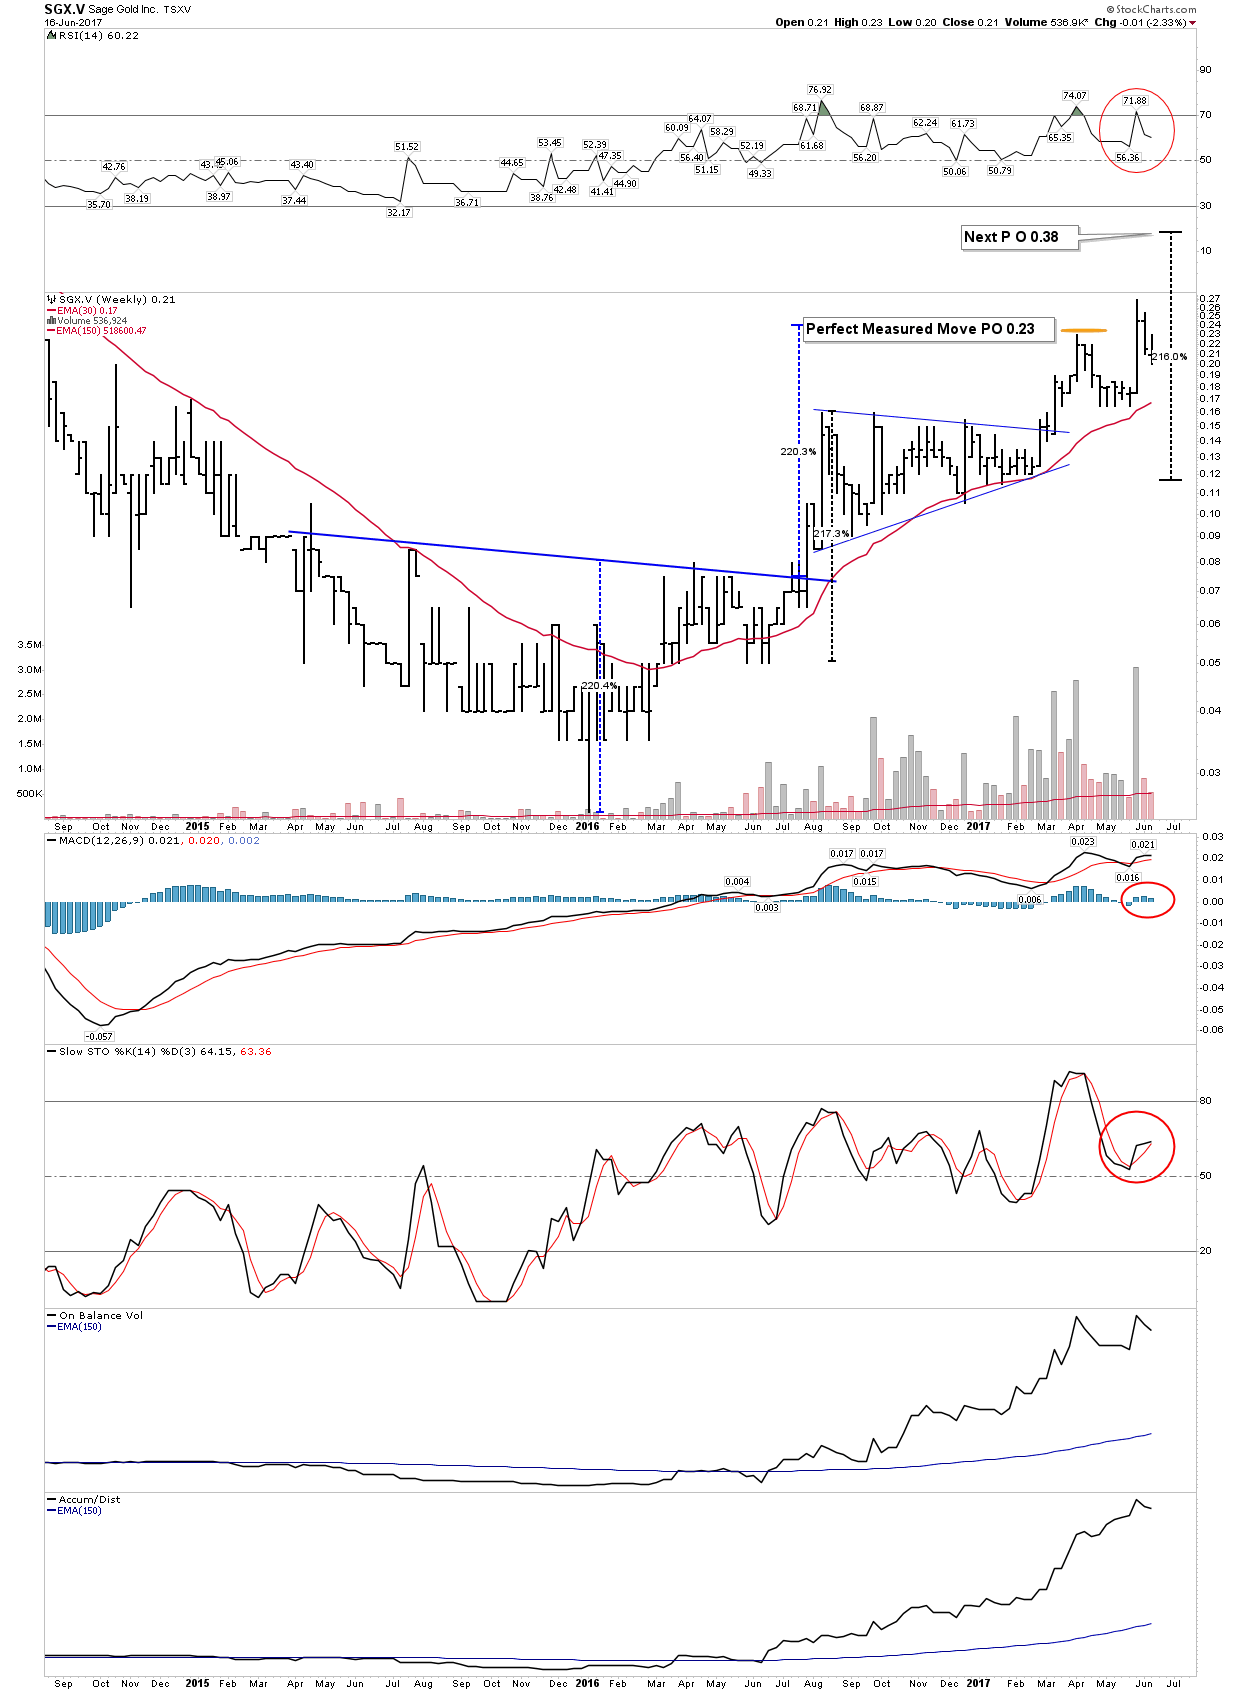
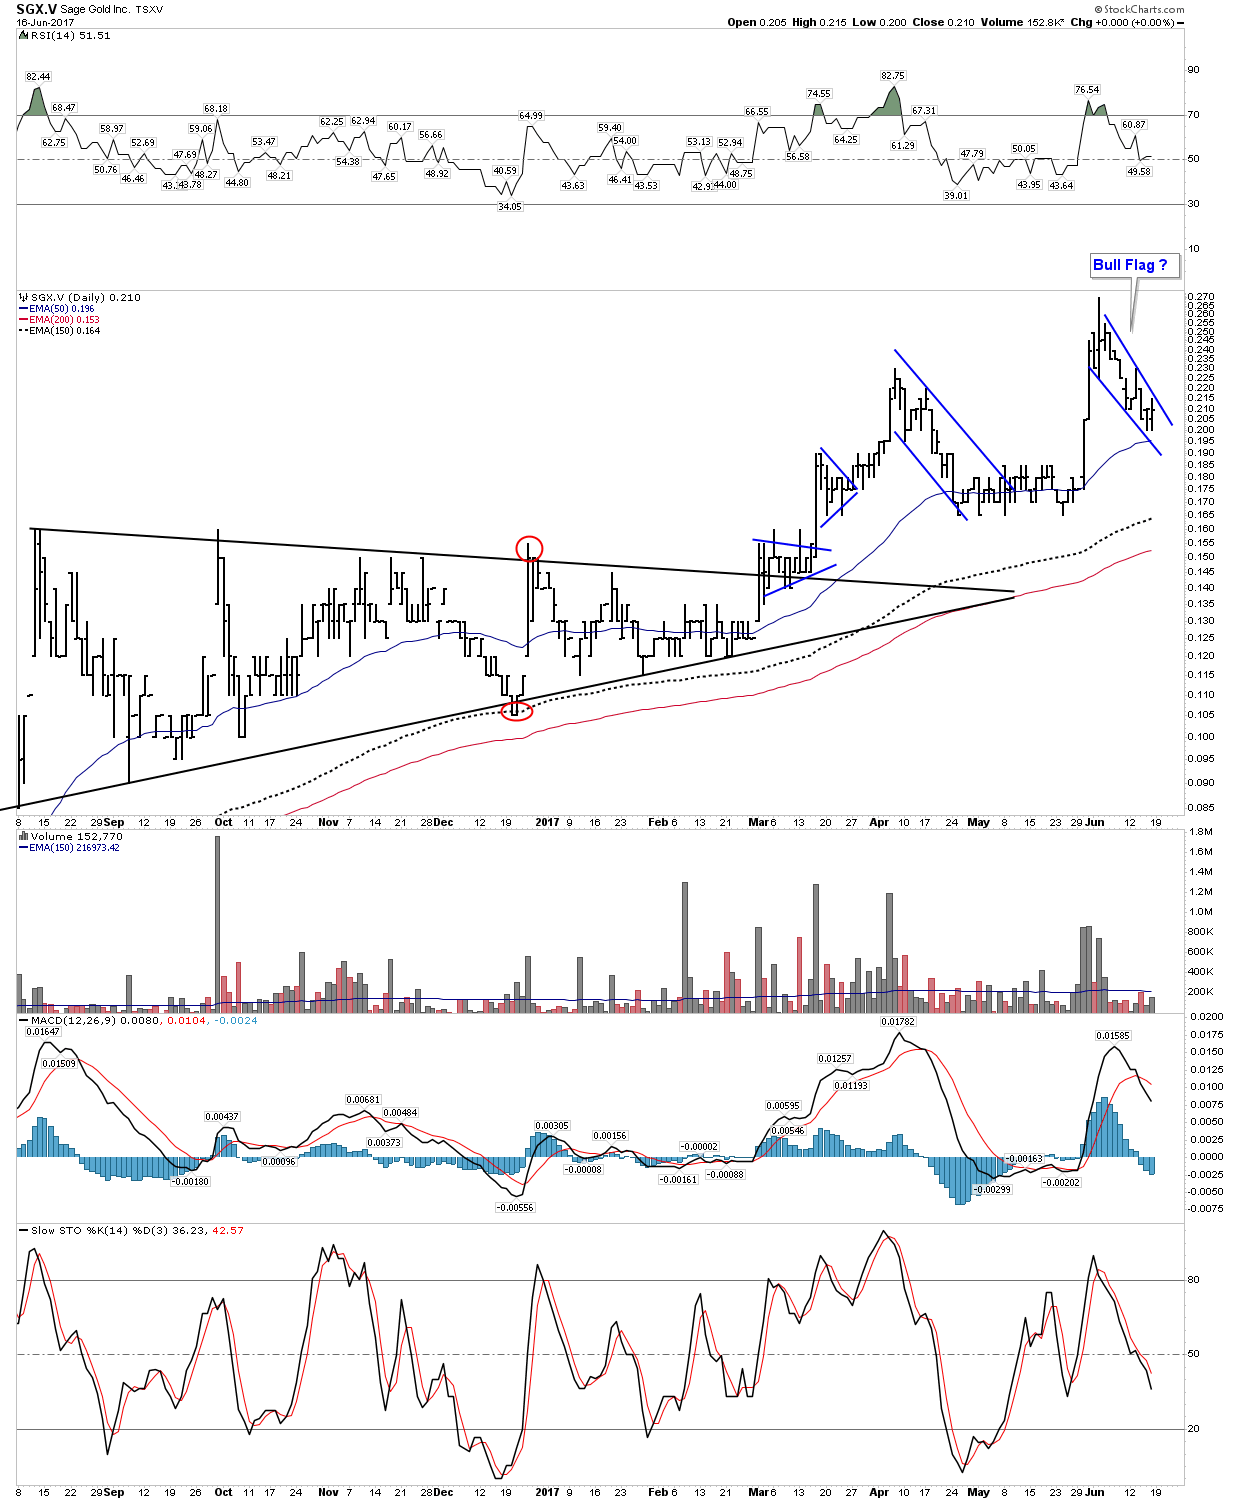
Finally, my favored micro-cap junior is Sage Gold. The chartology is superb, which is what initially got my attention. The spike up in late May was due to a brokerage house upgrade and now one can position oneself in the stock at pre-upgrade prices. It’s a buy.
Plunger’s Short Corner
I am introducing a new section called Plunger’s short corner. Yes, I am already short the oil market and the QQQ, however there’s lot’s more opportunity out there. This week I offer a quick review of the restaurant industry. Restaurant spending is the ultimate canary in the coal mine indicator. When times start to get tough and budgets come under strain disposable income directed towards eating out is the first to go. Spending in this sector typically turns down up to 2 years ahead of a recession. For the past year we have seen pressure in the industry and the marginal operations are showing it on their charts. Here are just a few:
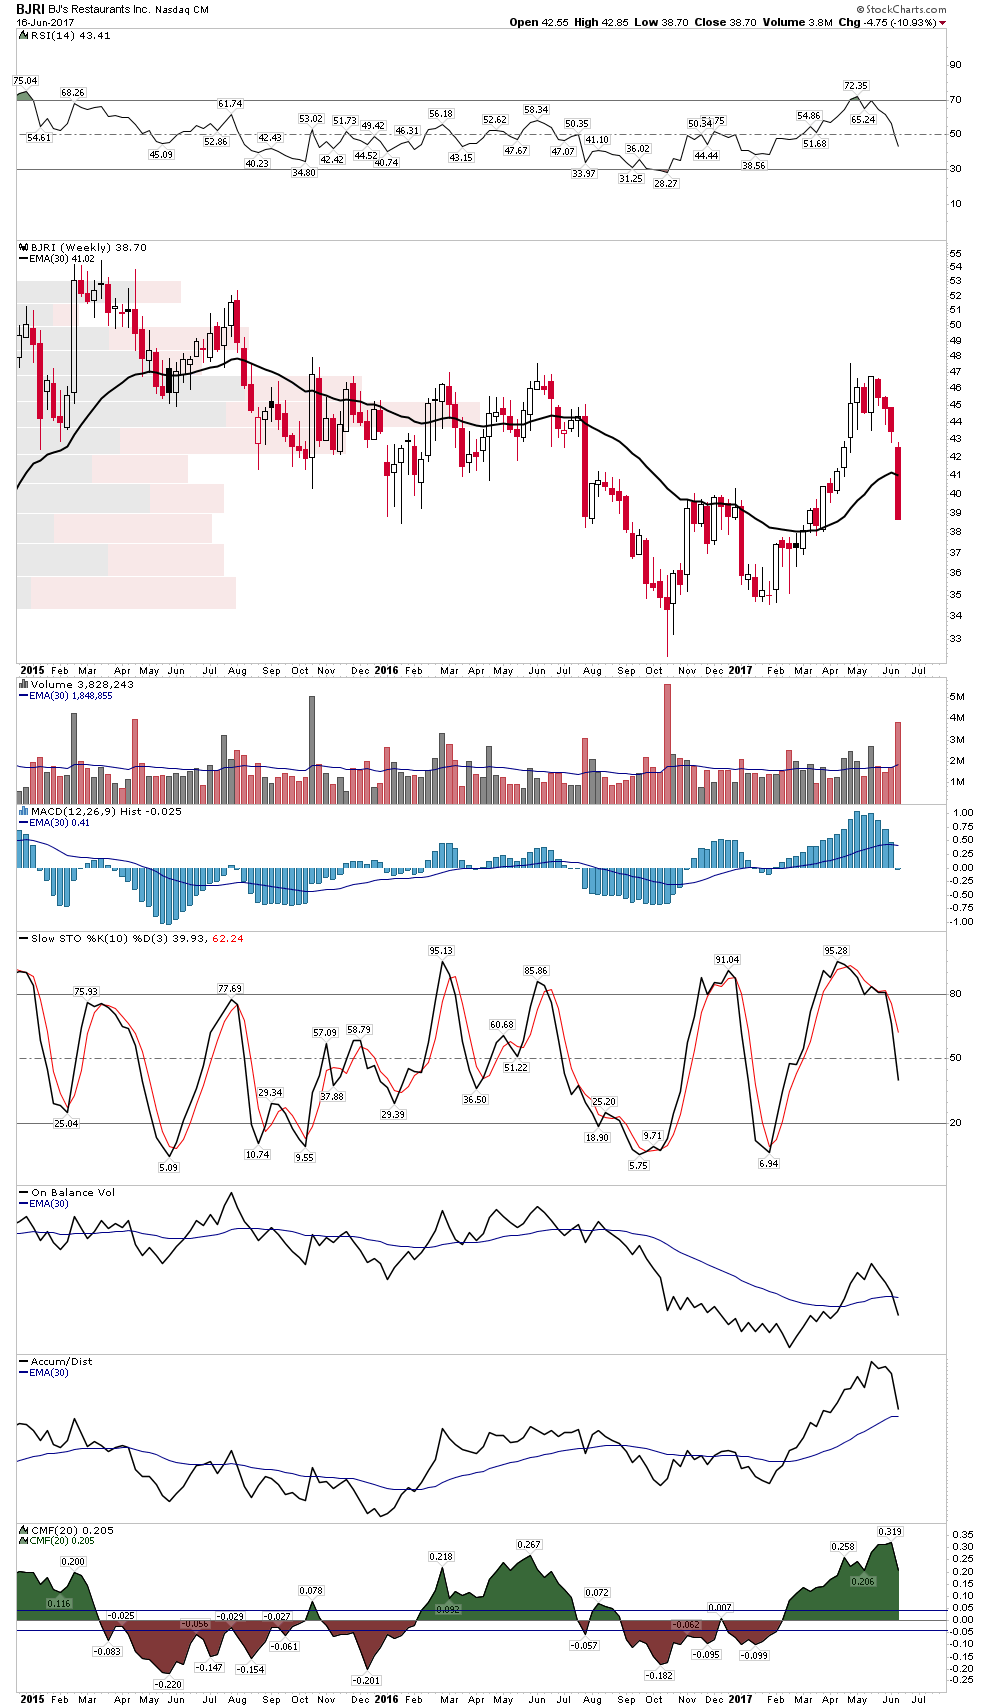
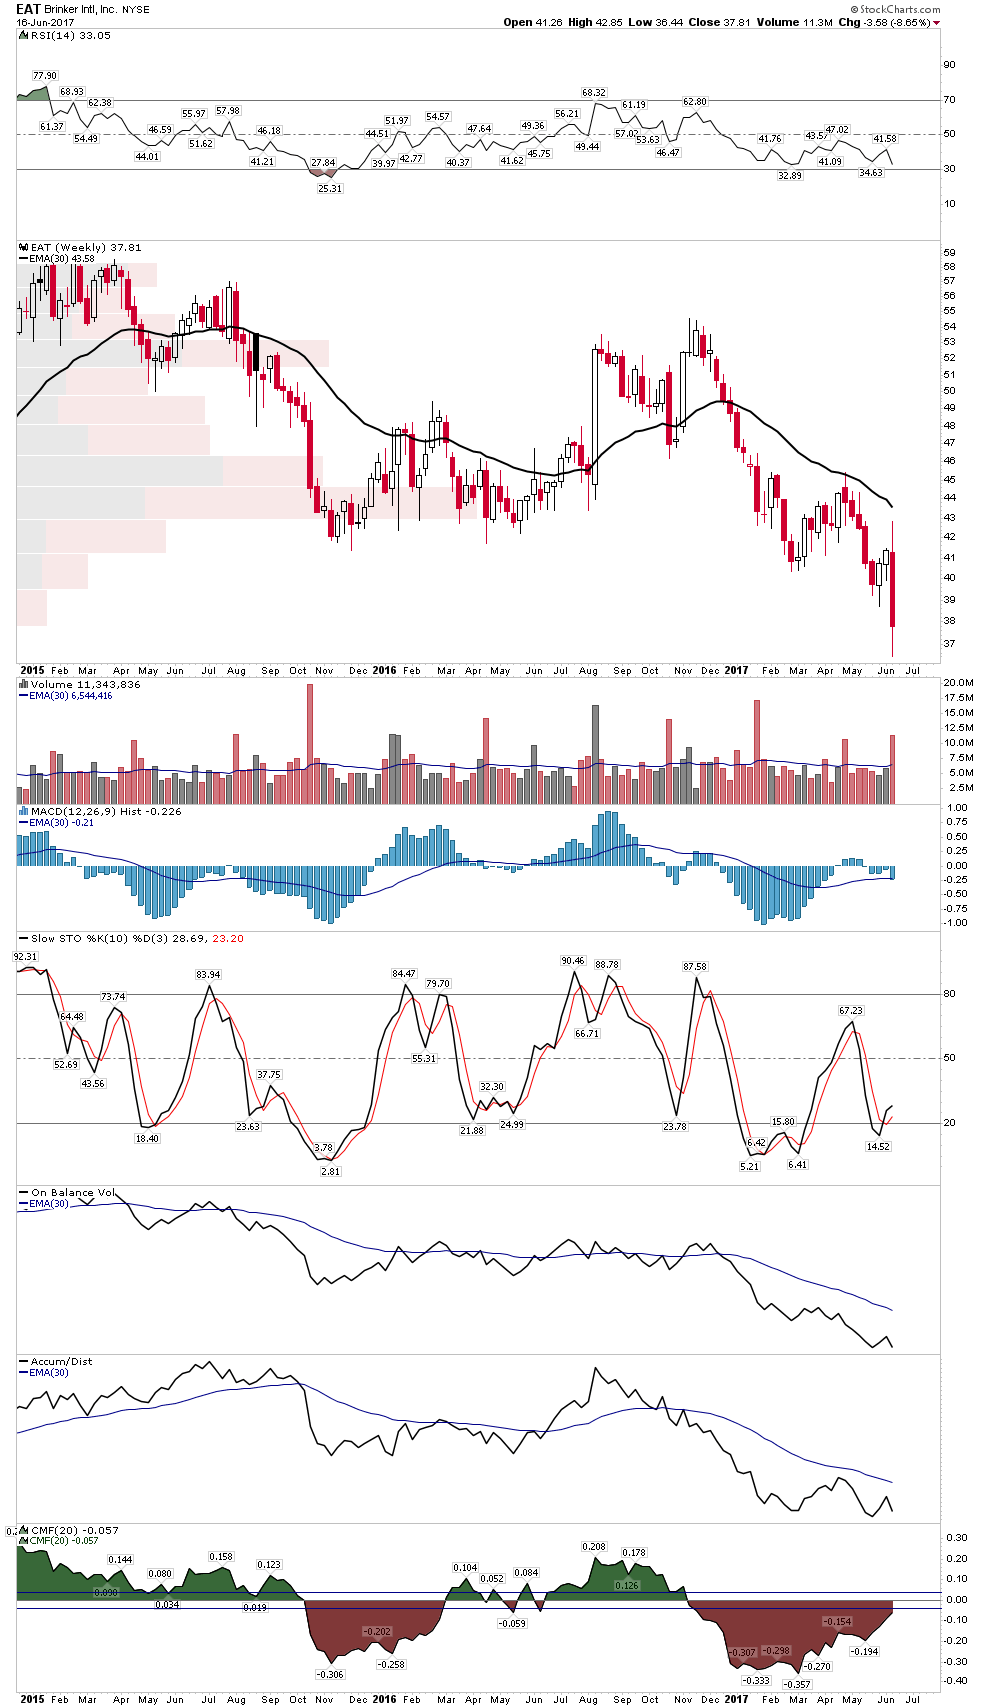
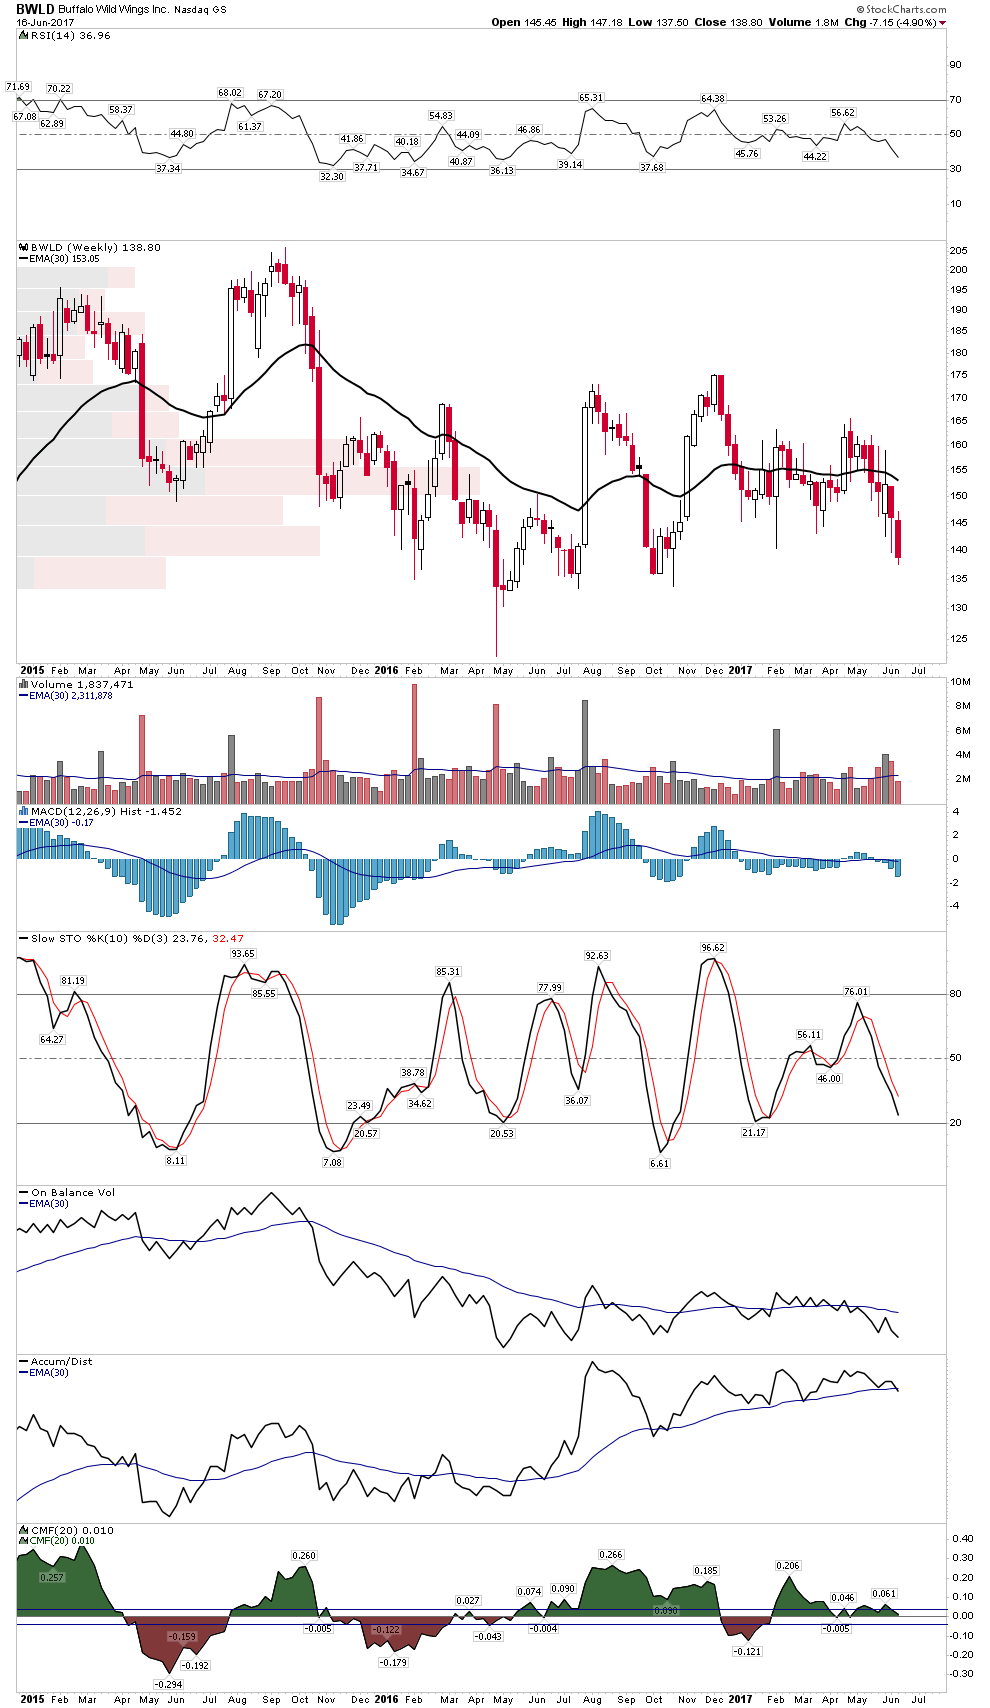
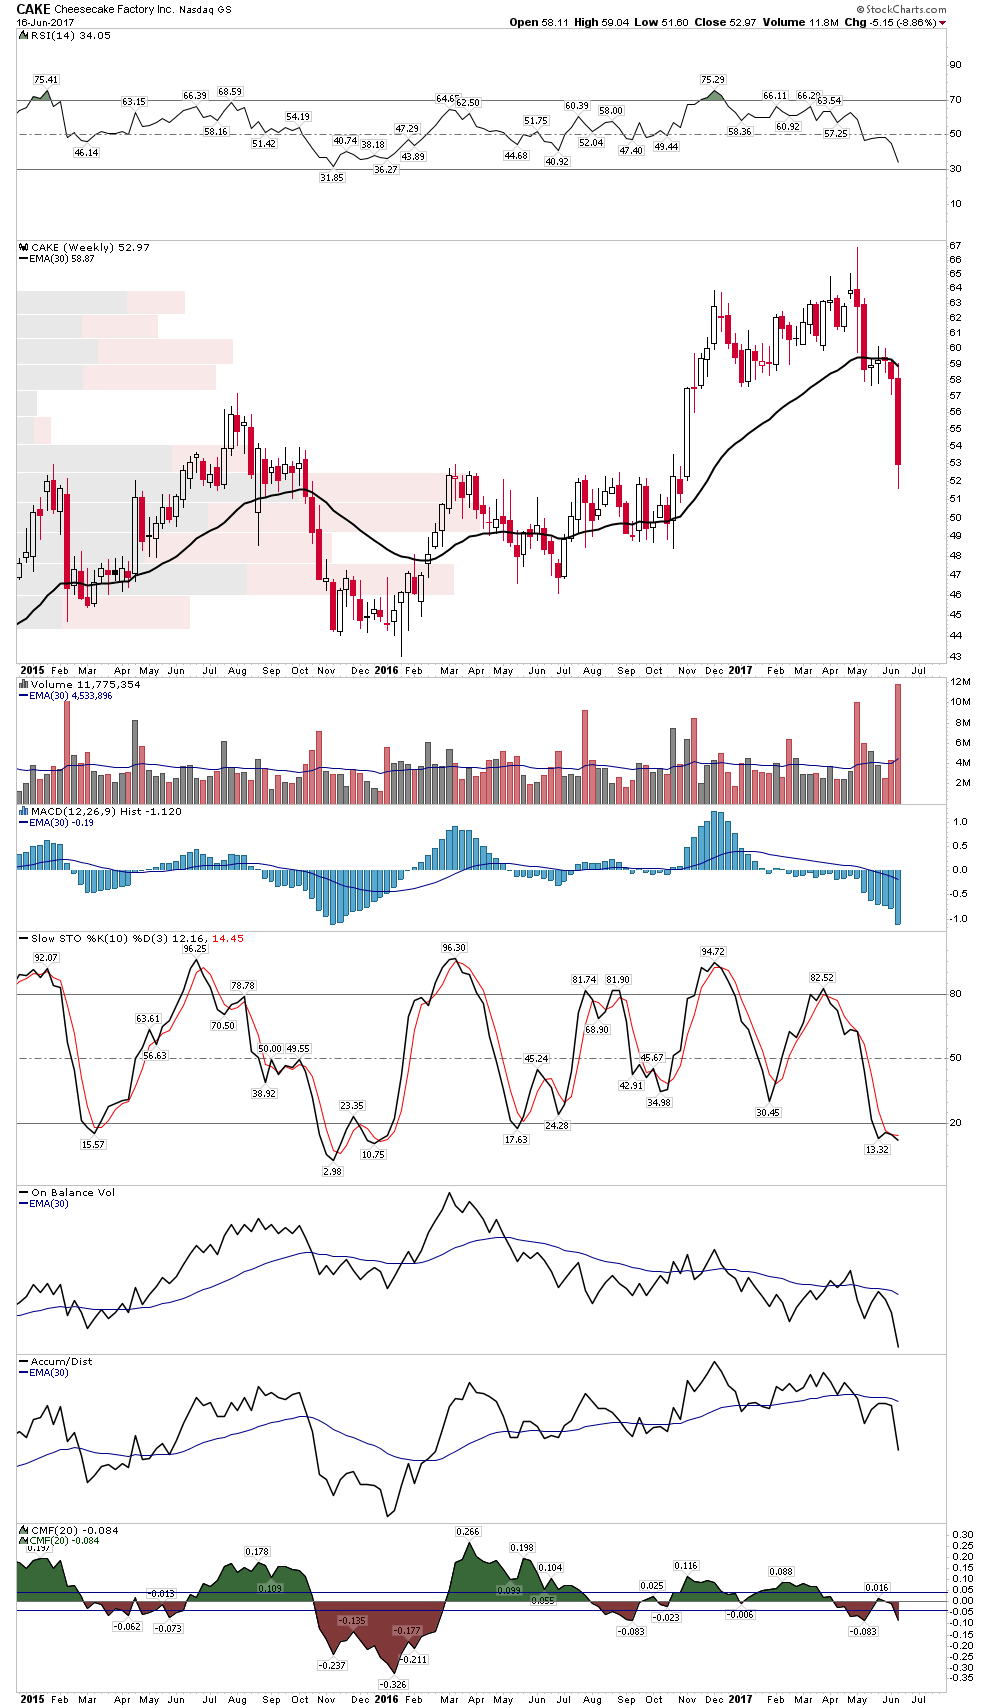
That’s right Knights… it’s getting ugly out there. If any of these stocks has the slightest bounce lay your line on them.
Conclusion
The average investor has little clue of how to operate in markets. He knows little more than to just repeat Wall Street marketing boilerplate. This is why he gets slammed at market turns and rides bear markets down. He can’t think for himself. Over the past 2 weeks we have reviewed the overall context of where we are in the market cycle and this week have put together a plan of action. We are thinking for ourselves. It has been Plunger’s Strategy session.