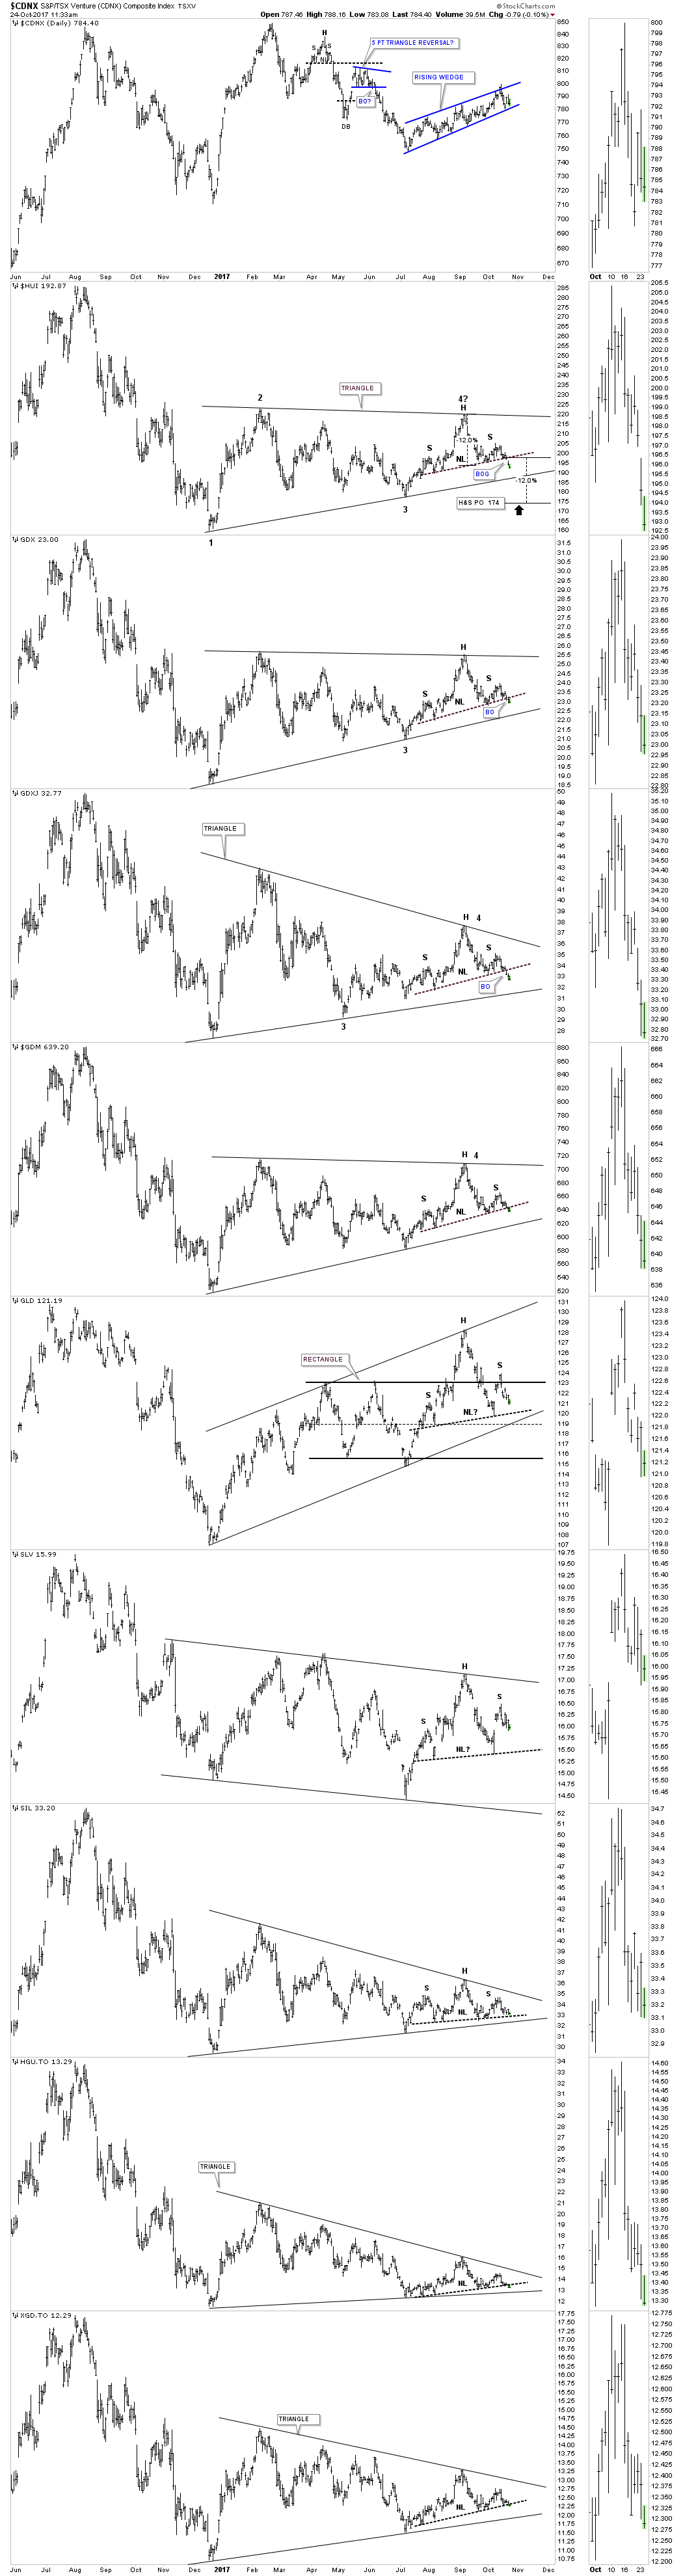
Today we are getting some more follow through to the downside as most of the necklines have now been broken. Note the breakout gap yesterday on the HUI which tells us our neckline was properly placed. The next important line of support is the bottom rail of the nearly one year triangle trading range. Keep in mind a backtest to the underside of the neckline can occur at anytime which should be expected, but not necessary. We could even see a ping pong move between the bottom rail of the triangle and the neckline before all is said and done.
With this H&S top forming at the 4th reversal point it’s telling us that the bottom rail of the triangle trading range is going to be broken to the downside by its measured move. Using the HUI as a proxy for the rest of the PM stock indexes the H&S top at the 4th reversal point measures down to the 174 area which is well below the bottom rail of the triangle trading range.
The last bit of information this combo chart is showing us is that GLD and SLV are showing relative strength to the PM stock indexes as they are still trading well above their respective necklines. Normally you would like to see the PM stocks leading GLD and SLV in a strong rally which isn’t the case right now.