
For almost a year now the PM stock indexes have been building out a triangle trading range that has yet to be determined if it is going to be a consolidation pattern or a reversal pattern. With big patterns one can lose sight of what is really there, as the longer a trading range develops the more trendlines one puts on a chart, and the more confusing things become.
Tonight I would like to show you, from a Chartology perspective, what the basic patterns are, from the short term to the longer term. The bigger a trading range the more chart patterns can develop before we see the final product. Sometimes it’s totally different from the early stages of the trading range. It’s important to clear ones mind of all the preconceived notions of what they think is happening to just what the charts are suggesting. It’s a hard thing for most investors to do because of all the things we read each and everyday which works on our subconscious. More than anything else we are playing a game of psychological warfare.
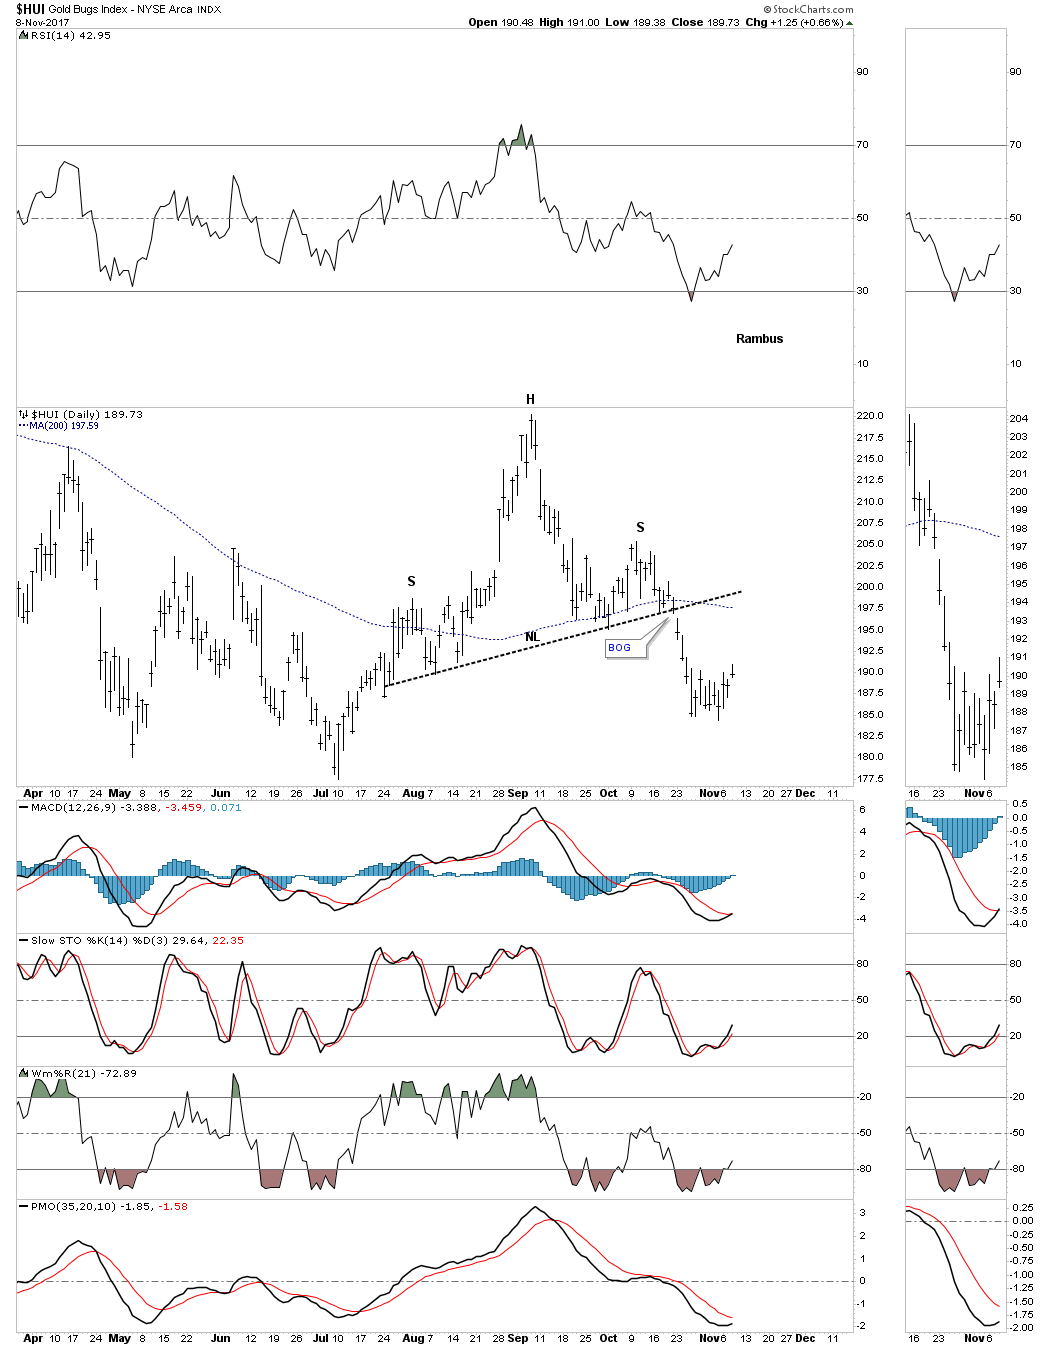
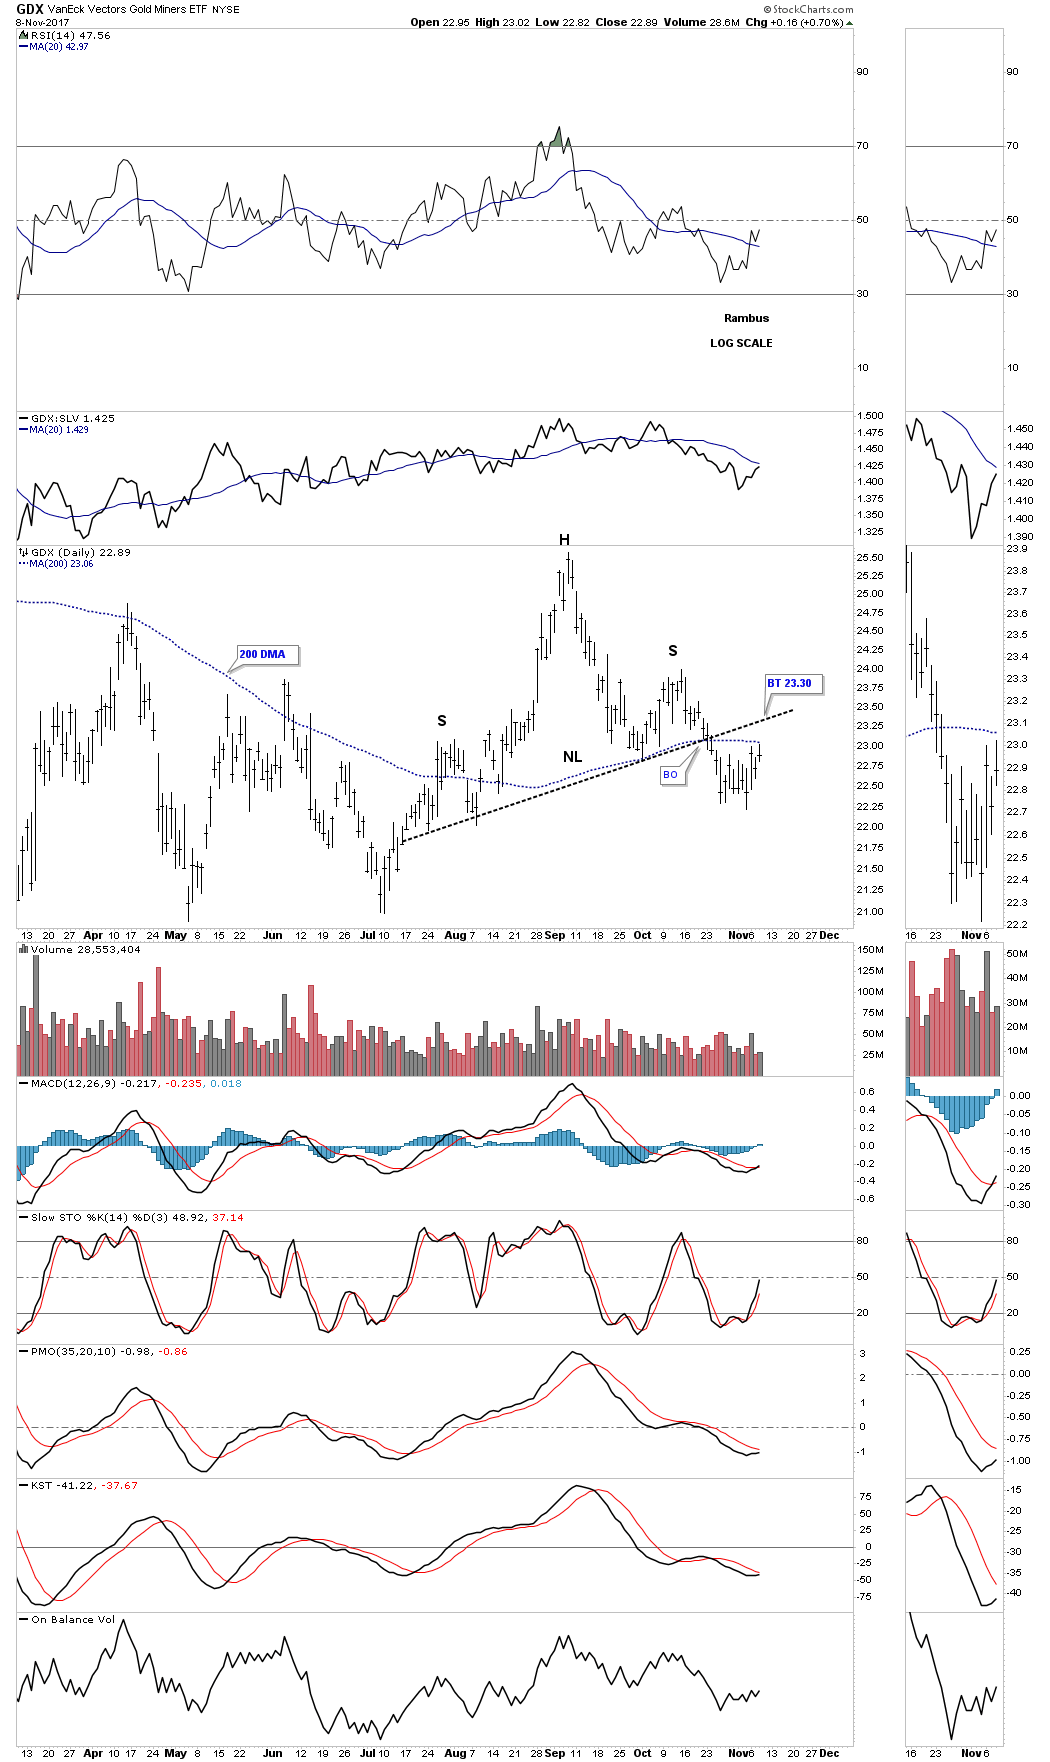
Lets start by looking at a short term daily chart for the HUI which is showing the H&S top we’ve been following since early October. The H&S top is pretty symmetrical and the breakout below the neckline was accompanied by a breakout gap. This is what we know to be true at this point in time. If the price action can trade back above the neckline then this scenario will be thrown out the window, but until that time the H&S top is valid. Also when the neckline gave way so did the 200 day moving average.
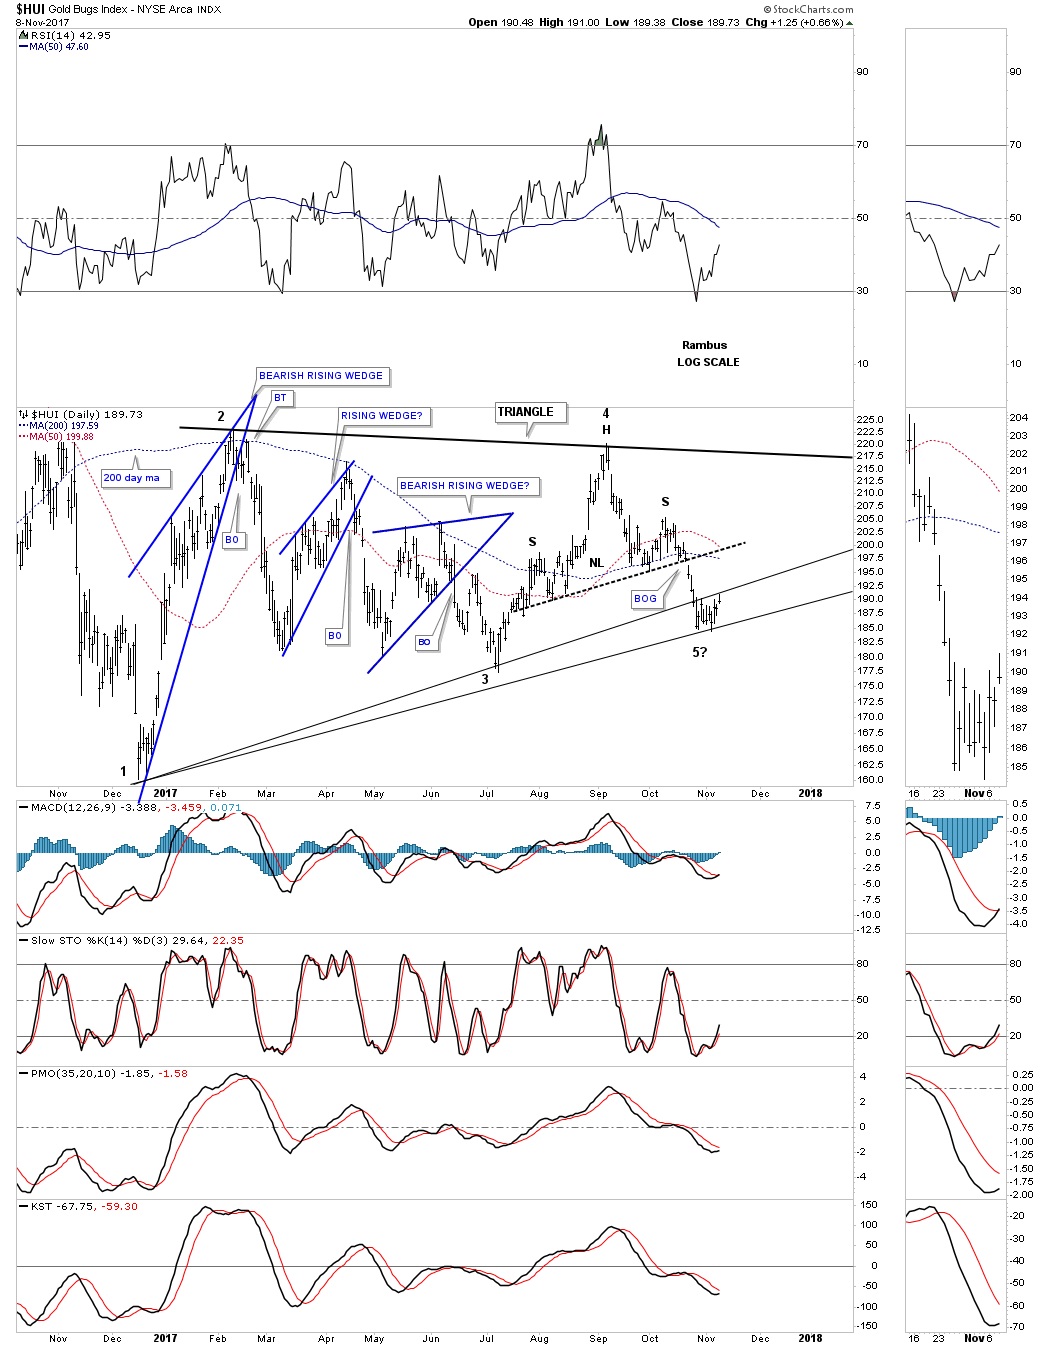
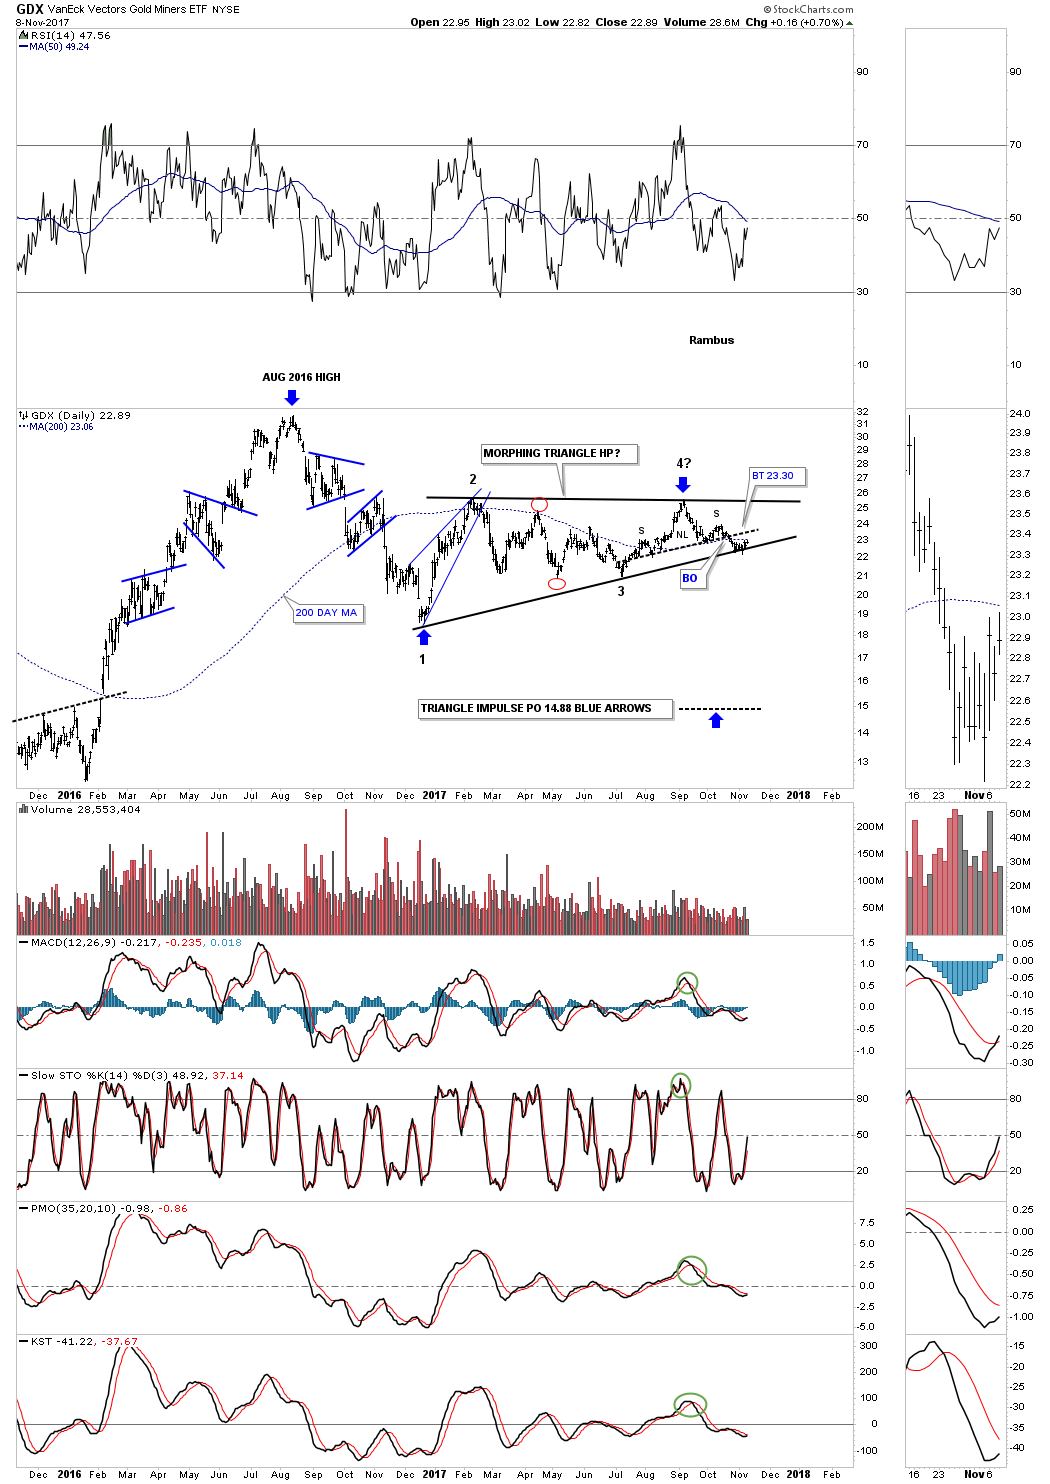
Next lets look back a little further back in time to see how the H&S top on the daily chart above fits into the bigger picture. Since the December low from last year this daily chart for the HUI shows the internal structure of the almost one year triangle trading range. As you can see the initial pattern was the big blue bearish falling wedge which shows the height of the triangle. Normally when you see a wedge pattern buildout the price objective will be where the wedge began to buildout. In this case the blue rising wedge should have had a price objective down to the December 2016 low at reversal point # one. The failure of the price objective to be reached was our first clue that a trading range of some kind may develop.
As you can see, two more blue rising wedges built out as part of the bigger trading range and reached their minimum price objective, which was where the rising wedge started to form. The 4th chart pattern on this one year chart is the H&S top at the 4th reversal point. That H&S top at the 4th reversal point is strongly suggesting the bottom of the one year triangle is going to be broken to the downside, which still hasn’t happened yet.
In big trading ranges like this sometimes it’s hard to connect all the reversal points on one trendline so in this case I’ve added a second trendline which is showing two possible scenarios. Believe it or not the internal structure of this triangle is pretty typical of most big trading ranges. The only thing we have to see now is confirmation. There is also no law that says the triangle trading range has to breakdown from here. If one of the bottom trrendlines holds support it’s possible that a 5th reversal point can form and the trading range could be a reversal pattern to the upside. As I stated earlier though, the H&S top is strongly suggesting the bottom rail is going to give way, so we wait for confirmation.
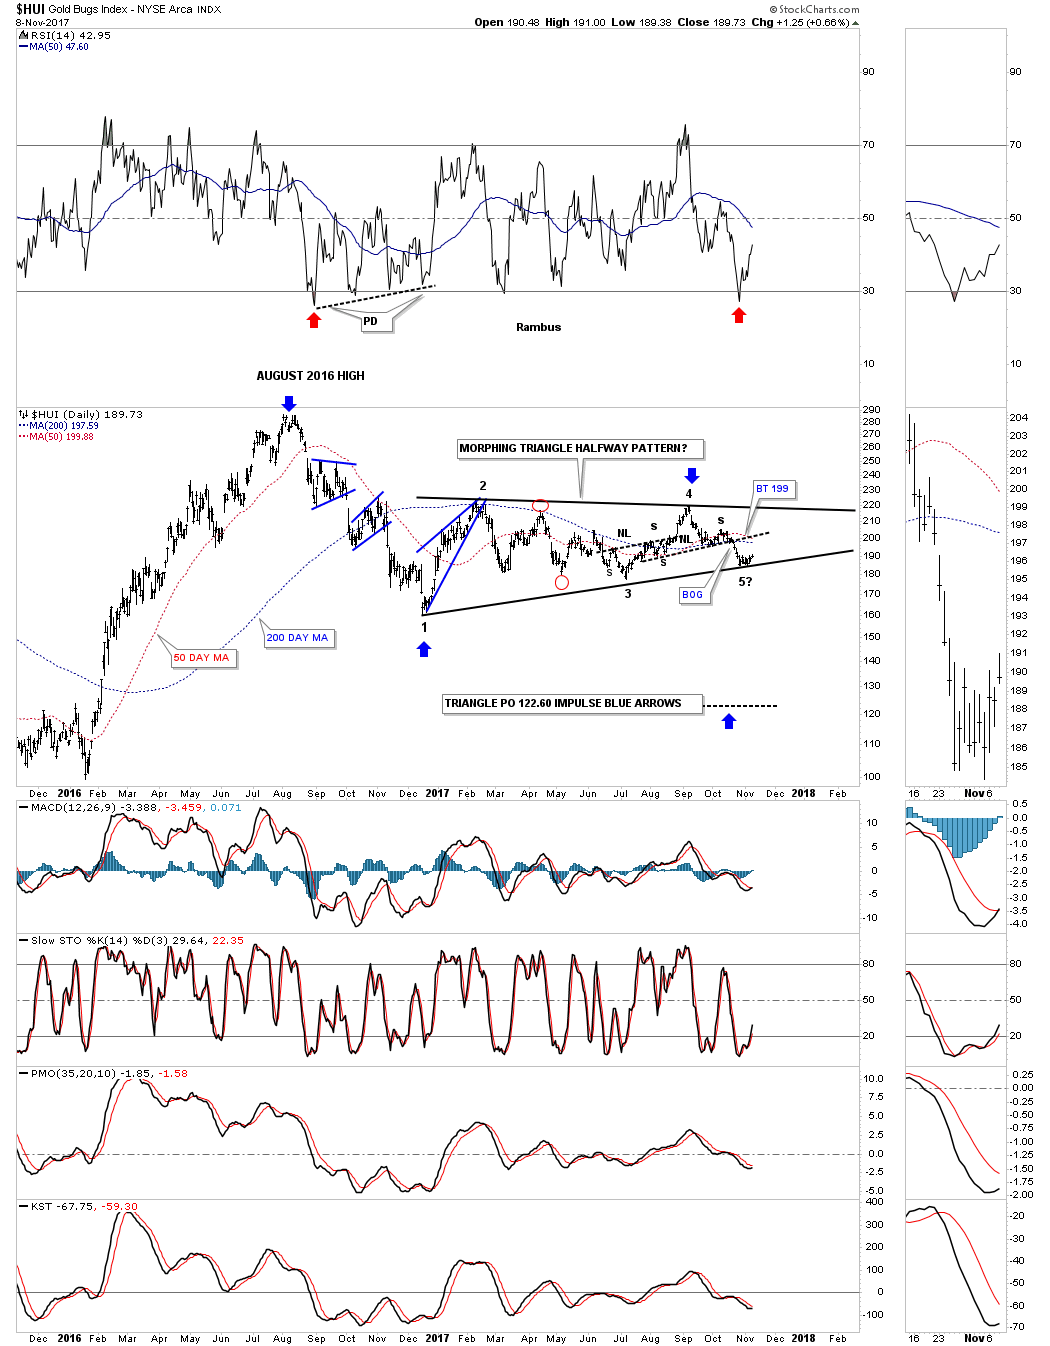
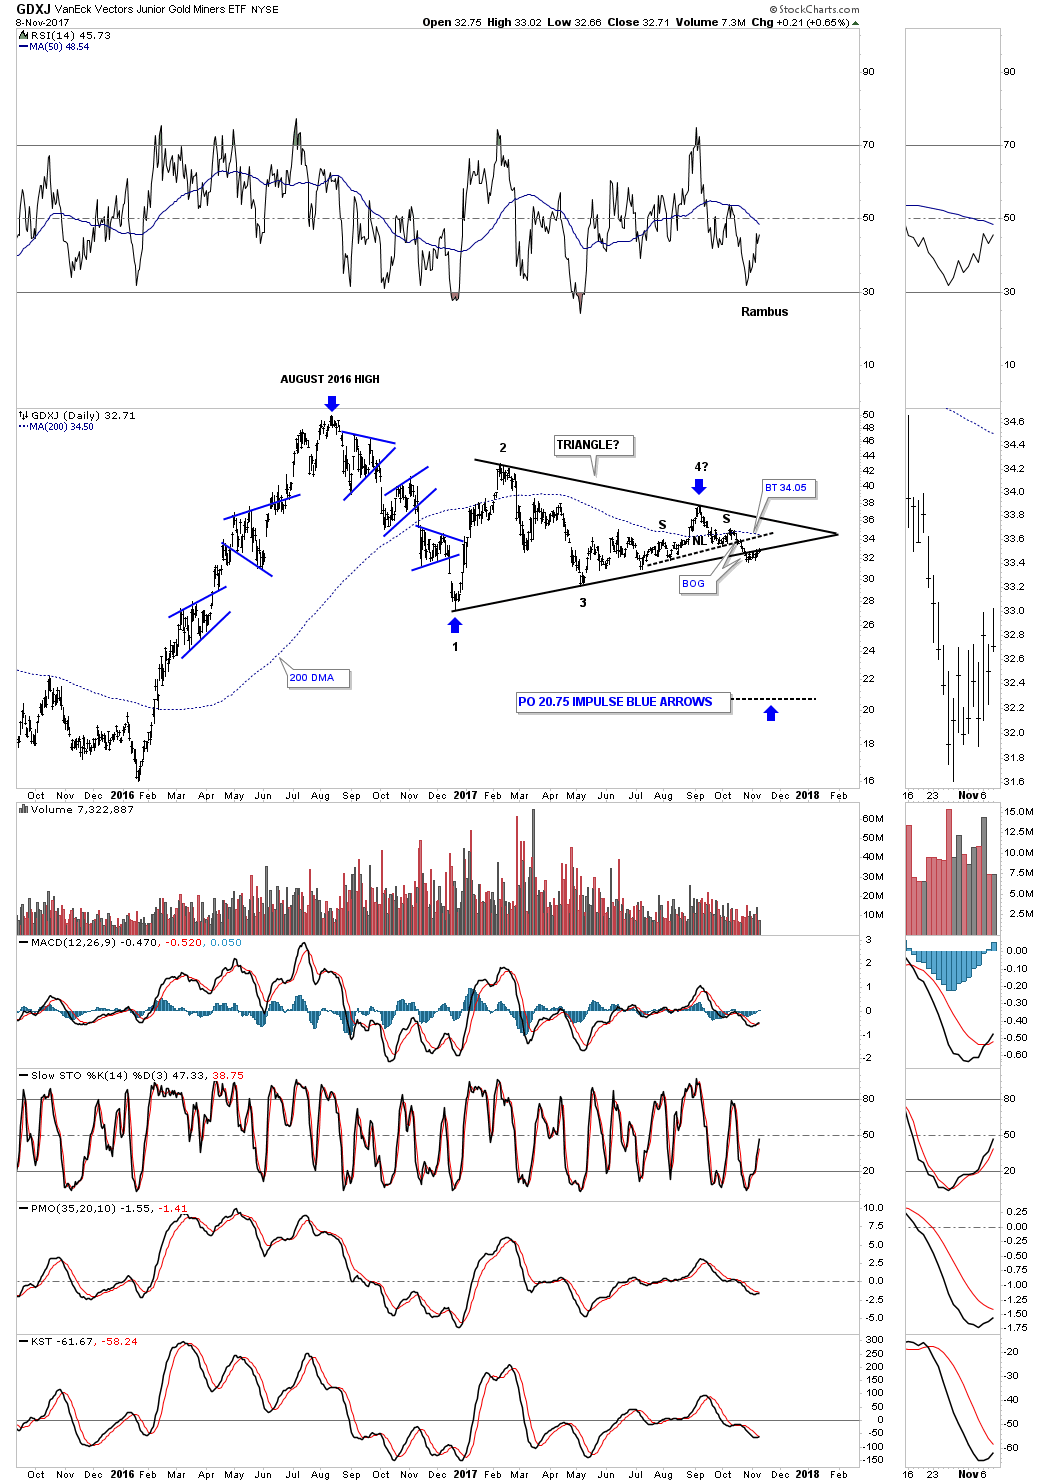
Now lets look at a 2 year daily chart for the HUI which puts the trading range on the chart above in perspective. Another clue that the triangle trading range may breakout to the downside is because it has formed below the August 2016 high as the main trend has been down. Here you can see reversal points #1 and #2 formed during the formation of the the bearish rising wedge. Reversal point #3 was created by the small H&S bottom, while the 4th reversal point was formed by the H&S top. If, and that is a big if, because the triangle hasn’t broken down yet, but if it does then the triangle would be a halfway pattern to the downside as shown by the blue arrows. The red arrows just under the RSI shows where the RSI was when the the last big move down began at the August 2016 high vs where the current RSI is at. The RSI built out a positive divergence until the price action finally bottomed a year ago in December.
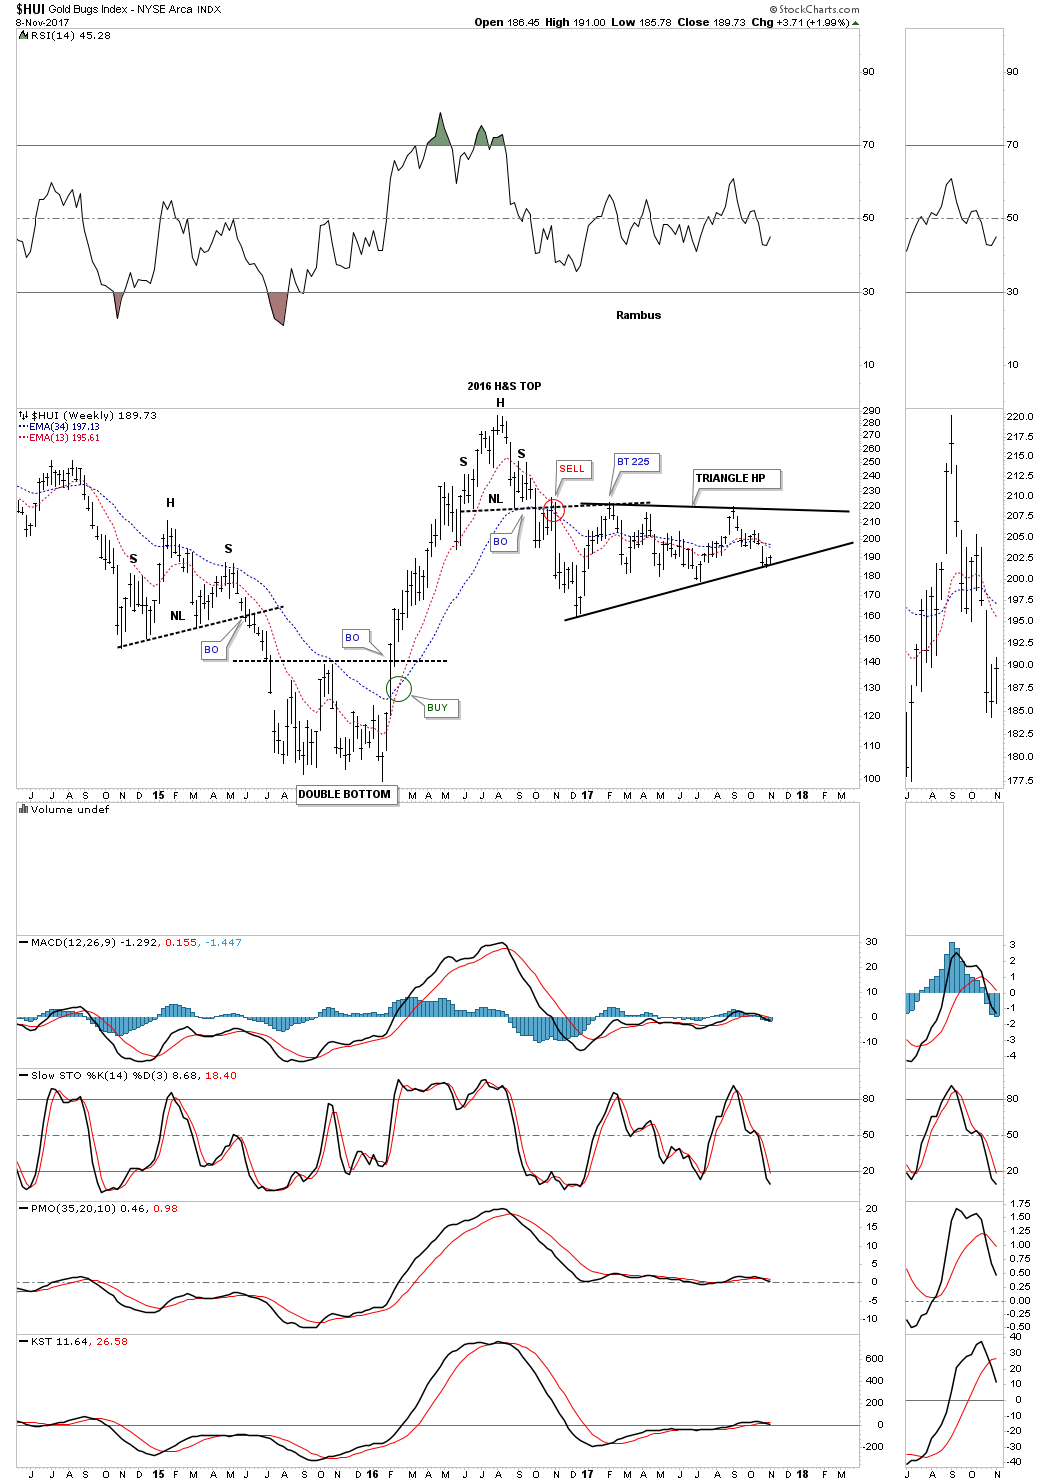
After the August 2016 top was put in place I got a lot of flack for showing a H&S top. I was told that everyone and their brother could see that H&S top so therefore it was invalid. Below is a 3 1/2 year weekly chart for the HUI which shows that August 2016 H&S top. As you can see the neckline has held resistance on two separate occasions when backtested from below. That H&S top will be invalidated when the neckline is broken to the upside.
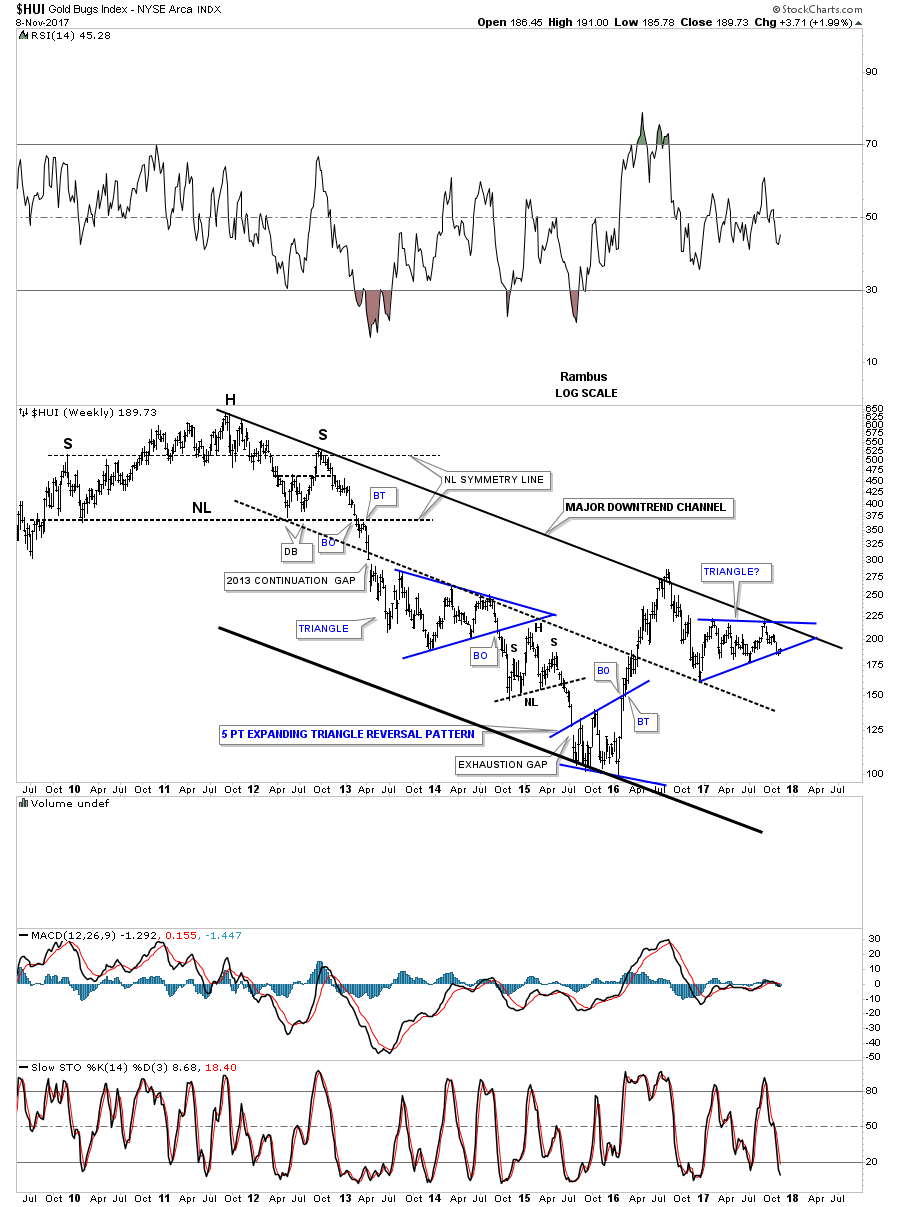
This next chart is a long term weekly look at the HUI that shows its massive 2011 H&S top with its bear market downtrend channel. Our current triangle has formed just below the top rail of the 2011 bear market downtrend channel, which is another clue that the triangle may break to the downside. This is the area where the bulls need to step up to the plate and produce a strong move higher to negate what all the charts above are suggesting.
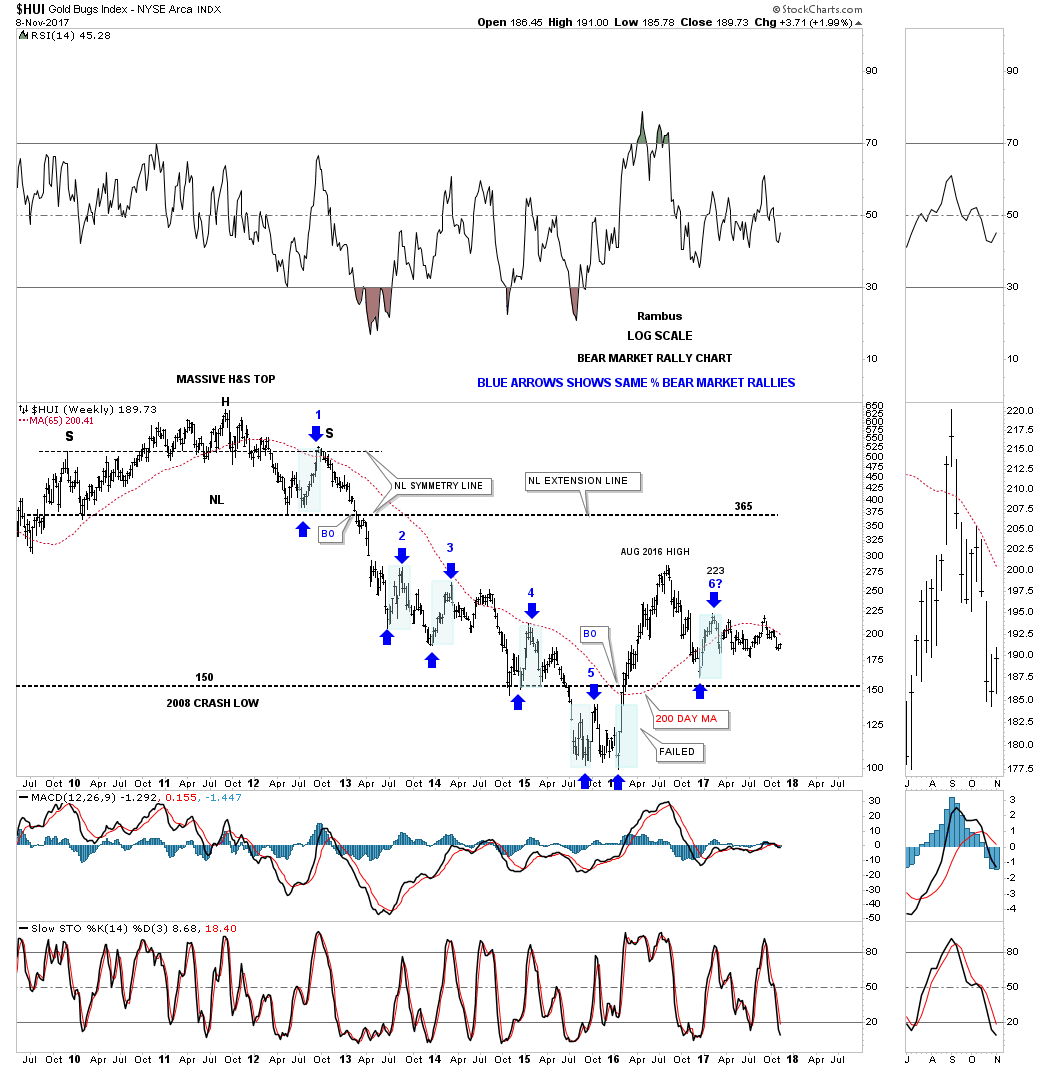
The last time we looked at this next chart for the HUI the price action was closing in on the 223 area which was showing the same percentage bear market rallies. As you can see every bear market rally since the right shoulder high on that massive H&S top all were exactly the same height as shown by the blue shaded areas. The only exception was the 2016 rally. The HUI has made two attempts to takeout the bear market rally high at the 223 area, but so far has failed to do so. That would be a bullish development if the bulls could show their strength and make a higher high above 223.
I won’t go into a lot of detail with these next charts as we’ve already covered that information on the HUI charts above. Below is a short term daily chart for the GDX which shows its small H&S top. Today the GDX tested its 200 day ma from below.
GDX daily:
GDX weekly short term:
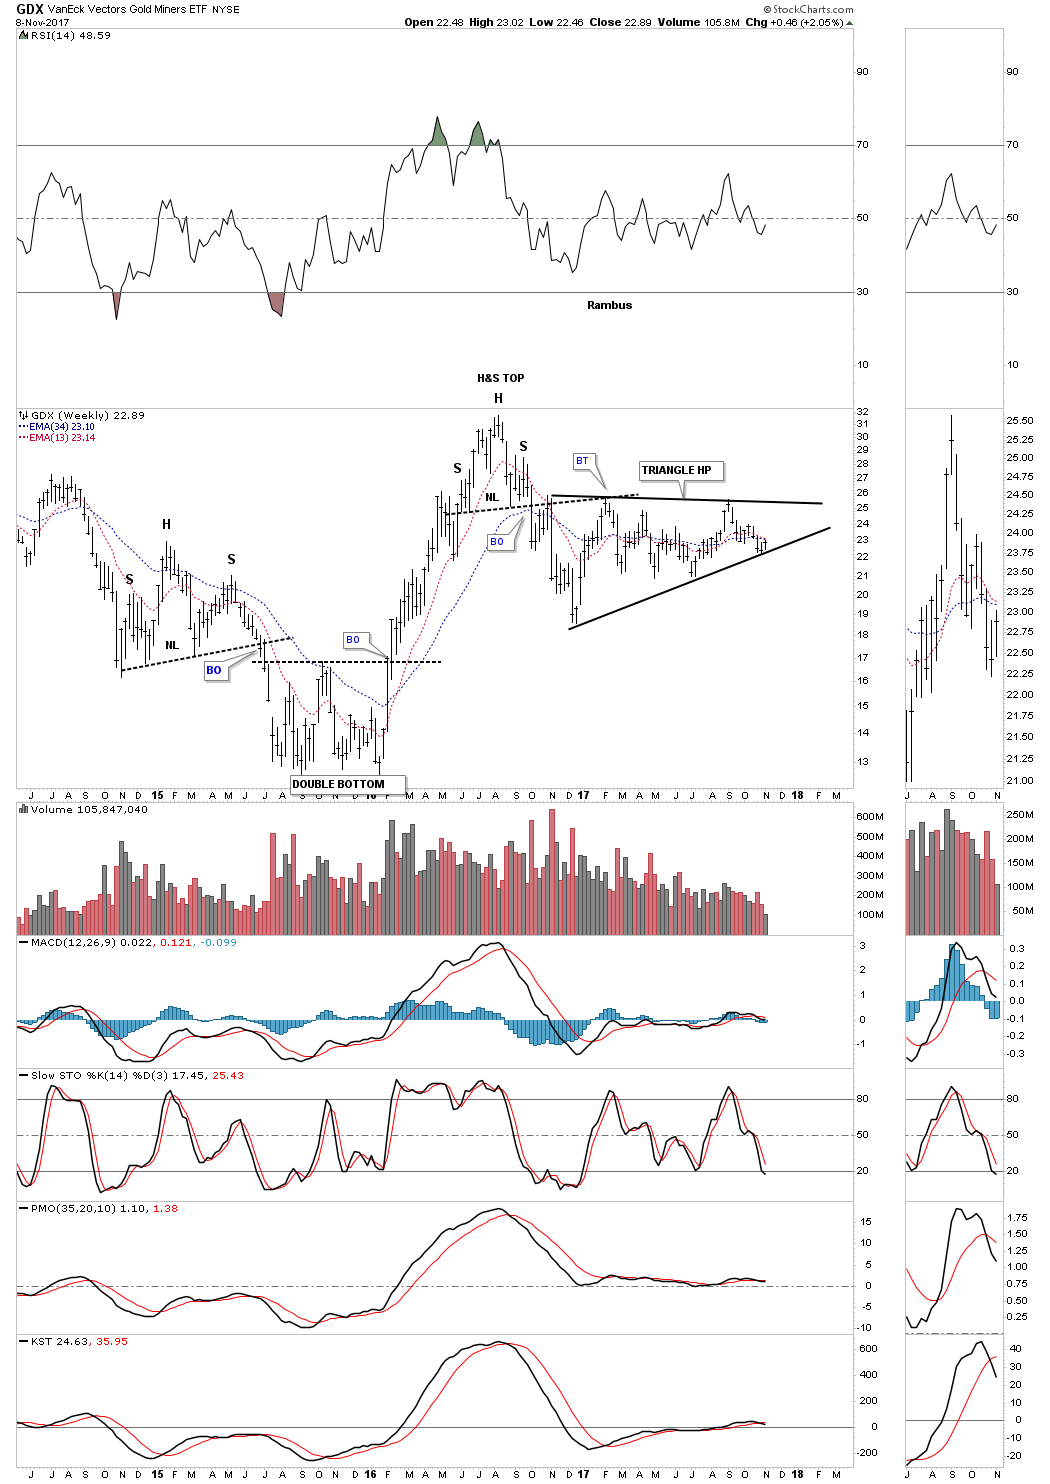
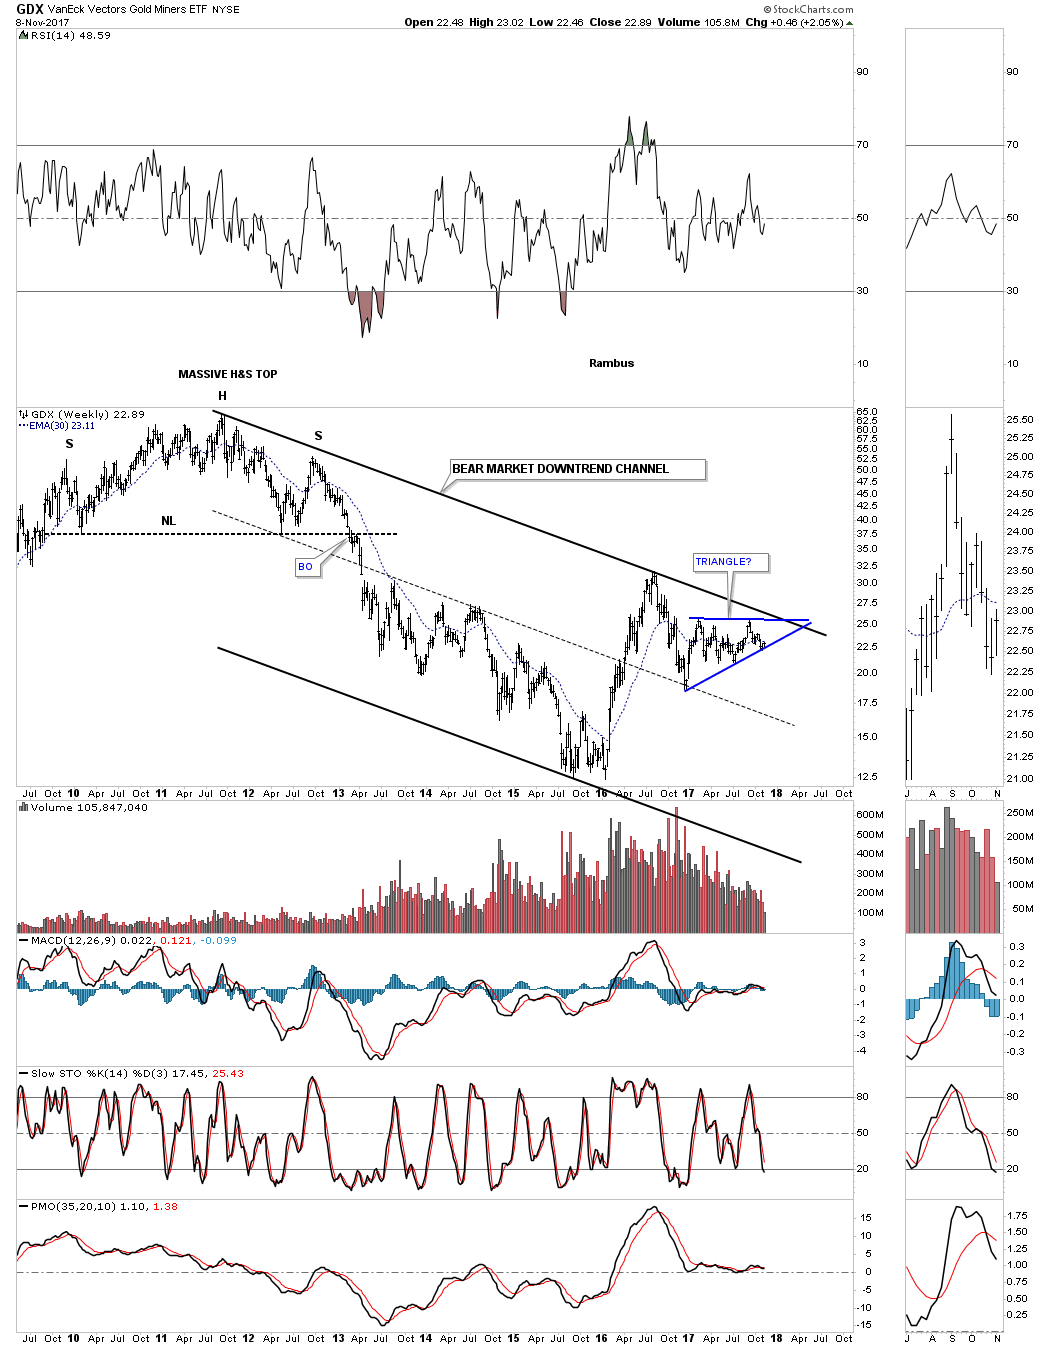
GDX weekly long term:
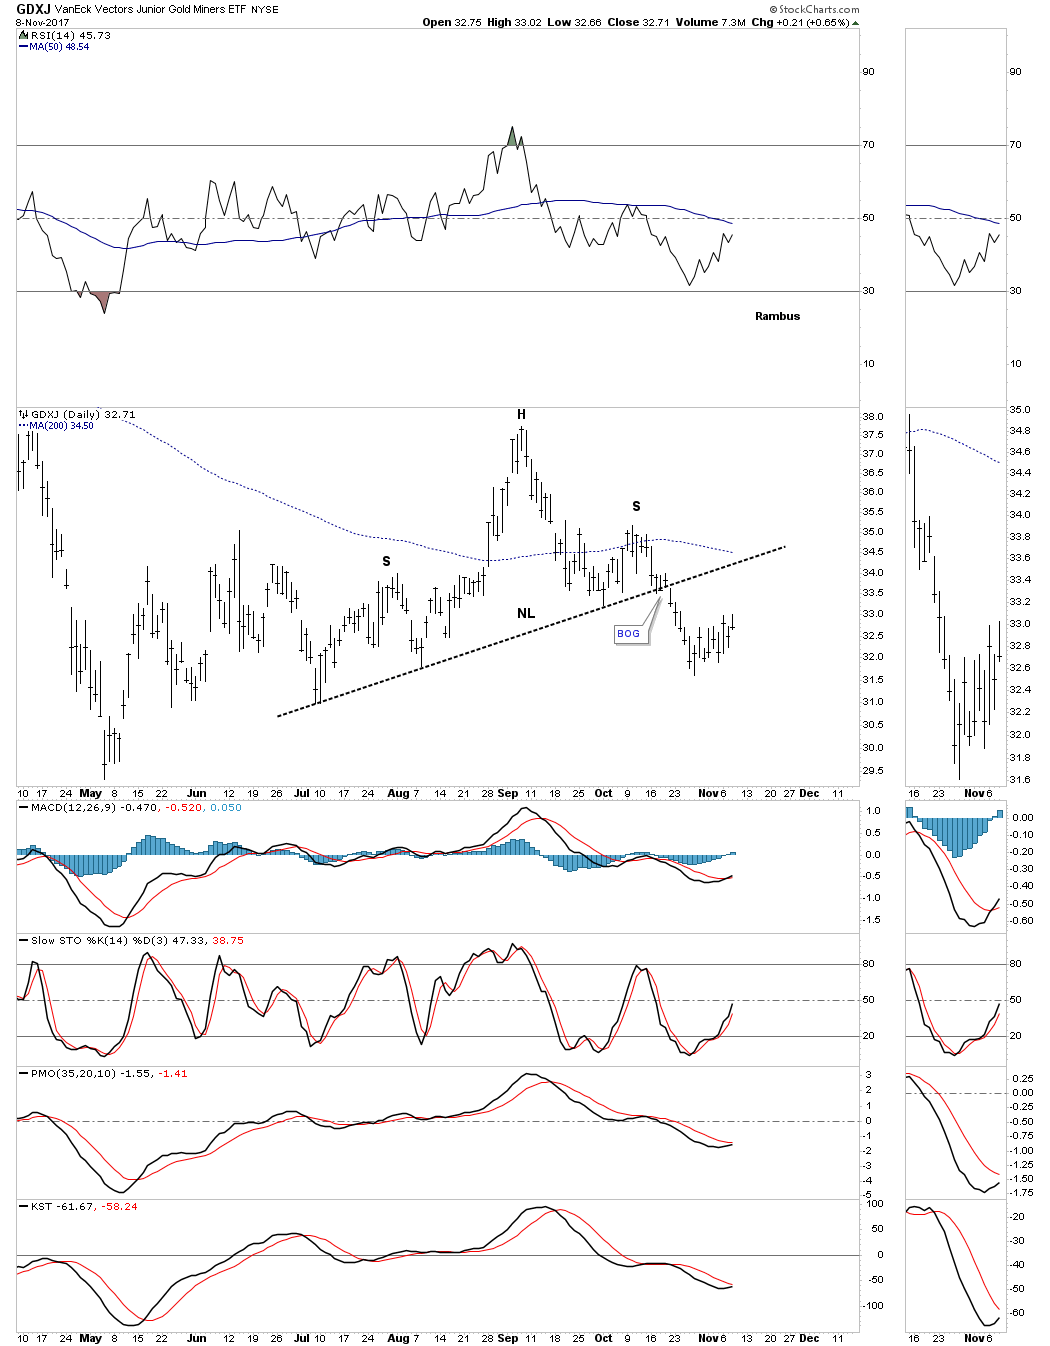
GDXJ daily short term:
GDXJ long term daily:
GDXJ short term weekly:

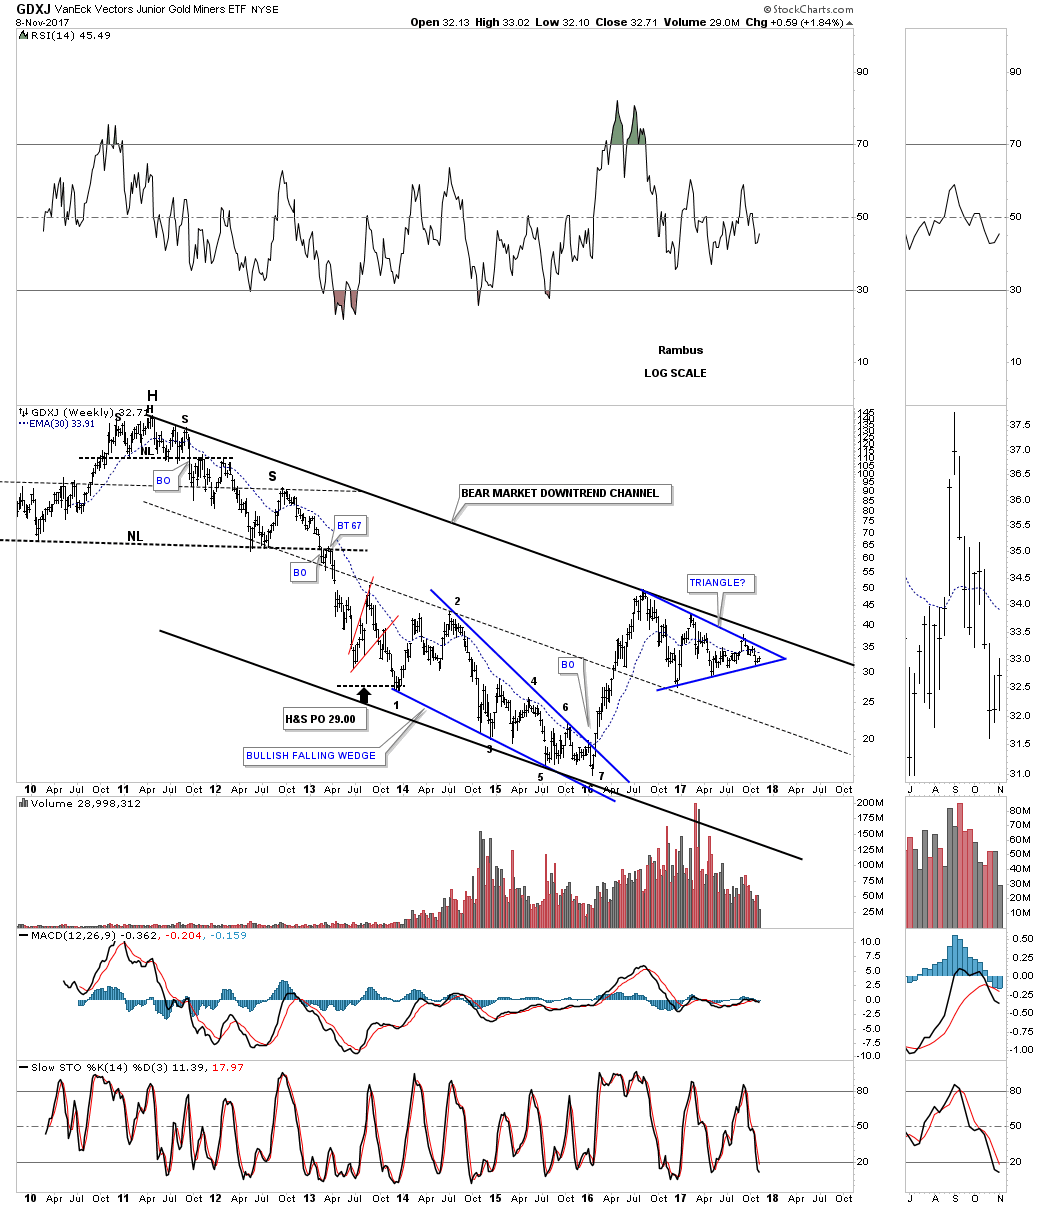
GDXJ long term weekly:
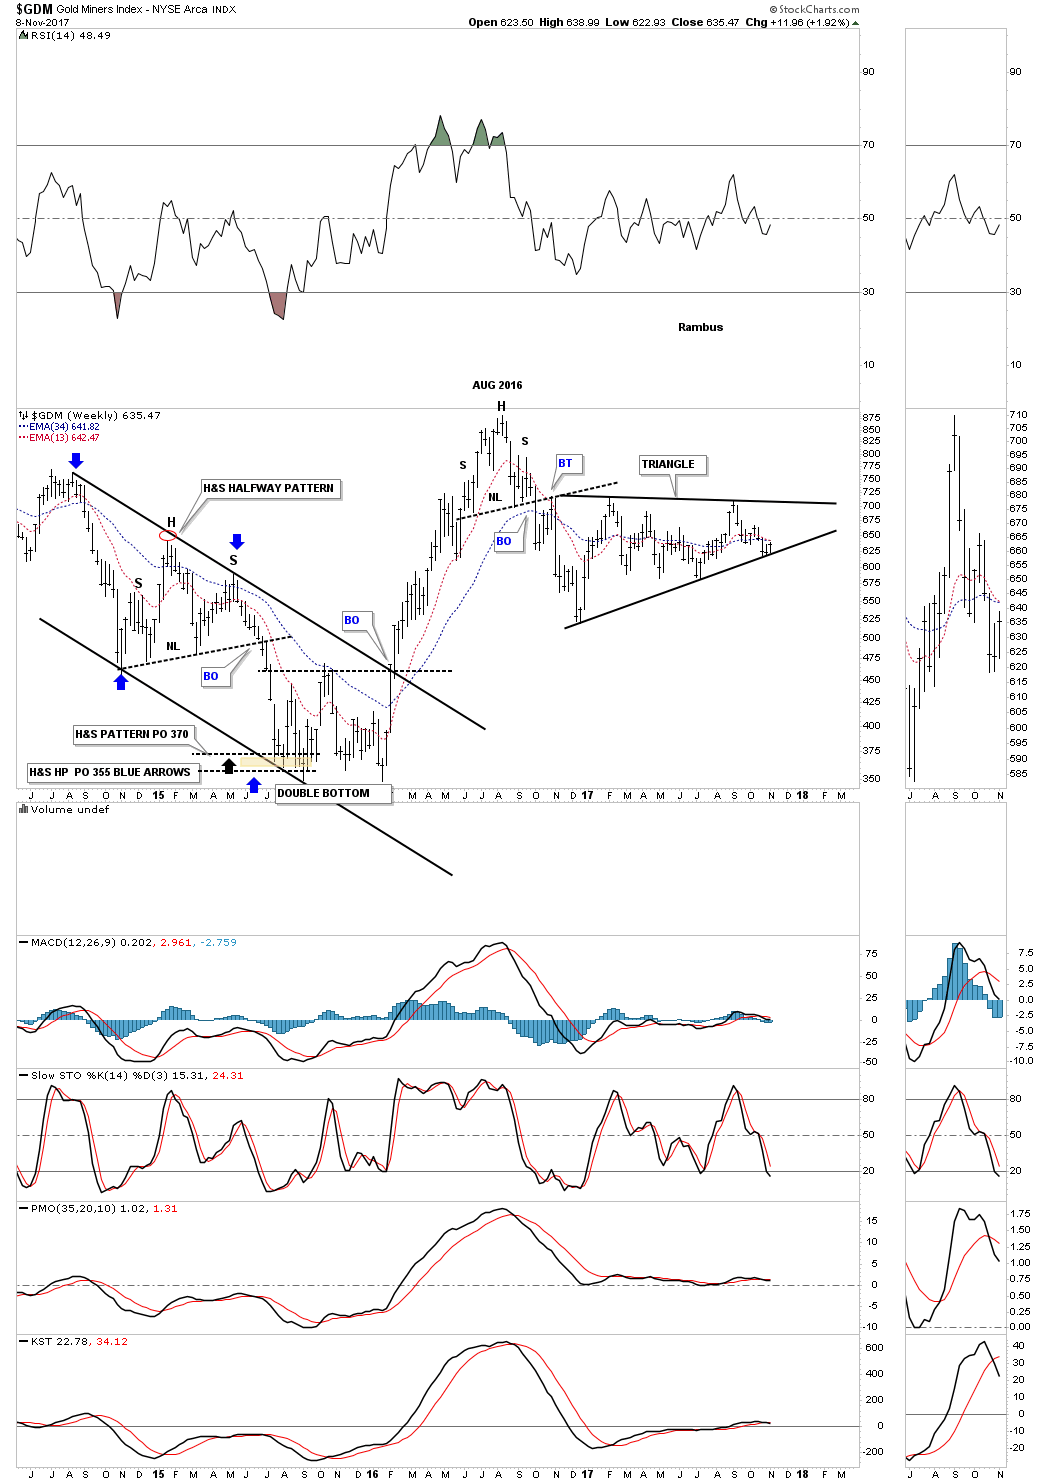
GDM weekly:
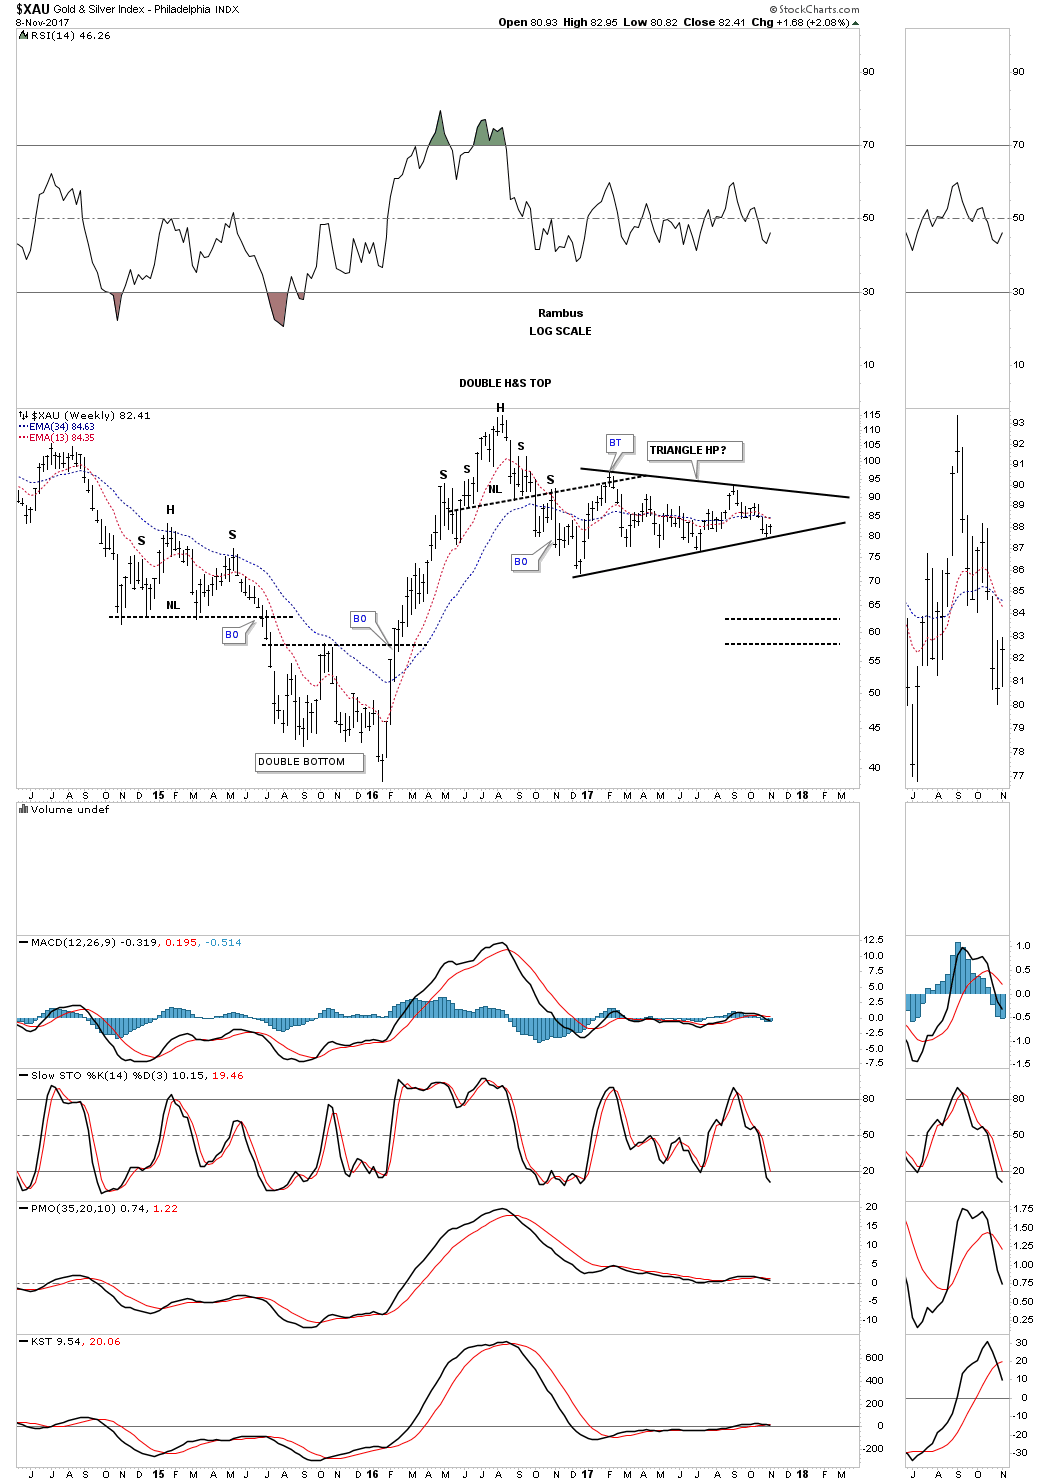
XAU weekly:
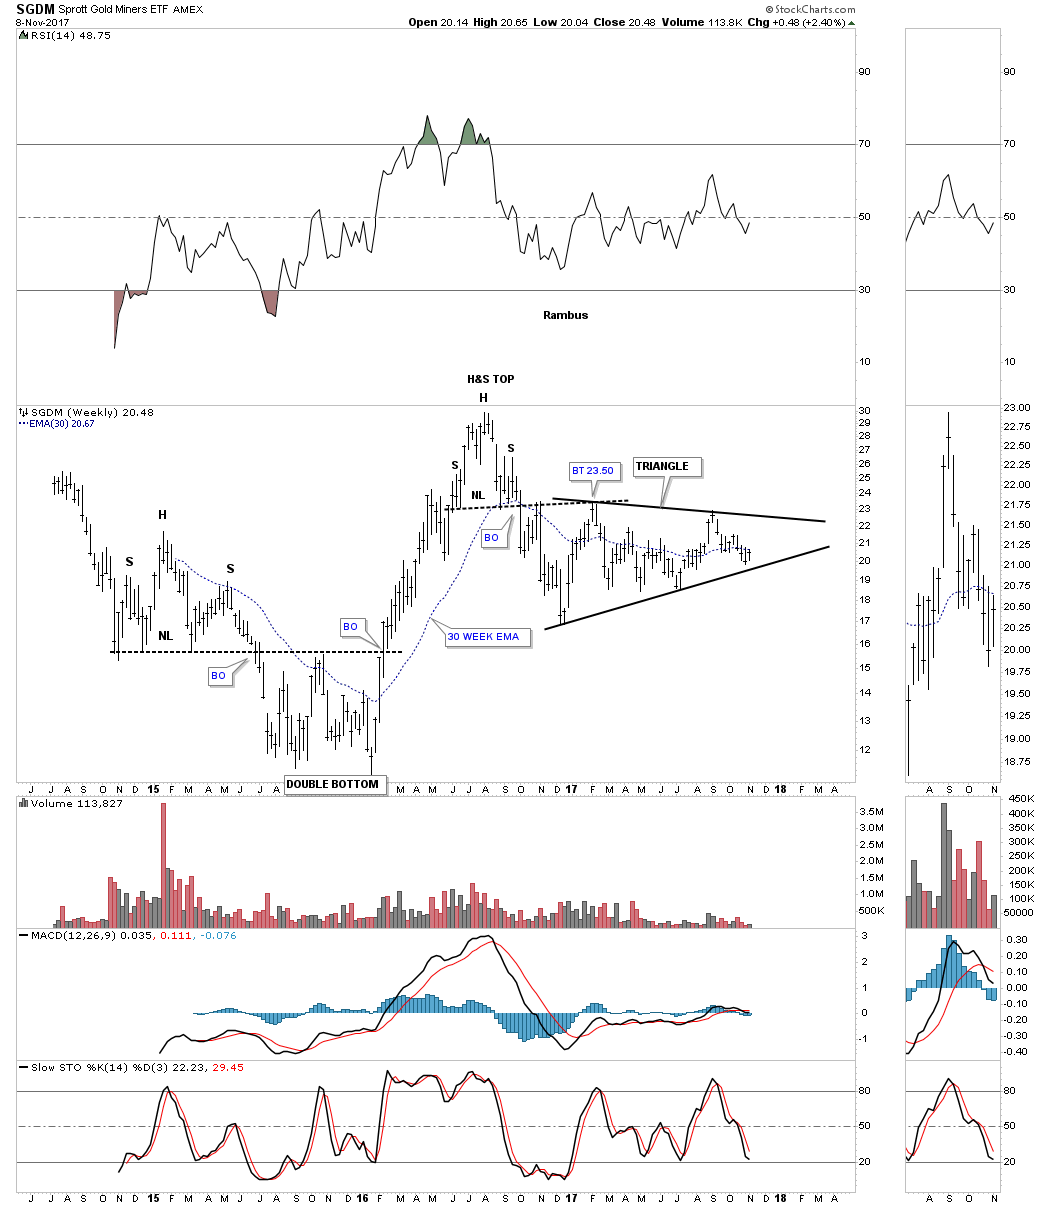
SGDM weekly:
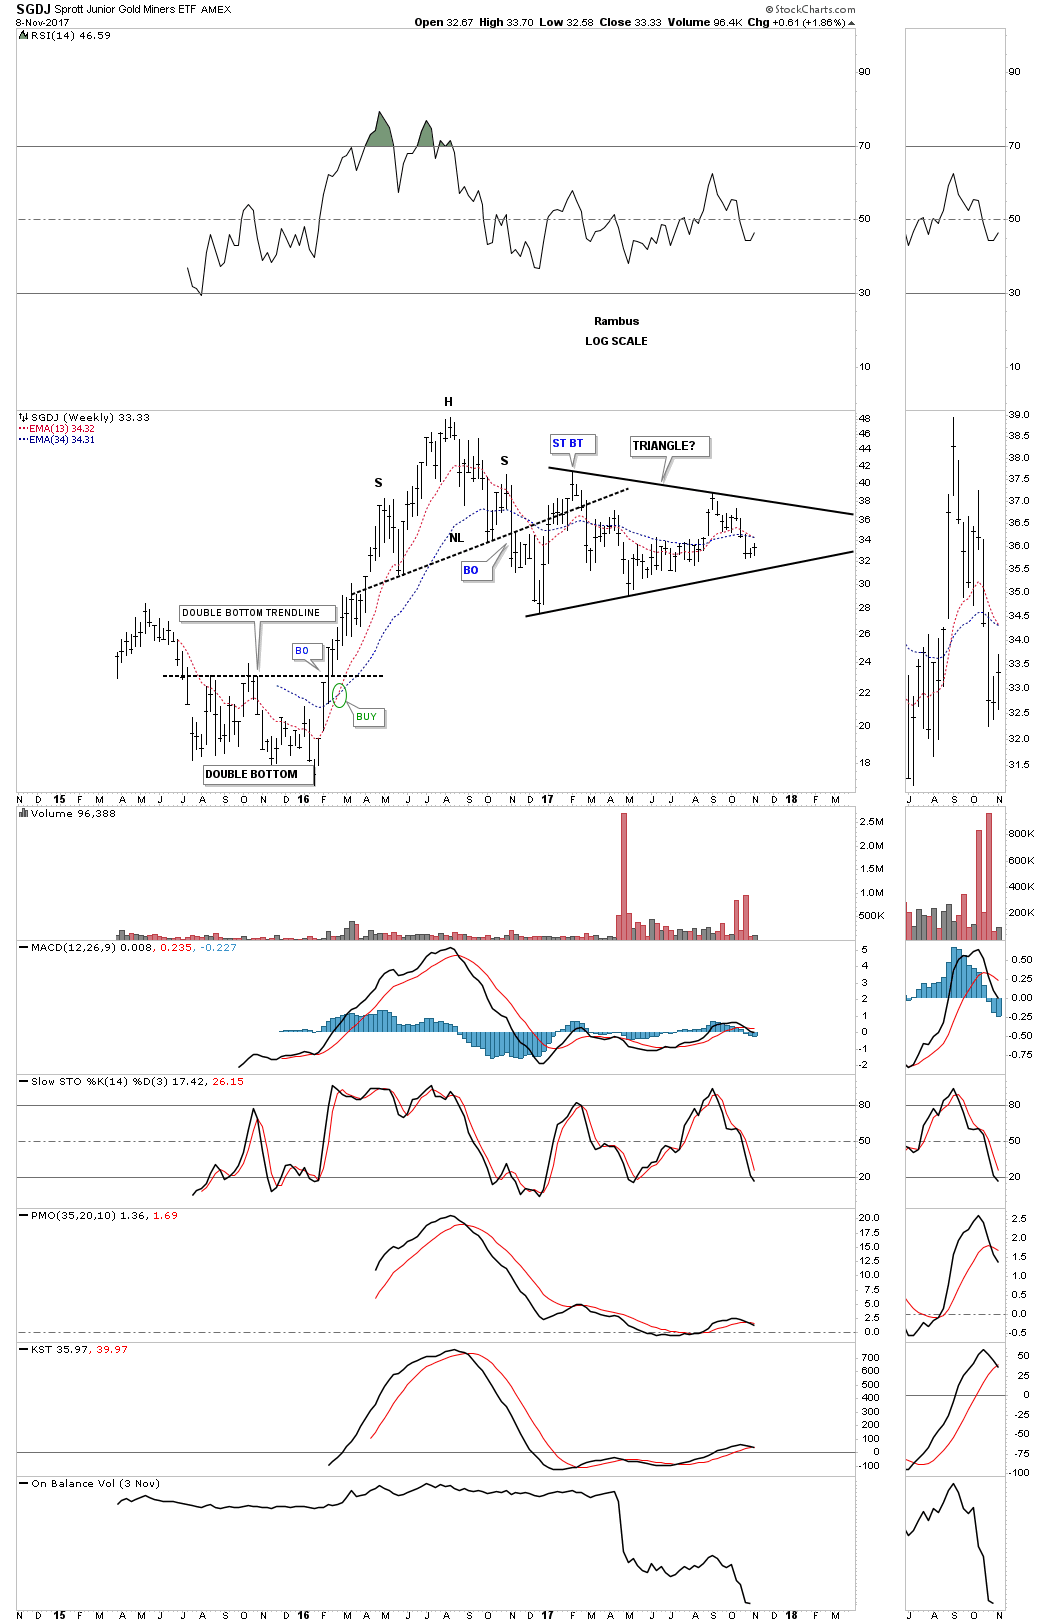
SGDJ weekly:
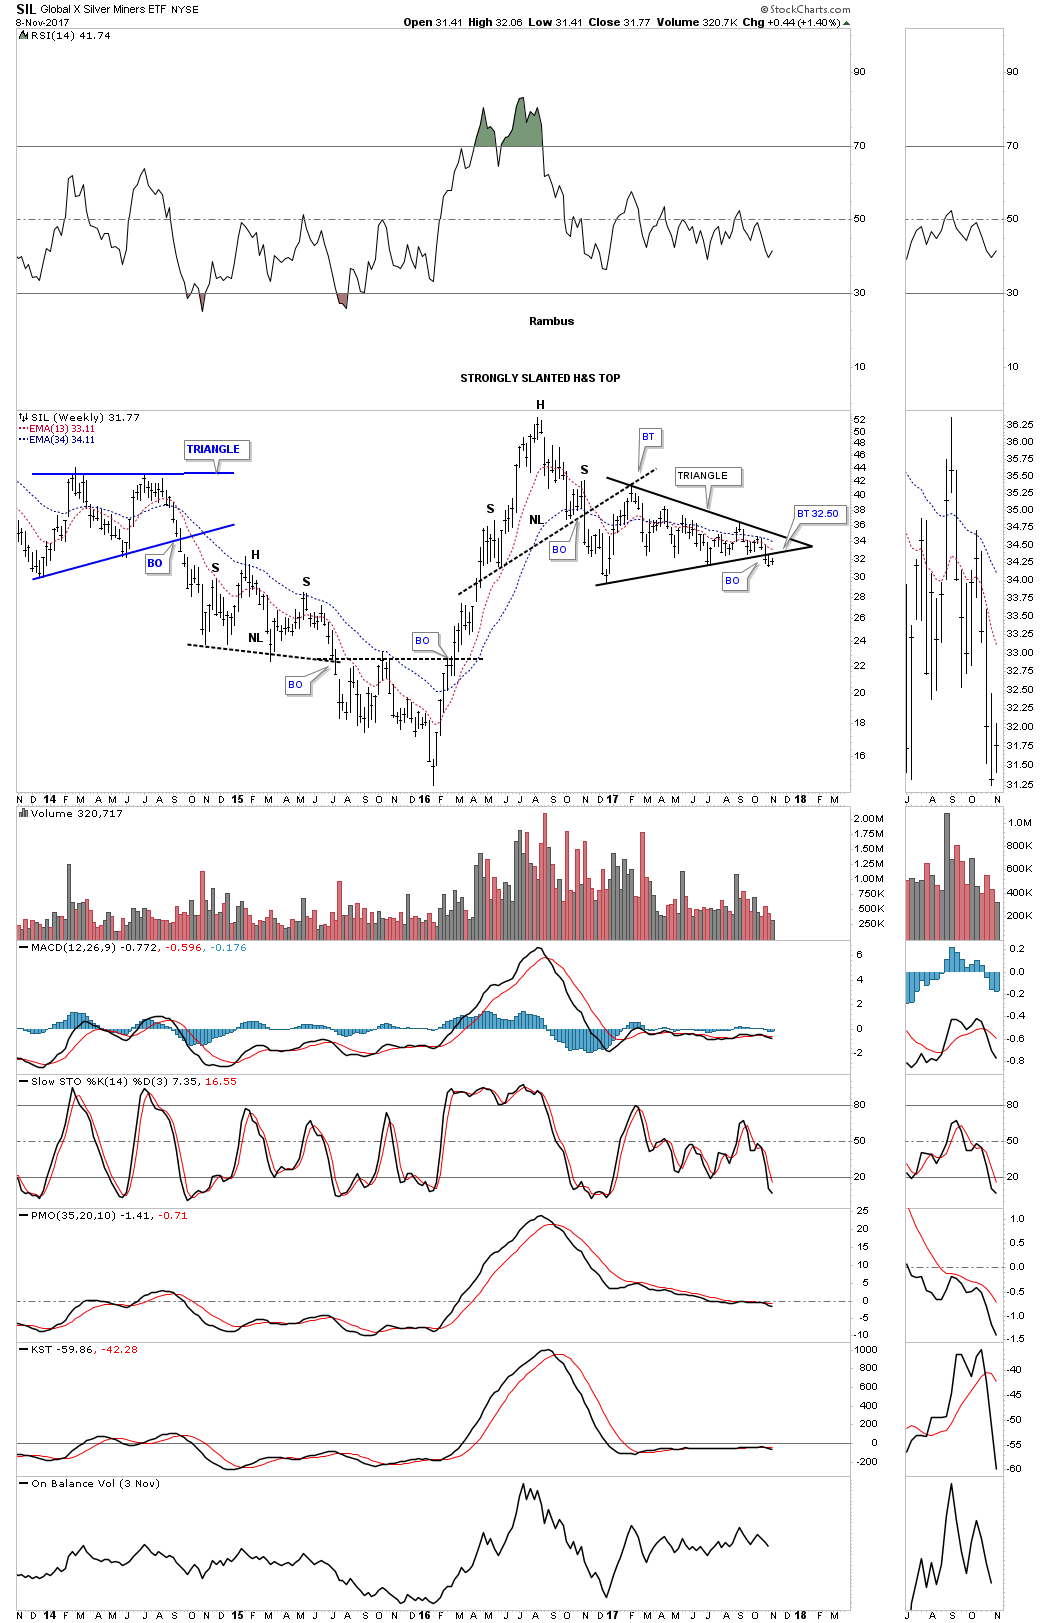
SIL weekly:
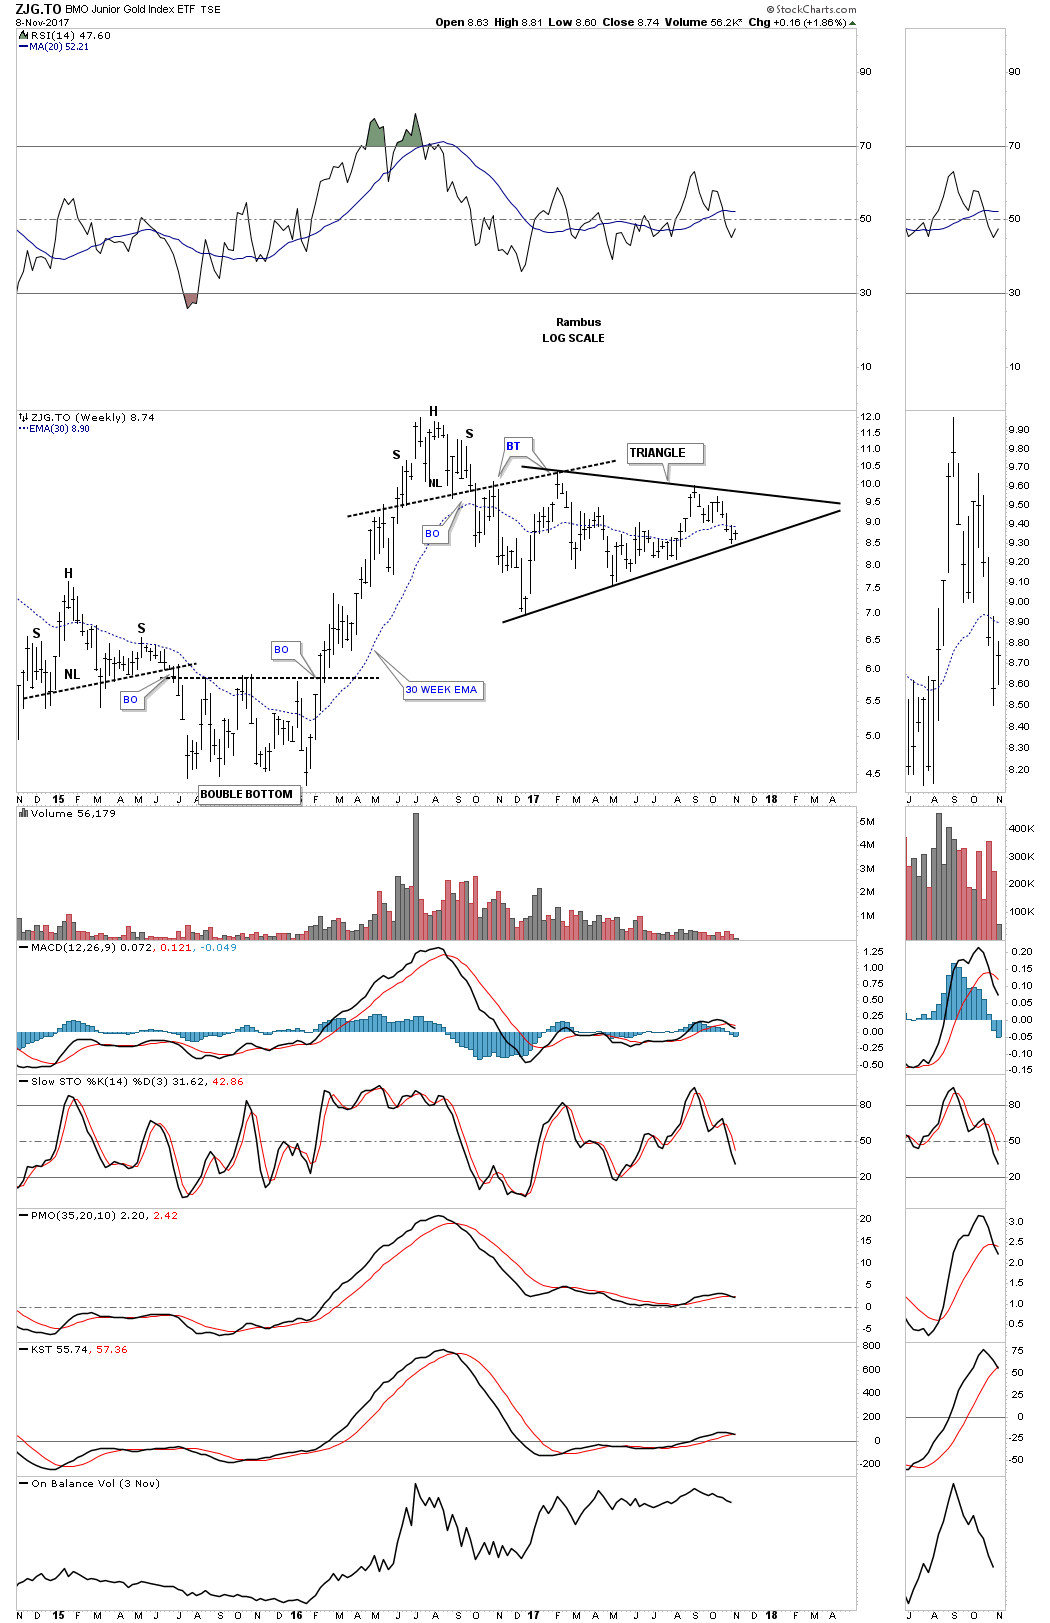
ZIG.TO weekly:
The last chart for tonight is a long term weekly look at gold which shows the bulls still have a fighting chance if they can hold the backtest. All the best…Rambus
